Related pairs
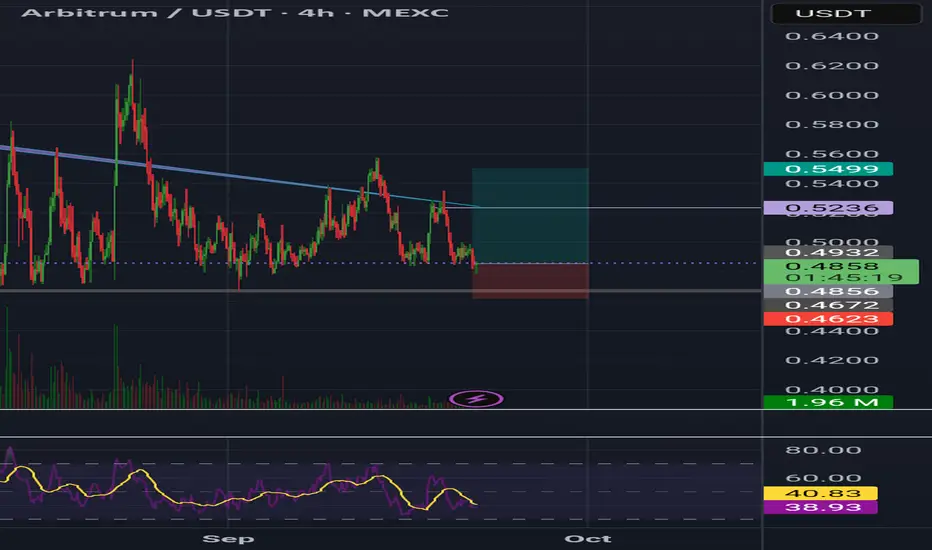
It's a time for ARBUSDT - POTENTIAL TARGET 0.50 $On the Arbitrum (ARB/USDT, 4h) chart, we can see that after a strong downtrend, the price found support around the $0.42 level, where a local bottom was formed. From that point, the market began a recovery, pushing the price up toward the $0.46–$0.47 zone before entering a corrective pullback.
Curr

ARBUSDT D1 Bullish ScenarioIn the ARB price chart, the price is in a daily demand range and we are witnessing a positive hidden divergence in the MACD. We can expect a growth of at least 20% for this currency.

#ARB/USDT (ARB): Looking For Buy Entry | 2 Zones To Keep an Ey#ARB
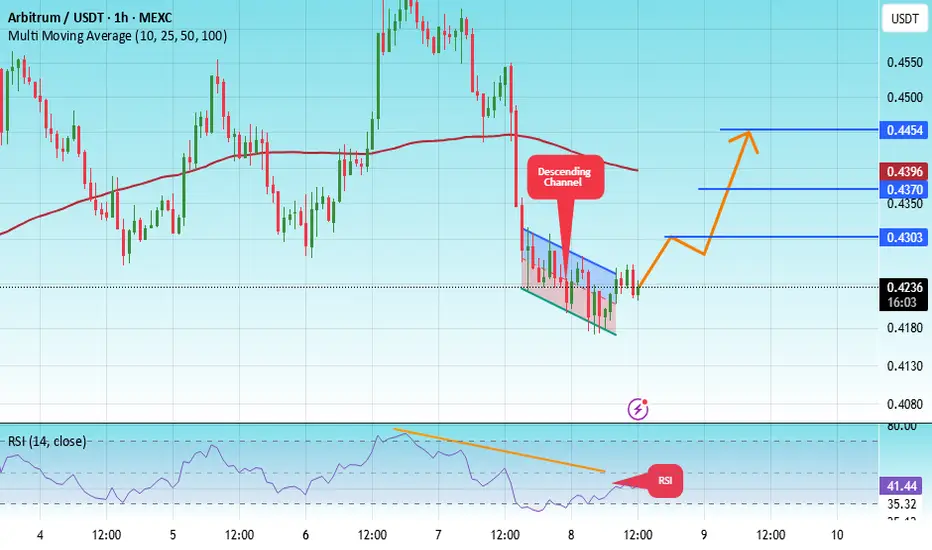
The price is moving within a descending channel on the 1-hour frame, adhering well to it, and heading for a strong breakout and retest.
We have a bearish trend on the RSI indicator that is about to be broken and retested, which supports the upward breakout.
There is a major support area in g

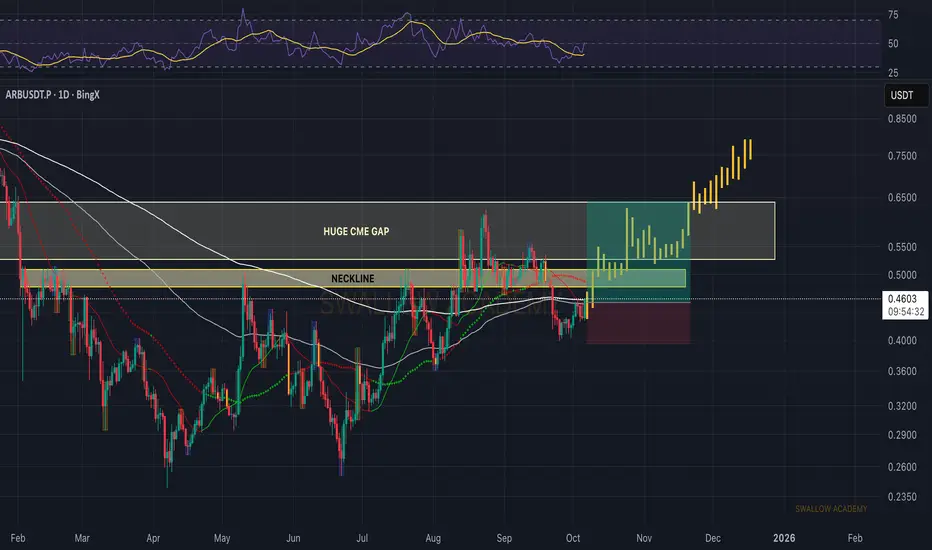
Arbitrum (ARB): Very Huge CME Gap | Magnet ZoneARB is showing early signs of reversal as buyers start regaining momentum near the neckline. Price has been consolidating tightly, and now the focus shifts to a possible breakout toward the upper zone.
The huge CME gap above remains unfilled and usually acts as a magnet — that’s the zone we’re tar
Monthly Crypto Analysis: Arbitrum (ARBUSD) – Issue 95 The analyst believes that the price of Arbitrum will decrease within the time specified on the countdown timer. This prediction is based on a quantitative analysis of the price trend.
___Please note that the specified take-profit level does not imply a prediction that the price will reach that poin

BUY AND HOLDHello friends
Given the price reaching the bottom and the floor that this currency has made, we can expect its price to grow because the buyers at the bottom pushed the price up and now we are in a correction, which is a good opportunity to buy with capital and risk management and in steps and move

Arbitrum (ARB): Looking For Buy Entry | 2 Zones To Keep an EyeArbitrum caught our attention with potential buy zones that we might be seeing pretty soon. We are looking for slight downward movement from here toward the major CME gap, which would be an ideal area for a buy entry, once we form the proper MSB there, so that's what we are looking for.
Swallow Aca

#ARB/USDT Analysis: Breakout Potential with Overbought RSI !#ARB
The price is moving within a descending channel on the 1-hour frame, adhering well to it, and is heading for a strong breakout and retest.
We have a bearish trend on the RSI indicator that is about to be broken and retested, which supports the upward breakout.
There is a major support area i
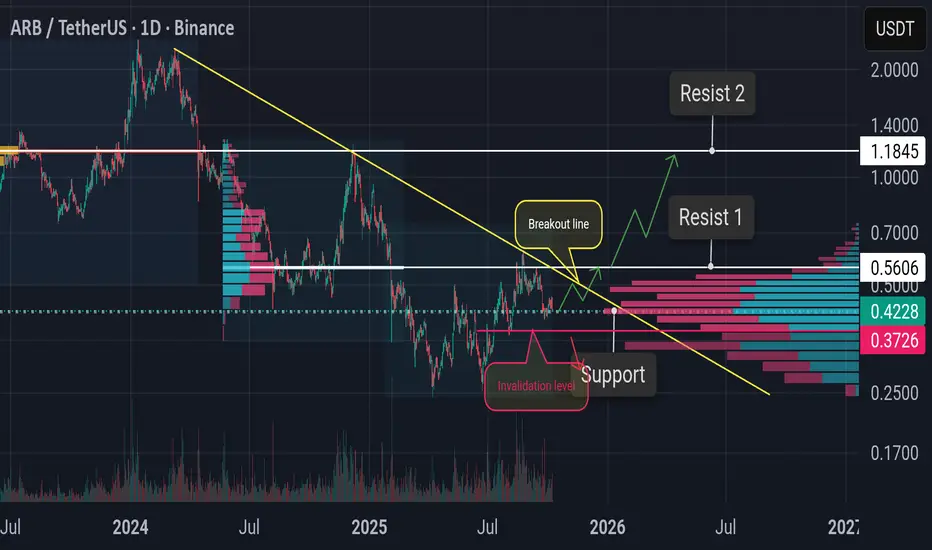
ARB Rebound Alert !!!🔥 ARB is showing a strong bounce from the key support at 0.4235 — this level is crucial for a potential rebound toward Resistance 1 at 0.5606 💪
⚡ The yellow line = breakout line, needs to be broken to confirm a reversal into a bull trend 🚀
Once it breaks out, the path toward Resistance 2 (1.1845) l
See all ideas
Summarizing what the indicators are suggesting.
Oscillators
Neutral
SellBuy
Strong sellStrong buy
Strong sellSellNeutralBuyStrong buy
Oscillators
Neutral
SellBuy
Strong sellStrong buy
Strong sellSellNeutralBuyStrong buy
Summary
Neutral
SellBuy
Strong sellStrong buy
Strong sellSellNeutralBuyStrong buy
Summary
Neutral
SellBuy
Strong sellStrong buy
Strong sellSellNeutralBuyStrong buy
Summary
Neutral
SellBuy
Strong sellStrong buy
Strong sellSellNeutralBuyStrong buy
Moving Averages
Neutral
SellBuy
Strong sellStrong buy
Strong sellSellNeutralBuyStrong buy
Moving Averages
Neutral
SellBuy
Strong sellStrong buy
Strong sellSellNeutralBuyStrong buy
Displays a symbol's price movements over previous years to identify recurring trends.
Frequently Asked Questions
The current price of ARB3xLong/Tether (ARB) is 0.05561 USDT — it has risen 3.19% in the past 24 hours. Try placing this info into the context by checking out what coins are also gaining and losing at the moment and seeing ARB price chart.
ARB3xLong/Tether price has fallen by −1.93% over the last week, its month performance shows a −47.06% decrease, and as for the last year, ARB3xLong/Tether has decreased by −95.44%. See more dynamics on ARB price chart.
Keep track of coins' changes with our Crypto Coins Heatmap.
Keep track of coins' changes with our Crypto Coins Heatmap.
ARB3xLong/Tether (ARB) reached its highest price on Dec 6, 2024 — it amounted to 5.64730 USDT. Find more insights on the ARB price chart.
See the list of crypto gainers and choose what best fits your strategy.
See the list of crypto gainers and choose what best fits your strategy.
ARB3xLong/Tether (ARB) reached the lowest price of 0.00820 USDT on Aug 5, 2024. View more ARB3xLong/Tether dynamics on the price chart.
See the list of crypto losers to find unexpected opportunities.
See the list of crypto losers to find unexpected opportunities.
The safest choice when buying ARB is to go to a well-known crypto exchange. Some of the popular names are Binance, Coinbase, Kraken. But you'll have to find a reliable broker and create an account first. You can trade ARB right from TradingView charts — just choose a broker and connect to your account.
Crypto markets are famous for their volatility, so one should study all the available stats before adding crypto assets to their portfolio. Very often it's technical analysis that comes in handy. We prepared technical ratings for ARB3xLong/Tether (ARB): today its technical analysis shows the strong sell signal, and according to the 1 week rating ARB shows the sell signal. And you'd better dig deeper and study 1 month rating too — it's sell. Find inspiration in ARB3xLong/Tether trading ideas and keep track of what's moving crypto markets with our crypto news feed.
ARB3xLong/Tether (ARB) is just as reliable as any other crypto asset — this corner of the world market is highly volatile. Today, for instance, ARB3xLong/Tether is estimated as 9.81% volatile. The only thing it means is that you must prepare and examine all available information before making a decision. And if you're not sure about ARB3xLong/Tether, you can find more inspiration in our curated watchlists.
You can discuss ARB3xLong/Tether (ARB) with other users in our public chats, Minds or in the comments to Ideas.