Bounce Token (Auction) to $100 over the next 120 daysOn the month of August 2023 at a price of $4 Without Worries published “Bounce Token (Auction) to $40” (see below / green triangle on chart above). Price action went 10x over the next 120 days. Almost worth getting out of bed for. Then the idea “Auction to $16” (see below / red triangle) was publish

AUCTION/USDT — Major Accumulation or Bearish Continuation?🔎 Overview
The AUCTION/USDT pair is currently moving sideways within the critical demand zone of $7.02 – $9.55 (yellow box). This area has acted as a strong accumulation level since July, serving as the last line of defense for buyers before potential continuation to the downside.
The mid-term str

AUCTION CAN SEE A SHOT TREND TO UP $14 by confirmationAUCTION CAN SEE A SHOT TREND TO UP $14 by confirmation
AUCTION/USDT one of the coins that shows a pre-increase ( checking if it can get proof next hours). When this gets confirmed, there is a high chance ofa breakout.
When new updates coming will add here below at this chart.
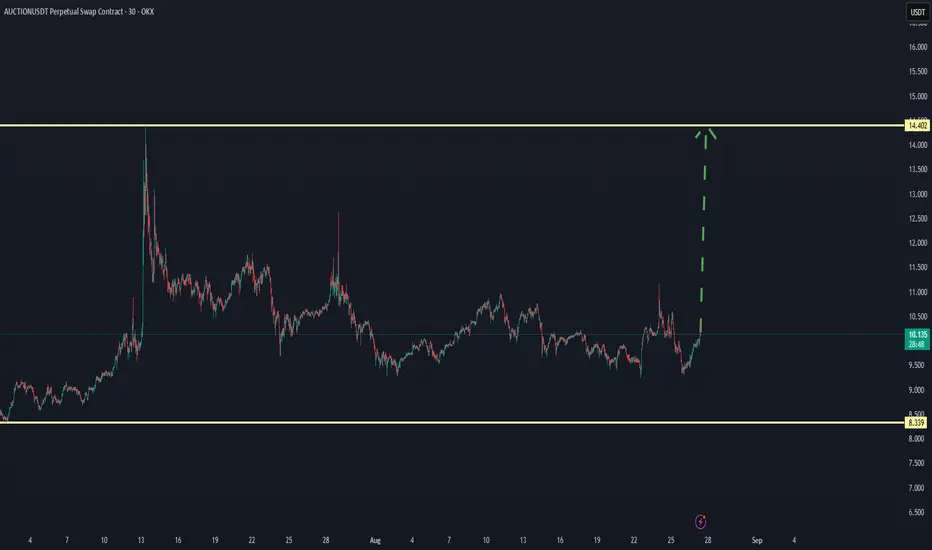
#AUCTION/USDT#AUCTION
The price is moving within an ascending channel on the 1-hour frame, adhering well to it, and is on track to break it strongly upwards and retest it.
We have support from the lower boundary of the ascending channel, at 9.09.
We have a downtrend on the RSI indicator that is about to break

#AUCTION/USDT ready to pump ?#AUCTION
The price is moving within a descending channel on the 1-hour frame, adhering well to it, and is on its way to breaking it strongly upwards and retesting it.
We have a bounce from the lower boundary of the descending channel. This support is at 10.68.
We have a downtrend on the RSI indic

#AUCTION/USDT#AUCTION
The price is moving within a descending channel on the 1-hour frame, adhering well to it, and is heading for a strong breakout and retest.
We are experiencing a rebound from the lower boundary of the descending channel, which is support at 11.40.
We are experiencing a downtrend on the RSI

#AUCTION/USDT#AUCTION
The price is moving within a descending channel on the 1-hour frame, adhering well to it, and is heading towards a strong breakout and retest.
We are experiencing a rebound from the lower boundary of the descending channel, which is support at 10.73.
We are experiencing a downtrend on th

$AUCTION Breakout +35% Target!$AUCTION has broken out of a descending triangle on the 4H chart and is now retesting the breakout zone around $10.89.
If this support holds, a move toward the $14.20 target +35.6% is likely.
Momentum looks bullish, watch for follow-through!
DYRO, NFA

#AUCTION/USDT#AUCTION
The price is moving within a descending channel on the 1-hour frame, adhering well to it, and is heading for a strong breakout and retest.
We are seeing a bounce from the lower boundary of the descending channel, which is support at 11.26.
We have a downtrend on the RSI indicator that is

$AUCTIONUSDT ready to pump after putting a bullish divergenceBINANCE:AUCTIONUSDT has been very bearish for weeks following a massive drop. It did put a double bottom and a bullish divergence, which are signs of market reversal i.e. a shift from bearish trend to bullish move. It broke the resistance zone which also serves as the neckline for the double bottom

See all ideas
Summarizing what the indicators are suggesting.
Oscillators
Neutral
SellBuy
Strong sellStrong buy
Strong sellSellNeutralBuyStrong buy
Oscillators
Neutral
SellBuy
Strong sellStrong buy
Strong sellSellNeutralBuyStrong buy
Summary
Neutral
SellBuy
Strong sellStrong buy
Strong sellSellNeutralBuyStrong buy
Summary
Neutral
SellBuy
Strong sellStrong buy
Strong sellSellNeutralBuyStrong buy
Summary
Neutral
SellBuy
Strong sellStrong buy
Strong sellSellNeutralBuyStrong buy
Moving Averages
Neutral
SellBuy
Strong sellStrong buy
Strong sellSellNeutralBuyStrong buy
Moving Averages
Neutral
SellBuy
Strong sellStrong buy
Strong sellSellNeutralBuyStrong buy
Displays a symbol's price movements over previous years to identify recurring trends.