AVA is a safe investmentThe chart shows everything obviously... The candles are in a triangle pattern and it may break this triangle from the above side. If it can pass the 3.5$ resistance, it can continue its way to first 4.2 then 5.2 and perhaps above. The RSI is in increased channel as well.
Trade ideas

AVAUSDT Technical Analysis⏳ Spot
💎 AVAUSDT has formed a symmetrical triangle. it has got 2 rejection from the resistance line and after the last rejection it has gone to the pullback zone. it is expected that it starts it's Bullish move from the Pullback zone
🌐 Tradingview
🏁 Short & Medium Term
💵 Invest Only 5% of your Portfolio
🎳 Entry at Market or at 2.800
☕️ TP1 3.500
🍺 TP2 3.800
🍻 TP3 4.300
🍾 TP4 5.600
🍷 TP5 6.500
🍸 TP6 _____
🍹 TP7 _____
🎁 TP8 _____
🚫 SL 2.690
Good Luck 🎲
Check the Links in Description and If you LIKE this analysis, Please support our page and Ideas by hitting the LIKE 👍 button. ❤️ Your Support is really appreciated! ❤️
Traders, if you have your own opinion about it, please write your own in the comment box. We will be glad for this.
Feel free to request any pair/instrument analysis or ask any questions in the comment section below.
We will have more FREE forecasts in TradingView soon
Have a Profitable Day


The best opportunity in AVA Profit 100%AVA/USDT will blow up in the next hours.
Good Luck
Share some coins.

The opportunity in AVA
The opportunity in AVA
The entry point is 3.2-3.1$
First target 3.7$
second target 3.9$
third target 4.3$

AVA The Next Weeks!in a nice consolidation pattern. A decision will be made in the coming weeks. Most likely will break out (maybe not the first time)
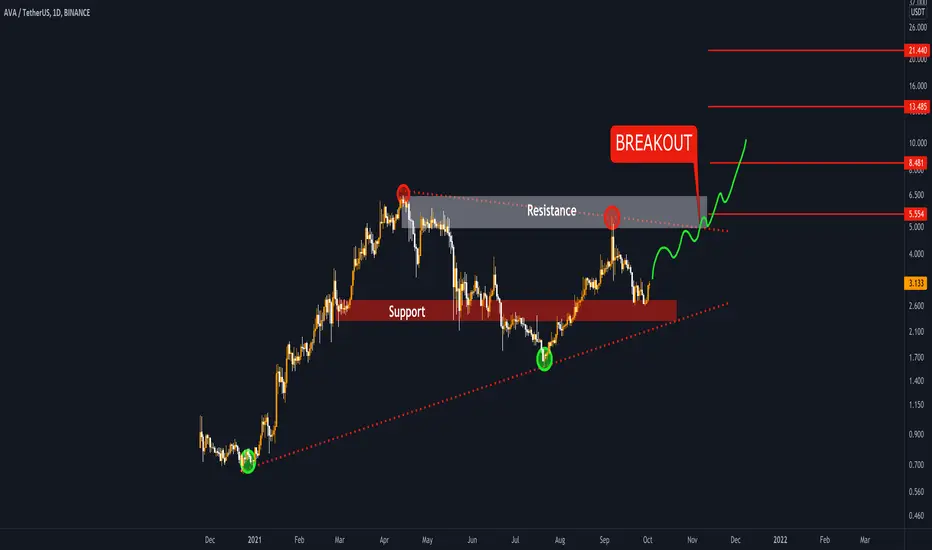


Symmetrical Triangle Breakout - crypto analysis Crypto Analysis: AVAUSDT has broken the symmetrical triangle, it good buy around immediate demand area with below demand area as stop loss for the target given on the chart. let's see
Happy Mining!

AVA/USDT will blow upYou don't want to miss this opportunity. You don't want to miss this opportunity. You don't want to miss this opportunity. You don't want to miss this opportunity. You don't want to miss this opportunity. You don't want to miss this opportunity. You don't want to miss this opportunity. You don't want to miss this opportunity. You don't want to miss this opportunity.

Bullish AVAAfter breakout from falling wedge, possible a bull run will happen this comming weeks
It can reach $4.6 for the 1st targrt and can record for an all time high at $6.5- $12
Not a financial advise
Trade at your own risk

🆓Travala.com (AVA) Sep-8 #AVA $AVAAVA is recovering from a strong correction from the $5 zone, and this buying may help AVA continue to rise back to the $5 and $6 zones this September. But if it loses the 3.5$ zone, the downtrend will officially start
📈BUY
🔴Buy : 3.9-4.1$ if A
🔴Buy : 3.4-3.6. SL if B
📉SELL
🔴Sell : 4.88-5.12$. SL if A
🔴Sell : 5.85-6.15$. SL if A
♻️BACK-UP
🔵Sell : 3.4-3.6$ if B. SL if A
🔵Buy : 2.93-3.07$ if A. SL if B
🔵Buy : 2.44-2.56$. SL if B
❓Details
📈Red Arrow : Main Direction as BUY and SELL section
📉Blue Arrow : Back-Up Direction as BACK-UP section
🟩Green zone : Support zone as BUY section
🟥Red zone : Resistance zone as SELL section
🅰️A : The Close price of 1-day candlestick is Above the zone
🅱️B : The Close price of 1-day candlestick is Below the zone

Update on AVA Idea 3 Days AgoAs posted previously this was going to be some easy money and 48% in 3 days, target hit and happy days.


AVAUSDT with potential BIG MOVES
Last time i said AVAUSDT was gonna make a big move and this might be it for Confirmation wait for retest after breakout because it might be a false breakout
wait for STRONG BULLISH ENGULFING PATTERNS WITH RSI ABOVE 55
Once all conditions met just put in the entry of 1ATR and 1.5 RISK TO REWARD RATIO for TP
Thats all from me lads and HAPPY TRADING ;)

AVAUSDT with potential BIG MOVESAVAUSDT has been testing the 4H time frame support forming a downward triangle, which could cause high movement.
Two breakouts may occur, entry will only trigger after breakouts and retest with a healthy biased position pattern like:
ENGULFING PATTERNS, DOJI STAR, HAMMER
&
RSI at 55 for bullish and 45 for bearish
Once all conditions met, SL will be 1ATR with a 1.5 Risk to Reward ratio for TP
Thats all from me and HAPPY TRADING LADS ;)

AVAUSDT🌟this chart is lower frames shows a H&D formation + a double top touched by chart by none of these are our main goal for entering this one because it has a nice candle respond to the bulls and they are going to be in favor of bulls for now and we can make profit out of it
👉This idea has the confirmation of "advanced price action" 👍
👉Follow us and invite your friends too, this way we can share ideas and signal to anyone we care 👍
👉Hit share and spread the information in public chats or your twitter for everybody to get profit 👍
👉Tell us what's important for you in the market or what asset makes a difference in your investment basket 👍

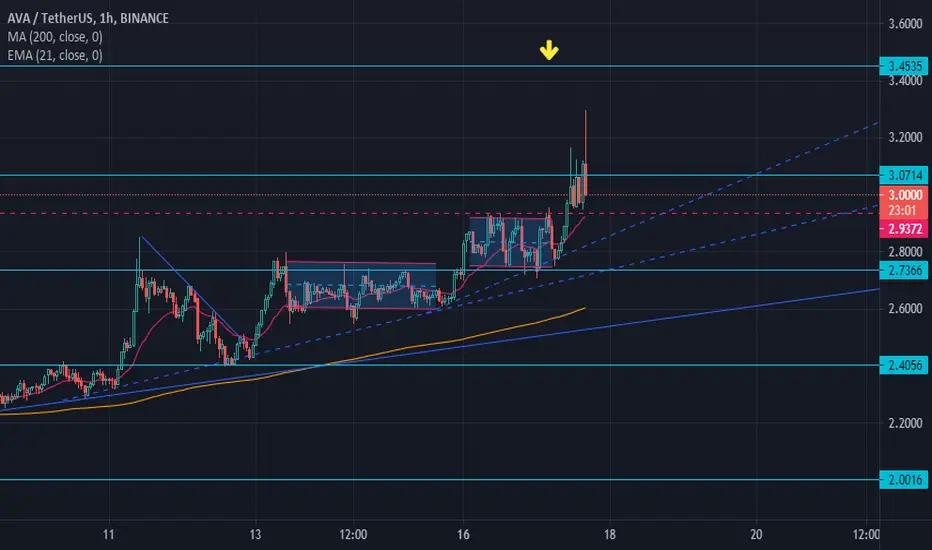
Hammer with 20/50/100/200 Moving average crossesHammer with 20/50/100/200 Moving average crosses its indicating that AVA might be bounce up targeting 4 soon m we need a daily close above 2.98 for the confirmation

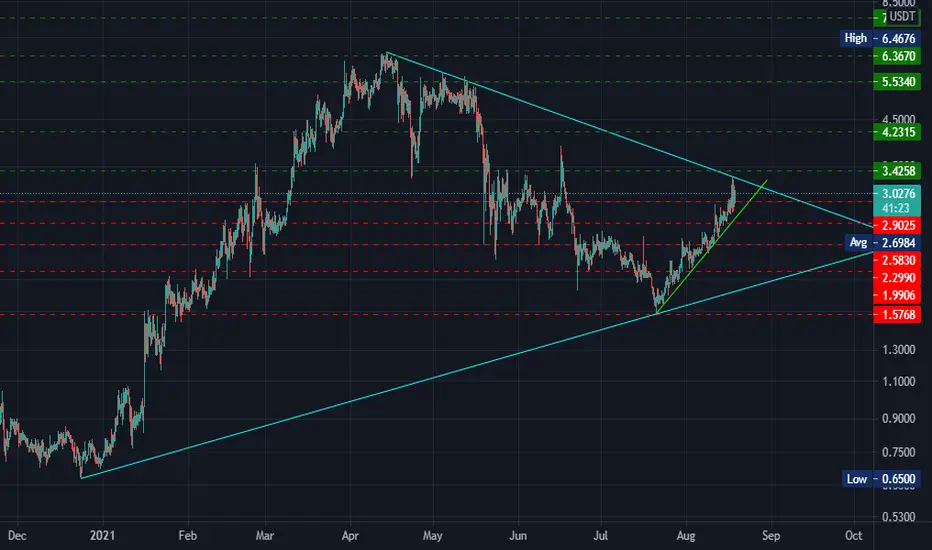
AVAUsdt Last resisdance on wayAva can break this littleneed help BTC save area and this going up slowly butstable
GL
Supports:
2.9025 >>Entry Point
2.5830
2.2990
1.9906
Resisdance is Blue trend line
Targets :
3.4258
4.2315
5.5340
6.3670
Targets for HODL:
7.7870
11.3542
GOAL:
14.8502
20.8970
GL
View on AVA/USDT - ready for next up move.View on #AVA/USDT - ready for next up move.
Buy and Add on Dips till 2.25%, sl at $2. Go long for 6$, $9.

$AVA- Let's Do This Travala!Gearing to cross the 200 day moving average(see DTF).
$Btc gotta let you travel!