AVA - Trading idea, probability of repetition
👋 Hello, traders! The previous trading idea played out successfully. Since its publication, the price surged up to +642% at its peak. In this case, I managed to capture almost the maximum profit because the pump happened with a single large candle without pullbacks, and I trailed the stop-loss a
Related pairs

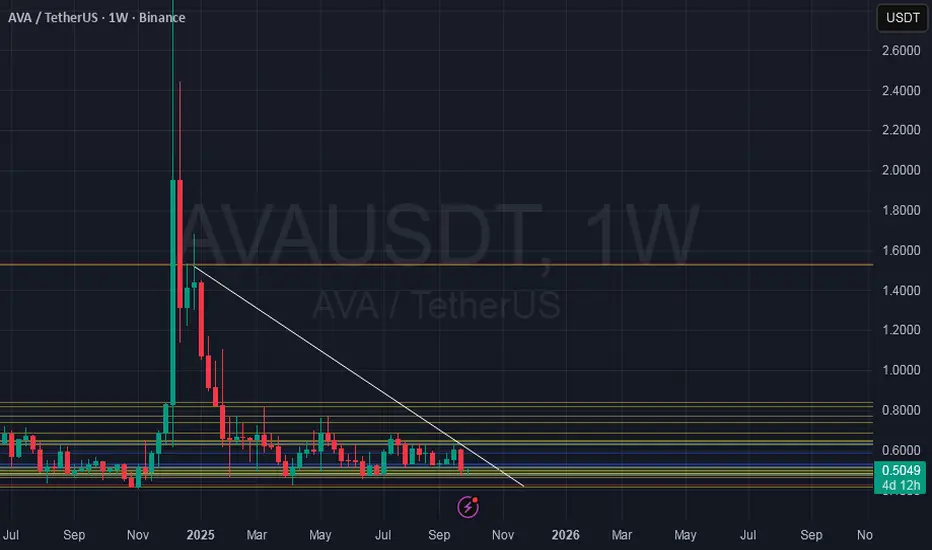
Travala AVA - Interesting buying oportunityAVA is trading near a long-term support zone around $0.37, a level that has repeatedly acted as a historical floor. The token has been consolidating for months within a descending channel, and current price action suggests potential accumulation.
The broader trend remains neutral-to-bearish, but mo
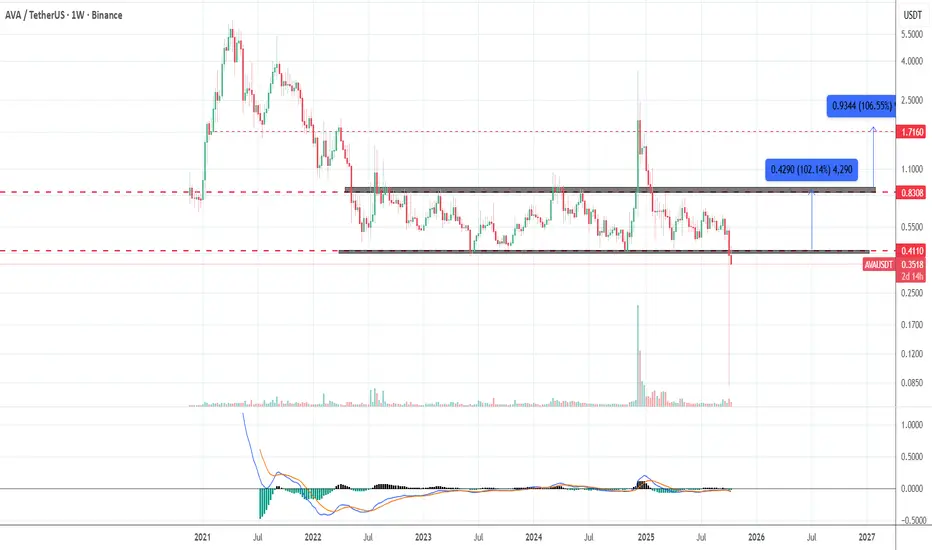
AVA market snapshotAVA looks very interesting for the long term if it reclaims the $0.40 level. There’s potential for a 200% profit.
If the level is reclaimed, it would be a fake breakdown of the range. In that case, the prolonged accumulation would be a consolidation phase, which usually leads to a strong breakout.
AVAUSDT EXPECTED BULLISH MOVEEven if the crypto market remains red, there are projects that will do well and i am pretty sure AVAUSDT is one of the major move makers.
Lets see how it plays out at the END.
AVA/USDT —Demand Zone: Accumulation or Deeper Breakdown?📌 Overview
The AVA/USDT weekly chart shows a dramatic journey:
From the 2021 peak ($6–7), price has been in a prolonged downtrend followed by sideways consolidation since 2022.
For nearly 3 years, the yellow zone ($0.38 – $0.45) has acted as a battlefield between buyers and sellers.
Each test of
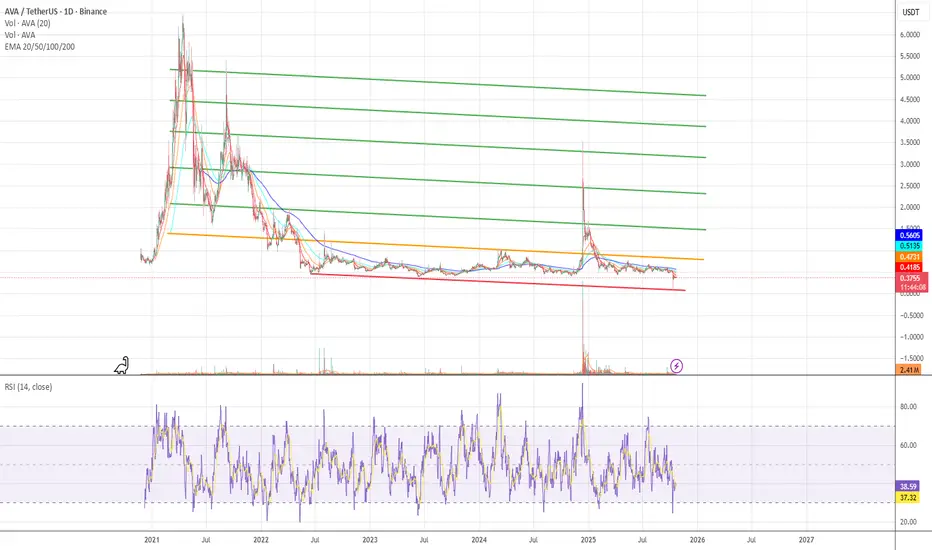
$AVA/USDT is Heating Up Are We About to See a Big Move?NYSE:AVA is testing a key descending trendline on the 6H chart.
A breakout above this level could trigger strong upside momentum.
Immediate targets are $0.5605, $0.6237, and $0.6776 with the potential to reach $0.7690.
I'm watching for breakout confirmation.
DYOR, NFA.

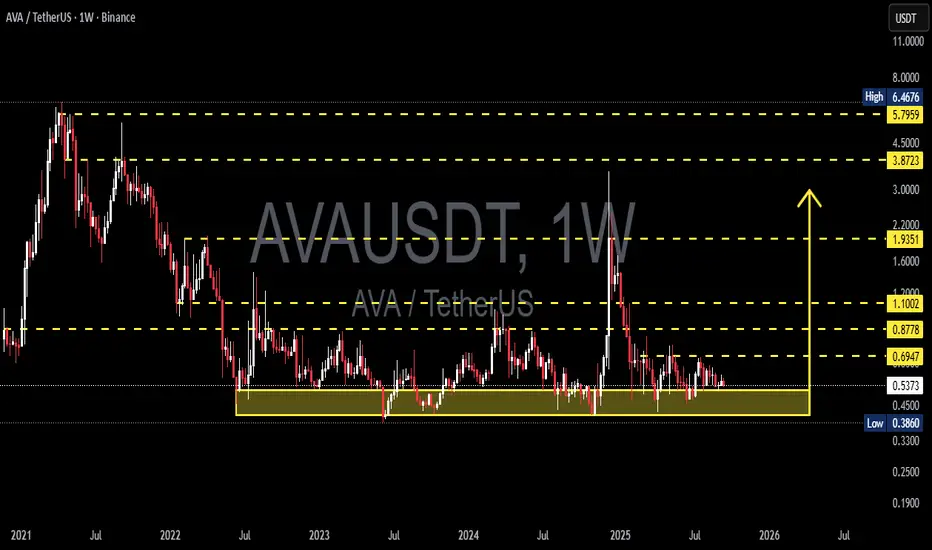
AVA/USDT Ready to Explode from Multi-Year Accumulation Zone! 📊 Technical Breakdown:
Major Accumulation Zone (Strong Support):
Price is currently trading within a long-term accumulation zone between $0.3860 - $0.5095 (highlighted in yellow). This zone has been tested multiple times since 2022 and has proven to be strong support.
Reversal Potential:
A project


Travala Goes Bullish, The Wait Is Over —1,150% Profits PotentialHere it is, this is the same chart I shared back in early March this year. Notice the green line and the buy zone. It has been only two months and this zone was activated and the action is now moving back above it; this is ultra-bullish.
In the 8-March 2025 publication I mentioned that we should be

Ava-Bullish Setup Forming higher lows. Break above resistance may trigger strong upside.
BINANCE:AVAUSDT

See all ideas
Summarizing what the indicators are suggesting.
Oscillators
Neutral
SellBuy
Strong sellStrong buy
Strong sellSellNeutralBuyStrong buy
Oscillators
Neutral
SellBuy
Strong sellStrong buy
Strong sellSellNeutralBuyStrong buy
Summary
Neutral
SellBuy
Strong sellStrong buy
Strong sellSellNeutralBuyStrong buy
Summary
Neutral
SellBuy
Strong sellStrong buy
Strong sellSellNeutralBuyStrong buy
Summary
Neutral
SellBuy
Strong sellStrong buy
Strong sellSellNeutralBuyStrong buy
Moving Averages
Neutral
SellBuy
Strong sellStrong buy
Strong sellSellNeutralBuyStrong buy
Moving Averages
Neutral
SellBuy
Strong sellStrong buy
Strong sellSellNeutralBuyStrong buy
Frequently Asked Questions
The current price of AVA / Tether SPOT (AVA) is 0.3506 USDT — it has fallen −0.88% in the past 24 hours. Try placing this info into the context by checking out what coins are also gaining and losing at the moment and seeing AVA price chart.
AVA / Tether SPOT price has risen by 3.82% over the last week, its month performance shows a −12.93% decrease, and as for the last year, AVA / Tether SPOT has decreased by −59.66%. See more dynamics on AVA price chart.
Keep track of coins' changes with our Crypto Coins Heatmap.
Keep track of coins' changes with our Crypto Coins Heatmap.
AVA / Tether SPOT (AVA) reached its highest price on Jan 30, 2025 — it amounted to 0.9094 USDT. Find more insights on the AVA price chart.
See the list of crypto gainers and choose what best fits your strategy.
See the list of crypto gainers and choose what best fits your strategy.
AVA / Tether SPOT (AVA) reached the lowest price of 0.0779 USDT on Oct 10, 2025. View more AVA / Tether SPOT dynamics on the price chart.
See the list of crypto losers to find unexpected opportunities.
See the list of crypto losers to find unexpected opportunities.
The safest choice when buying AVA is to go to a well-known crypto exchange. Some of the popular names are Binance, Coinbase, Kraken. But you'll have to find a reliable broker and create an account first. You can trade AVA right from TradingView charts — just choose a broker and connect to your account.
Crypto markets are famous for their volatility, so one should study all the available stats before adding crypto assets to their portfolio. Very often it's technical analysis that comes in handy. We prepared technical ratings for AVA / Tether SPOT (AVA): today its technical analysis shows the sell signal, and according to the 1 week rating AVA shows the sell signal. And you'd better dig deeper and study 1 month rating too — it's strong sell. Find inspiration in AVA / Tether SPOT trading ideas and keep track of what's moving crypto markets with our crypto news feed.
AVA / Tether SPOT (AVA) is just as reliable as any other crypto asset — this corner of the world market is highly volatile. Today, for instance, AVA / Tether SPOT is estimated as 3.85% volatile. The only thing it means is that you must prepare and examine all available information before making a decision. And if you're not sure about AVA / Tether SPOT, you can find more inspiration in our curated watchlists.
You can discuss AVA / Tether SPOT (AVA) with other users in our public chats, Minds or in the comments to Ideas.