AVAX - NEUTRAL AREA WEEKLY. CRYPTOCAP:AVAX - update:
Neutral on the daily basis.
No price direction & Very neutral zone .
Levels to watch:
25.30 - 35.30
Locals supports:
28.80 - 28.150 - 27.00 - 25.30 - 25.00
No direction yet, neutral on almost all TF.
On the H1 view, do you see a bearish flag, or an ascending channels? 👀
Bullish area & HTF consolidation possible above 25.00$
A buy signal could be trigger in case of weekly candle break above 35.50$! 🎯
AVAXUSDT.P trade ideas
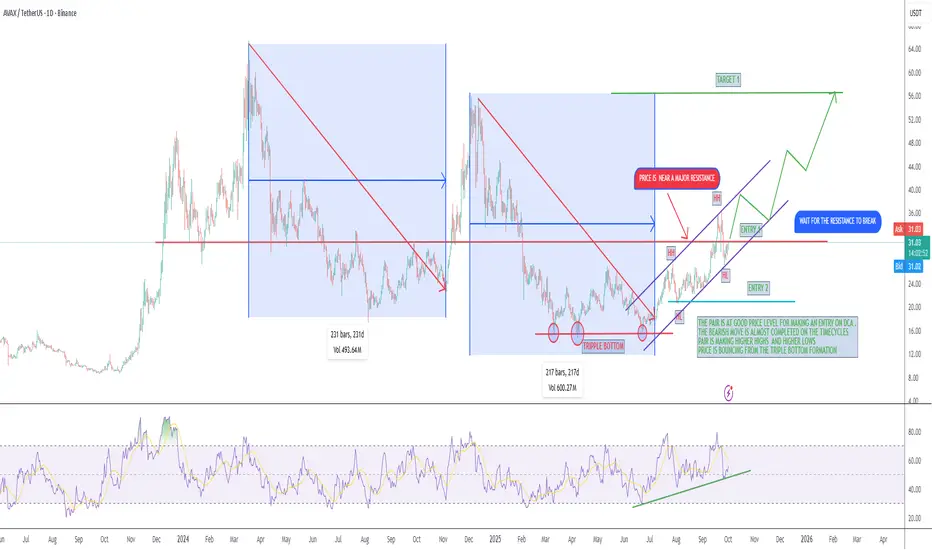
AVAX/USDT IS AT LUCRATIVE LEVELS TO ENTER THE BULL RUNThe pair AVAX/USDT seems to be in a bullish run as the price is bouncing from the Triple Bottom formation and making new HH's and HL's and respecting the trend lines.
we can enter the pair for a long with building positions on DCA and if the price comes below we can make another entry on DCA.
The ALT's Season is expected and the pair may give good results.
What are your views ??????
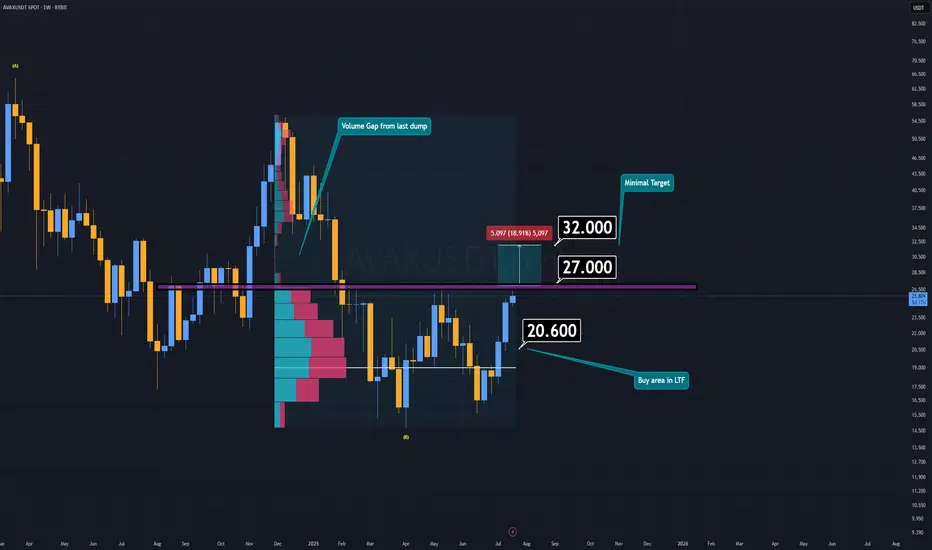
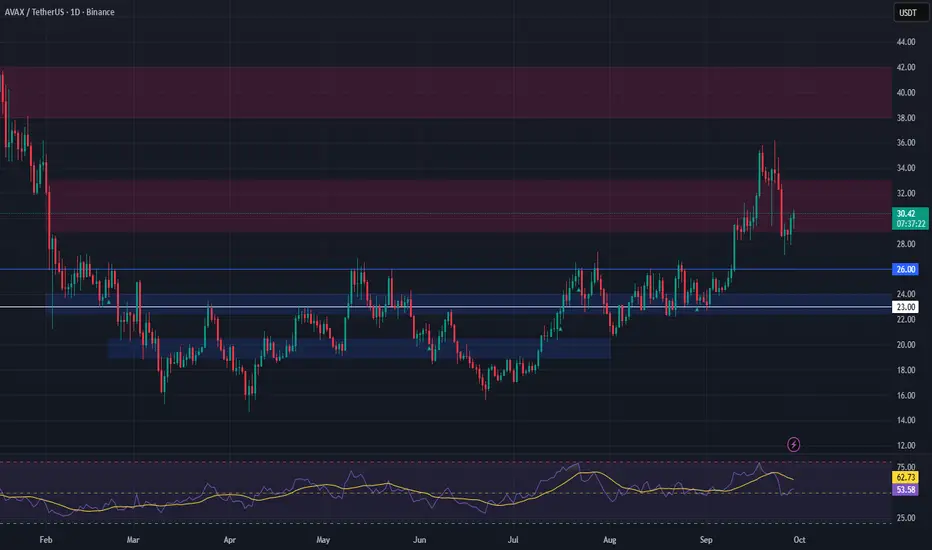
AVAX Analysis (1W)AVAX is currently attempting to form a double bottom pattern, which could signal a strong bullish reversal if confirmed. Earlier this week, AVAX made an effort to break down the key support/resistance zone, but it lacked the necessary volume to succeed.
If AVAX manages to reclaim the resistance area around $27 or higher, and confirms the breakout with a daily candle retest, the minimum target sits at $32.
However, if AVAX fails to break through resistance, there’s potentially an even better buying opportunity in the lower timeframes—a demand zone between $20 and $20.6.
I believe altcoins will offer another chance to catch up while prices are still far below their future valuations.
-S Wishes you the best in luck.
AVAX - For new long Price MUST stay above $27AVAX - For new long Price MUST stay above $27
AVAX price is dropping as BTC price - but it's only one coin that btoke long range
was that break up real?? or simply a fake
watch an update to learn all my thoughs

$AVAX update. Plan A failed. Plan B in actionCRYPTOCAP:AVAX update. Expecting little bounce and rejection on 4H FVG and entry on lower premium fib pullback zone.
If everything goes like planned there will be bullish divergence formed adding confluence. Lets see how it plays out and do I get the first trade entry since started to track the journey.
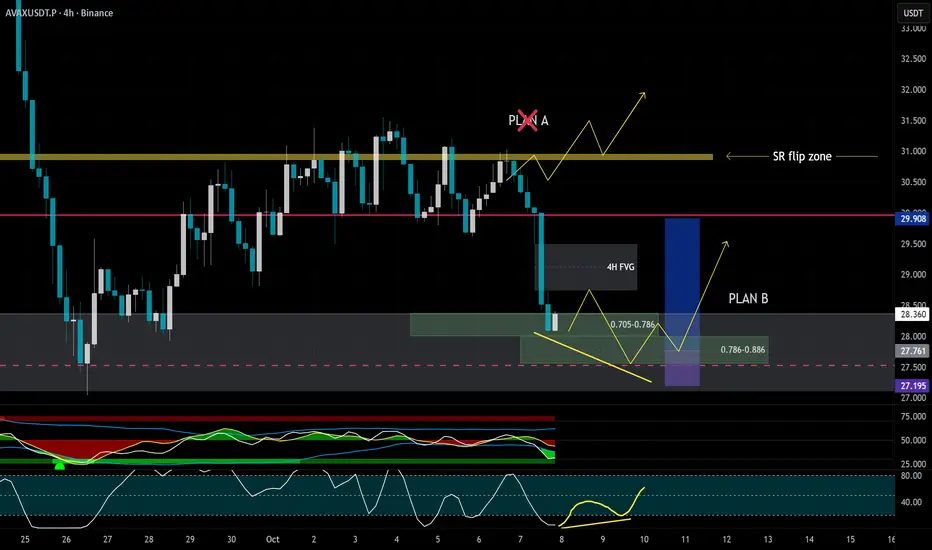
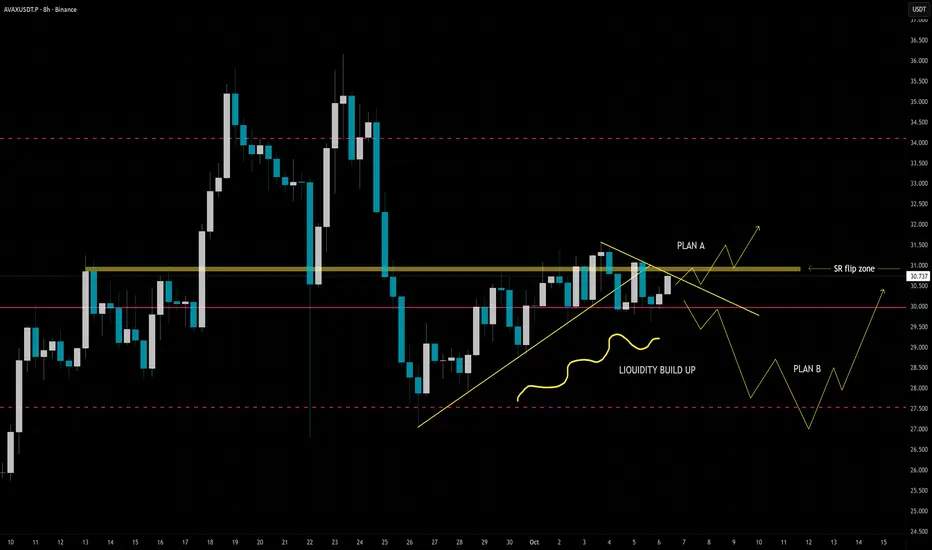
AVAX 8HCRYPTOCAP:AVAX 8H. Plan A please, thank you, por favor.
We broke below trendline, made fakeout upwards and back down again. In case we don't reclaim support of yellow SR flip zone and break down pink POC level there is a higher chance for Plan B to get in action some level.
Plan B. Pink dotted line = VAL = Value Area Low areas is the extreme around 10% drop. I don't expect price to go that low but check out that big wick on the left. There is possibility to make similar kind of wick under POC level.
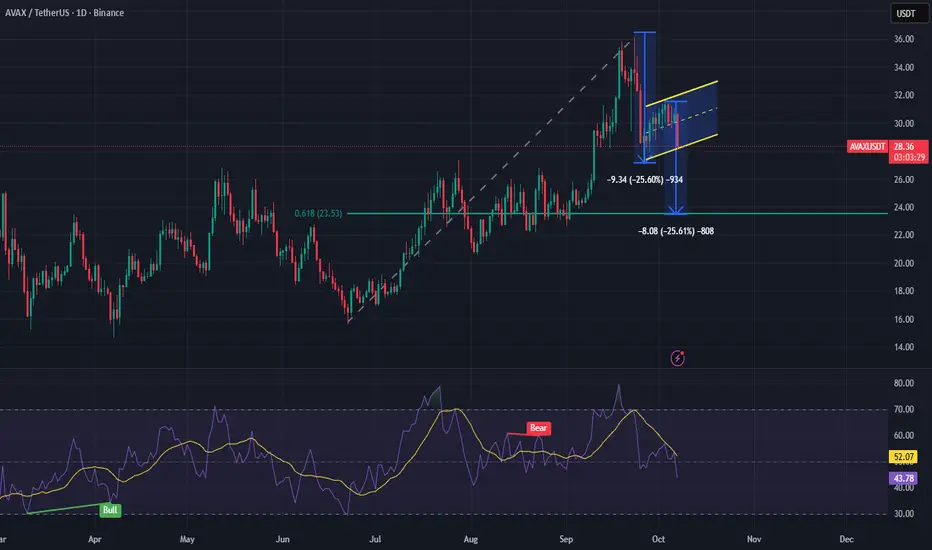
AVAX - Bear Flag/ABCD PatternFollowing the formation of a double top on 23 Sep 2025, AVAX has entered a downward trend, currently exhibiting characteristics of a bear flag consolidation. Within this structure, an ABCD harmonic pattern appears to be developing, suggesting potential continuation of bearish momentum.
Should both the bear flag and ABCD pattern play out, the projected price target lies in the range of $23.50–$23.60. This zone aligns with the 61.8% Fibonacci retracement level, derived from the swing low on 22 Jun 2025 to the swing high on 23 Sep 2025.
AVAX: My portfolio leader with massive upsideHey everyone,
The leader of my portfolio by share is Avalanche (AVAX), making up about 17%. I see huge potential in its wide range of use cases, and I’m especially excited about the prospects of AVAX ETFs, international collaborations in gaming and RWA industries, and the strength of the core team as we head into the next altcoin move.
I believe AVAX could potentially climb into the Top 10 in crypto market cap during this cycle. For the first target, I see the $50–55 range as a reasonable zone for some profit taking or portfolio rotation, though I haven’t finalized my plan yet.
My main goal is to hold at least until ATH levels, but ideally I’d like to see it reach around $250.
As always, these are just my personal thoughts and not financial advice. Please do your own research.
Cheers!
AVAXUSDTThe price has reached a strong support zone, aligning with the 0.38 and 0.5 Fibonacci levels 👌
Targets:
Target 1: $40
Target 2: $52
Follow the chart; there is a good potential for profit.

AVAX is Back: Subnets, Upgrades, and Institutional Momentum🚀🧠 AVAX: Subnets, Upgrades, and Institutional Momentum 🔧🏛️
Avalanche (AVAX ) is starting to shape up again — not just on the chart, but at the infrastructure and institutional level too.
As part of the Altcoin Series, I continue to trade these setups while preparing for a time when I’ll divorce alts emotionally and treat them for what they are — assets to be traded, not worshipped.
But right now? This one looks strong.
📊 Chart Breakdown
Left side: Macro chart (8H)
✅ We've just completed a successful third touch of structural support — you can see the 1–2–3 test boxed below the $18.64 level
📍 That’s usually where conviction builds, and reversals are born
🚀 A massive breakout confirmation comes if we close above $22.97 — the level to watch
🧱 Above that, the path opens toward higher fib levels: $27.65 → $35.13 → $43.63 and beyond
Right side: Micro structure (30-min chart)
🔍 A descending wedge or coil forming — typical of consolidation before breakout
This price action is tightening into a decision point, right around $20.80–$21
I expect a breakout soon, with a push toward the macro trigger at $22.97
🧩 What’s New with AVAX?
Avalanche 9000 Upgrade is Live
Major performance overhaul: cheaper subnets, faster deployment
Subnets now act more like sovereign L1s, enhancing utility across the board
Developer cost dropped by over 99%, inviting serious builders
DeFi, Real-World Assets & Ecosystem Growth
TVL > $5B
VanEck’s $100M Treasury Fund now tokenized on Avalanche
Over 515M transactions per month
Real-world integrations with Alipay, California DMV, and more
Enterprise Expansion
FIFA subnet launch (NFTs, tickets, collectibles)
Institutional panels at Avalanche Summit London
Avalanche’s vision: a custom chain for every institution
Retro9000 Grant Program
$40M set aside to fuel L1 growth via subnets
Analysts expect 300% subnet growth by Q4 2025
🧠 The Mindset: Trade, Not Worship
AVAX is a great example of why I'm preparing to divorce altcoins at the cycle top.
It’s gone from hype to silence... and now to real infrastructure momentum.
So yes — I’m bullish.
But I’m not here for belief — I’m here for the structure.
✅ Buy over support
✅ Breakout over $22.97
🛑 Stop-loss if structure fails
🎯 Targets: $27.65 → $35.13 → $43.63+
🏁 Final Word
Avalanche is rebuilding — on-chain, in the real world, and on the chart.
It has subnets, speed, and now institutional backing.
Let’s trade it smart.
Let’s trade it without emotions, do your risk management and don't listen to me.
One Love,
The FXPROFESSOR 💙
Disclosure: I am happy to be part of the Trade Nation's Influencer program and receive a monthly fee for using their TradingView charts in my analysis. Awesome broker, where the trader really comes first! 🌟🤝📈

Avalanche AVAX price analysis🔴 Do you think that the price of CRYPTOCAP:AVAX has bottomed out and is completing a "double bottom" pattern?
📉 Will there be another downward movement in the price of OKX:AVAXUSDT , for example to $14, followed by the long-awaited upward trend?
Either way, in both cases, there is every chance that the price of the #Avalanche token could reach $45 by the end of 2025.
P.S:
The price of #AvaxUSD is moving nicely along the established channels — take advantage of this and make a profit!
_____________________
Did you like our analysis? Leave a comment, like, and follow to get more

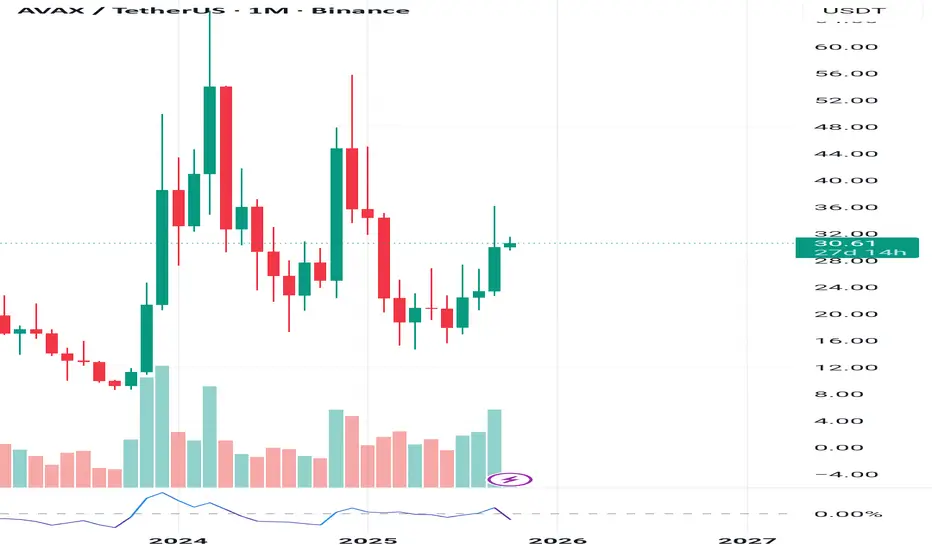
Avax Seasonal TrendsIf we look back to previous sessions in Q4 we see a repeating pattern of bullish market conditions. I would expect the same this year of 2025 and remember never be surprised how quick the market changes.
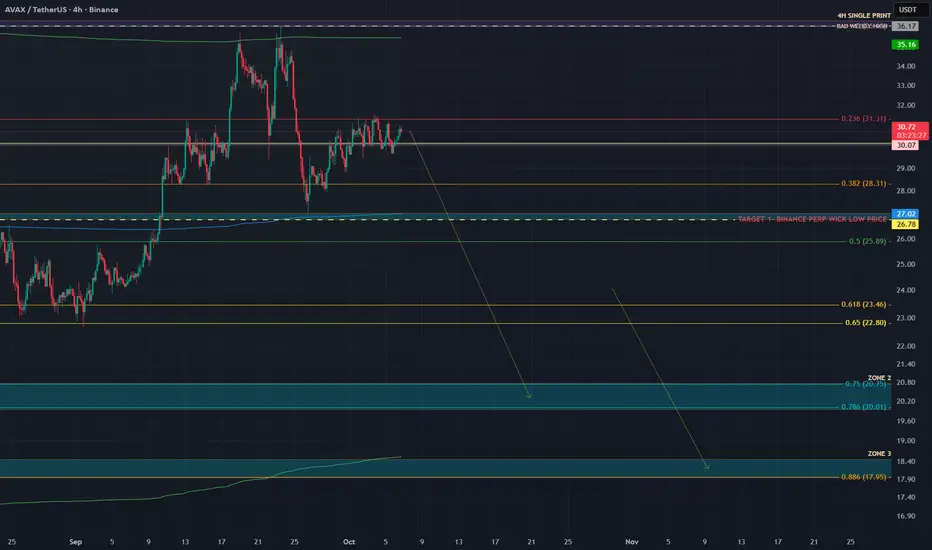
AVAX | ANOTHER DUMP IS LOADING | CHOO CHOOOOCRYPTOCAP:AVAX looks ready for another potential dump. In my CRYPTOCAP:AVAX analysis of August 26 we nailed the entry and exit pixel perfect.
The CRYPTOCAP:AVAX analysis of September 11 was also on point.
I believe that we're not setting up for another hard leg down. Lets look at the data to validate our thesis.
We’re currently in a textbook compression before expansion phase. Price has been moving sideways for days.
CVD Spot is trending down while price holds flat.
CVD Stablecoin-Margined Contracts is also trending down.
CVD Coin-Margined Contracts is trending down even more aggressively.
This tells us that while price is stable, market participants are hitting the bid — selling through the order book. The only reason price hasn’t dropped yet is because passive buyers (limit bids) are absorbing that selling pressure. Once that liquidity weakens or gets pulled, price can easily air pocket lower.
Now, here’s where it gets interesting.
Open Interest (Stablecoin-Margined) is flat.
Open Interest (Coin-Margined) is rising steadily.
At the same time, Coin-Margined CVD continues to drop, and price remains flat inside the range.
Conceptually, this combination is very bearish. Rising OI means new positions are being opened. Falling CVD means those positions are being opened via market sells — in other words, traders are adding shorts. The steady rise in coin-margined OI tells us these are leveraged positions taken directly against the asset, not just speculative stablecoin longs.
This pattern shows that new short exposure is building quietly under the surface, while spot and stablecoin flows fail to show any real buying. It’s the kind of distribution that looks like “accumulation” on the chart — but it’s actually leveraged sellers being absorbed by patient buyers. When those buyers step away, the imbalance resolves sharply to the downside.
In plain English:
Price is holding up because someone keeps catching the falling knife. But the knife is still falling.
Unless Spot CVD turns positive and stablecoin OI starts rising with it (showing real demand returning), this setup points to one thing — another leg down is coming for AVAX.
I'm targeting ZONE 2 and ZONE 3. Check the Order Flow Data here: ibb.co
Trade safe, Nomads!
AVAXUSDTAVAXUSDT have a uptrend and is now this trend because we have higher high and higher low.
Next Target is 45$ and best levels for buy: 31$ - 27$
⚠️Please control risk management.

Avalanche (AVAX): New Week New Gameplan | Looking For BreakoutLast time buyers failed to break through the current resistance zone, so now we adjust the game plan for AVAX. Price is currently holding above EMAs, but before confirming continuation, we want to see the reclaim of the middle line of the Bollinger Bands, followed by a clean break of the local high.
Only after that, we’ll look for a confirmational BOS on smaller timeframes — that’s when continuation toward the next target becomes more likely.
Swallow Academy

Will Avalanche buyers step in now for an 18% move? toward 33.5Hello✌️
Let’s analyze Avalanche’s price action both technically and fundamentally 📈.
🔍Fundamental analysis:
Big funds just asked for an AVAX spot ETF. If approved, it could bring new money in, like what happened with Bitcoin’s ETF.
But if regulators delay, AVAX price might just stay flat for longer.
📊Technical analysis:
BINANCE:AVAXUSDT is currently trading near a significant daily support level in confluence with a well-established trendline; if this zone holds, the setup suggests a possible upside move of around 18% toward the 33.5 level. 📊🚀
📈Using My Analysis to Open Your Position:
You can use my fundamental and technical insights along with the chart. The red and green arrows on the left help you set entry, take-profit, and stop-loss levels, serving as clear signals for your trades.⚡️ Also, please review the TradingView disclaimer carefully.🛡
✨We put love into every post!
Your support inspires us 💛 Drop a comment we’d love to hear from you! Thanks, Mad Whale

AVAX | Up 56% — Watching Pullback for Long Setup Near $26AVAX has rallied over 56% since our previous idea and is now trading into major resistance. This zone may trigger a short-term rejection, presenting a solid swing trade setup on a pullback.
We’re watching for a retrace toward the $26 support zone, where limit orders are planned. If price reacts positively, this offers a favorable risk/reward entry into the next bullish leg.
📉 Trade Plan:
• Entry Zone: $26.00
• Targets: $29.00–$33.00, $38.00–$42.00
• Stop Loss: Below $23.00
#AVAX #Avalanche #CryptoTrading #Altcoins #SwingTrade #TechnicalAnalysis #CryptoSetup #AVAXUSDT #CryptoStrategy #CryptoCharts #Resistance #SupportZone #PriceAction #RiskReward
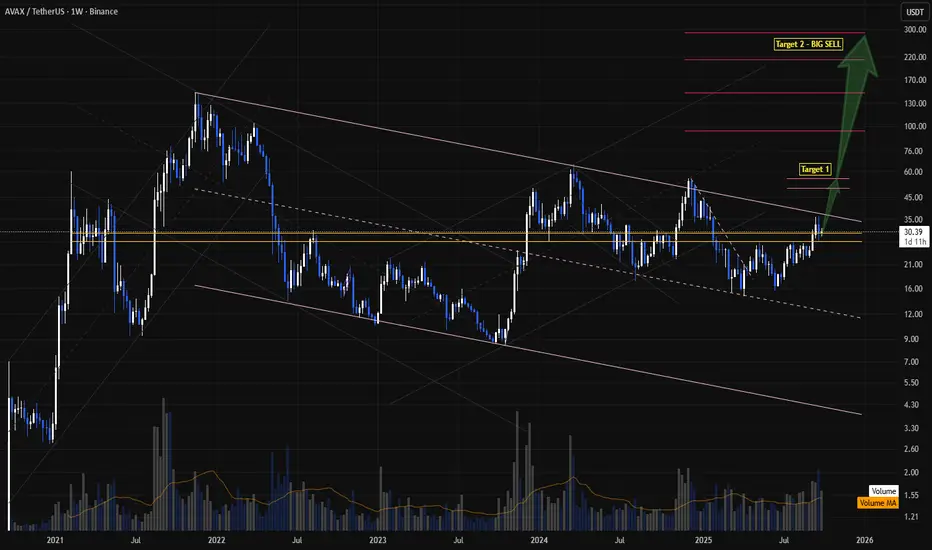
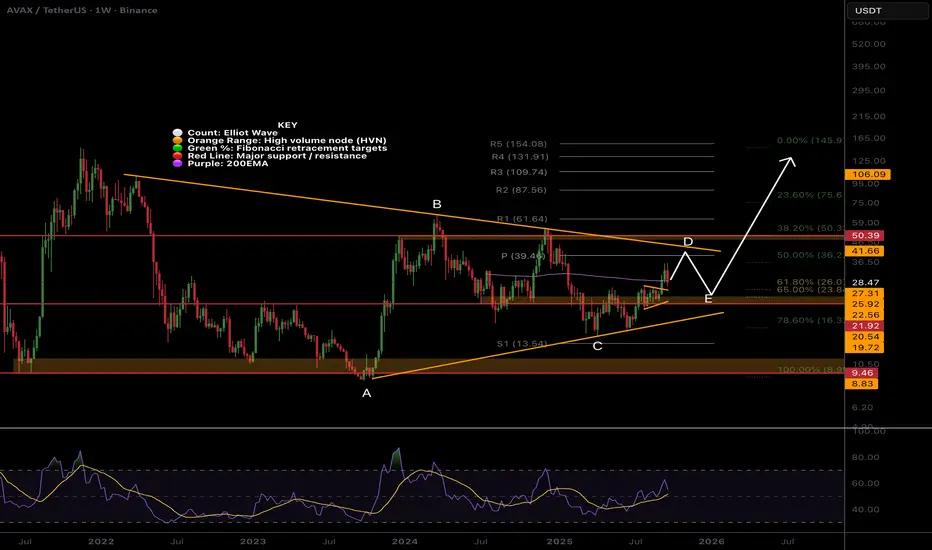
AVAX Macro Triangle?CRYPTOCAP:AVAX is printing a macro triangle similar to CRYPTOCAP:XRP did before it moved x10 in late 2024. The series of ABCs and Fibonacci depths gives this away.
Wave D could be complete but has not reached the resistance line and weekly pivot so I may have one more push up to go.
Wave E is expected to end at the weekly 200EMA to the High Volume Node as it doesn't test the support diagonal line by its characteristics.
This would also have triangle correction complete at the golden pocket adding confluence to the area.
Triangle pattern target is high and we could see a move to the R5 weekly pivot at $150 to test the all time high one more time.
Weekly RSI has bullish divergence from wave C.
Safe trading
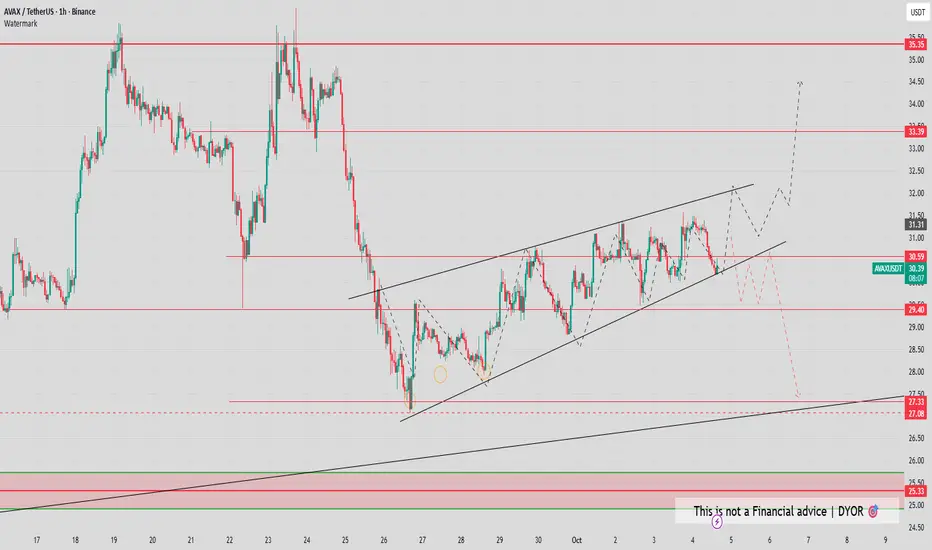
AVAX/USDT: Rebound from Trendline Support Signals Bullish ContinAVAX/USDT has rebounded from the upward trendline, reclaiming bullish momentum after rejecting support near 33.20. The price structure reflects an initial impulse leg, followed by a corrective pullback and a false break, before bulls regained control.
As long as price holds above the 33.00 support level, the market is likely to continue its push toward the 37.00 resistance zone and potentially beyond. The upward trendline continues to act as dynamic support, keeping the bullish outlook intact with momentum favoring further gains.

AVAX Swing Long Idea – TTKZD ModelAVAX Swing Long Idea – TTKZD Model
📊 Market Sentiment
FED has resumed its rate-cutting cycle, starting with a 0.25% cut in September, with two more expected. Institutional liquidity inflows have accelerated as the U.S. officially adopts crypto as part of its reserves. Despite elevated inflation, a weakening labor market is forcing the FED to ease, pushing more capital into risk-on assets.
📈 Technical Analysis
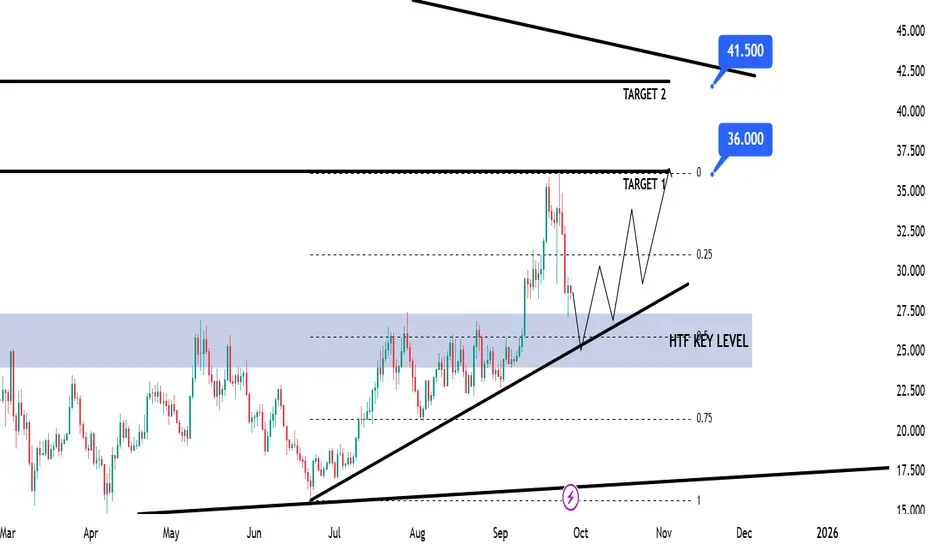
Price remains in a HTF bullish trend, signaling continuation potential.
Price broke the HTF Key Zone and closed aggressively above → strong buyer defense.
Supported by the HTF Bullish Trendline → potential retest & rejection.
Approaching the Fibonacci 0.5 equilibrium (discount) → ideal for long positioning.
📘 Model to be used – TTKZD (Trendline + Key Zone + Discount)
In this model, we look for 3 confluences:
1-Clear HTF bullish trendline supporting structure
2-HTF Key Zone defense after aggressive break
3-Fibonacci 0.5 discount zone as entry alignment
📌 Game Plan
Price to test bullish trendline
Retest of HTF Key Zone
Confluence at 0.5 discount → long entry
🎯 Setup Trigger
12H Break of Structure → confirmation for entry.
📋 Trade Management
Stoploss: Below 12H swing low that creates BOS
Targets:
TP1 → $36
TP2 → $41.5
Move stop to breakeven after TP1.
💬 Like, follow, and comment if this breakdown supports your trading! More setups and insights coming soon — stay connected!
⚠️ Disclaimer: This content is for educational purposes only and does not constitute financial advice. Always DYOR before trading.
AVAX - LONG after range!!AVAX - LONG after range!!
Trned is still up
OI rising
but we need clear range to use it a support zone

AVAX Bear Flag on 4 hourThe bounce to ~$30 did not take out the last 4H lower-high (~$30.6–$31). Until that breaks and holds, structure is still down.
This preiction is valid unless price closes above the flag’s upper trendline / last LH (~$30.6–$31). A breakdown from the flag puts the usual magnets back in play:
$28.40 (0.382) → lose it on a 4H close and the path opens to
$27.9 / $27.3
$26.0–$26.6 (0.5 + prior pivot)
If that fails: $23.6 (0.618).
Extreme measured-move risk from the full pole points toward $20–$21 (low-probability unless BTC/ETH crack).

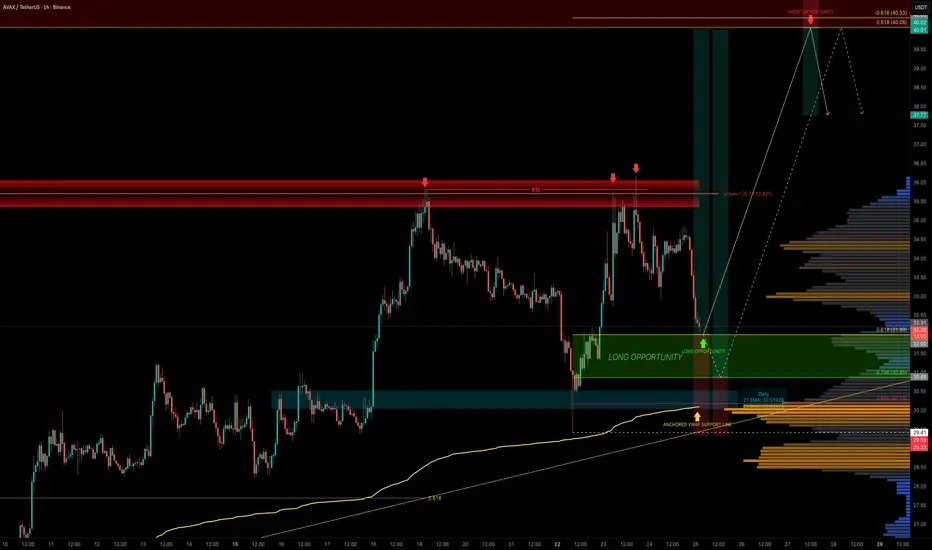
AVAX — Next Stop $40?AVAX has been one of the stronger high-cap performers recently, but the yearly open at $36 has proven to be a tough ceiling. Price has rejected this level three times already, each time offering short opportunities. This level also aligns with the 15B market cap, making it a key resistance zone.
Now, AVAX is retracing into a prime area for long setups, retracing part of the recent 5-wave impulse.
🟢 Long Entry Zone
0.618 Fib retracement: $32 → first bounce zone
0.786 Fib retracement: $30.85 → deeper entry opportunity
0.886 Fib retracement: $30 → highest confluence long entry
Invalidation: Below $29.41 (origin of the impulse)
Confluence at $30
The $30 level is the strongest support cluster, backed by multiple technical factors:
POC of this trading range
0.886 Fib retracement of the impulse
21 EMA/SMA (daily timeframe)
Anchored VWAP support
$30 psychological round number
0.618 Fib speed fan support
This makes laddering entries from $32 down to $30 the most optimal approach.
Targets
First Target: $36 yearly open → retest of major resistance (fourth attempt)
Main Target: $40 resistance cluster → 0.618 Fib retracement, negative -0.618 Fib extension
R:R: 1:3 up to 1:6 depending on entry
Educational Insight
When analysing trades, confluence is king. A single indicator may provide a signal, but when multiple tools align at the same level the probability of that zone holding increases significantly.
The $30 zone for AVAX is a great example of confluence stacking. This doesn’t guarantee success, but it gives traders a defined edge with a clear invalidation point. The same logic applies to resistance: at $40, multiple technical layers align, making it a high-probability take-profit zone.
Quick Take
AVAX is pulling back into a stacked support zone. With solid confluence at $30–$32, this zone sets up the fourth attempt at breaking the $36 yearly open resistance.
And as the saying goes in trading: the 4th touch often breaks. If it does, AVAX could quickly rally toward the $40 resistance cluster, where multiple confluences align.
Indicators used
DriftLine — Pivot Open Zones → For identifying key yearly/monthly/weekly/daily opens that act as major S/R reference points
Multi Timeframe 8x MA Support Resistance Zones → to identify support and resistance zones such as the Daily 21 EMA/SMA.
LuxAlgo — Liquidity Sentiment Profile (Auto-Anchored)
➡️ Available for free. You can find it on my profile under “Scripts” and apply it directly to your charts for extra confluence when planning your trades.
_________________________________
💬 If you found this helpful, drop a like and comment!