BAND cleared MA 20/50/100/200/500!!!Basically BAND just cleared a very strong resistance spot - the 500 MA on the daily candle.
Last time we saw this in ALGO, in one month the profit was 100%+. I will link the chart to get an idea.
We have cleared not only the Moving average line on 500, but also 200, 100, 50, and so on. (Dark purple 500 , Purple 200 , Red 100, Orange 50, Yellow 20 line)
This is due for a massive mush up in one month.
Eyes peeled.
First TP and stop loss level indicated at 11.7
This is where we wait and watch for a contest down back to 10, and then pick more up, and then continue till it reaches its ATH again.
Trade ideas

Bandusdt buyHello Traders!
This is bandusdt buy trade.
In this trade, we can see the chain of bullish candles. It means the market will pump more and according to Fibonacci strategy it will touch 9.95.
The target is 6+ of the investment and stoploss is 2.4% of the investment.
Suggested leverage is 10x.

Band I’m watching band here we have been finding pretty strong support down at the $8.20 range we have some pretty strong resistance up at the $11 range so we’re pretty much bouncing between there. We have a small rising wedge/channel right now where we continuously get rejected we could be trying to flip nine dollars into new support but if we lose that I could see us back at the 820 level. I probably in a little bit early so this could take a couple weeks from here but it’s something to watch the target is $20

Happy Hallow's Here We Go!Who's ready for a holiday pump?
I'm seeing either a double top back up to the lower $20's & then CRASH—
Ooooooorrrrrrrrrr, we could pop all the way to $40 or if we skip ahead to the year 2023.75, we'll hit at least $400.

BANDUSDT showing upwardsPrice is back in upper direction.
Have a closer look to support zone right now.
In my opinion price will rise up to 9 / 9.2
There we have to look for price action again and stay long or take profit and go short.
$BAND idea#BAND has been broken out from a falling wedge recently and is now ready to move higher.
We have also a nice cup and handle formation in larger picture.
Target can be as drawn on the chart.
NFA
Good luck!

BANDUSDT 1dbandusdt was located in a descending channel, which can grow well after breaking it and breaking the line.

$BAND | $USDT | #BAND Long Let see if we get a pullback here
Pending orders from E2(9.2014) Down to E1(8.6935)
Full exit @ 9.7095

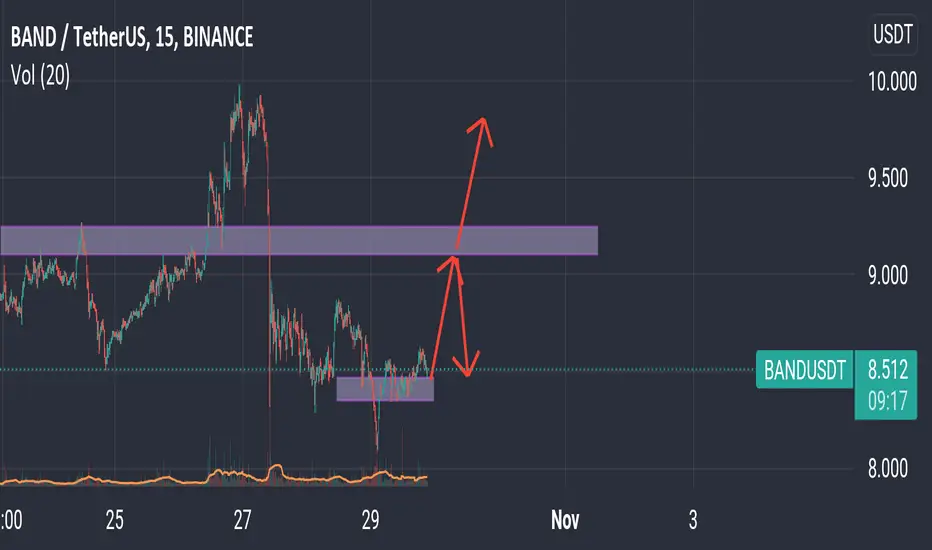
BAND breakupKey level at 9,17
5th try to breakup with lower and lower pullbacks
Re-low
ATR 31%
Accumulation in green rectacle
BTC broke local trendline - IMO bullish
BTC.D - also bearish
AT TP under 10usdt - I will sell 80% of position - 20% to the moon :)

BAND_USDTBAND is forming cup & handle , buy if break the resistance zone and retest it , technical analysis is the past repeat. patience is the key.

BAND wiil have good trendBAND will go up and arrive a TP on a my chart , so keep eyes on the BAND !!
have a good time guys :)

$bandBand ready for fly
The next trend in the crypto are oracle and defi
Not Findacial Advice
Be success 😊

band . new big bangband is trying to break the resistance . with weekly chart where macd is good for us . it didnt cross down ( death cross) and rsi is going up from average point . looking to break 50 ema with support of 10 and 20 ema .
no need to put stoploss . it will rebounce back just like before . this is for long term so no leverage

LongHi guys, we have a cup and handle pattern right now and we are also breaking the downtrend so I think it is a good investment. Good luck.
#BAND
#BANDUSDT
Spot( Midterm)🌟
Enter :8.86$,8.98$
Target : 9.40$
Target : 10.15$
Target : 12$
Target : 15$
Stop loss :No Need

BAND/USDT-4H-BINANCEThis is not a financial advice. Always do your own research and always put stoploss in your trade (SL) :) If you want more detailed info
how to study and read charts or just need help with some coin, just write to me here a comment, i will try to answer to everybody...
i can help you :) all for free, don't worry, BE HAPPY!

BANDUSDT Technical Analysis⏳ Spot
💎 BANDUSDT has been moving up supported by the ascending channel. It has formed a symmetrical triangle, after the breakout it is expected to go for a retest and then continue to move higher.
🌐 Tradingview
🏁 Short & Medium Term
💵 Invest Only 5% of your Portfolio
🎳 Entry at Market or at 8.960 - 9.022
☕️ TP1 9.238
🍺 TP2 9.500
🍻 TP3 10.000
🍾 TP4 11.000
🍷 TP5
🍸 TP6
🍹 TP7
🎁 TP8
🚫 SL at your own risk
Good Luck 🎲
Check the Links in Description and If you LIKE this analysis, Please support our page and Ideas by hitting the LIKE 👍 button. ❤️ Your Support is really appreciated! ❤️
Traders, if you have your own opinion about it, please write your own in the comment box. We will be glad for this.
Feel free to request any pair/instrument analysis or ask any questions in the comment section below.
We will have more FREE forecasts in TradingView soon
Have a profitable day 😊👍🏻

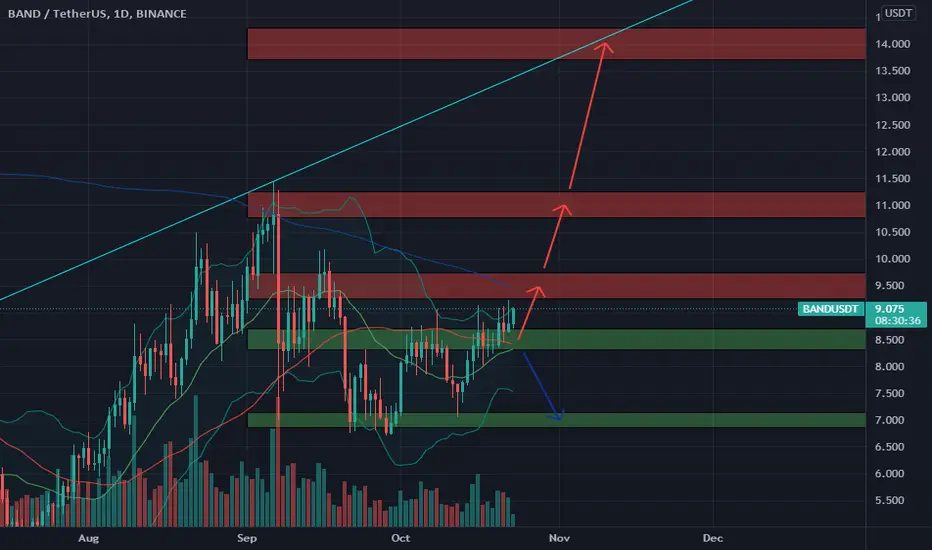
🆓Band Protocol (BAND) Oct-23 #BAND $BANDBAND has conquered the $8.5 zone and is moving towards the $9.5, $11 and $14 zone in the near term. If it loses the $8.5 zone, it will be very dangerous because it will fall sharply to the $7 zone
📈RED PLAN
♻️Condition : If 1-Day closes ABOVE 8.5$ zone
🔴Buy : 8.5
🔴Sell : 9.5 - 11 - 14
📉BLUE PLAN
♻️Condition : If 1-Day closes BELOW 8.5$ zone
🔵Sell : 8.5
🔵Buy : 7
❓Details
🚫Stoploss for Long : 10%
🚫Stoploss for Short : 5%
📈Red Arrow : Main Direction as RED PLAN
📉Blue Arrow : Back-Up Direction as BLUE PLAN
🟩Green zone : Support zone as BUY section
🟥Red zone : Resistance zone as SELL section
BANDUSDTHello Crypto Lovers,
Mars Signals team wishes you high profits.
We are in a daily time frame.
As you see, the price was able to break the resistance line and fluctuate above it. If it can be fixed above the line, it can touch our target.
But if it enters below the resistance line and stabilizes, the situation becomes a little tricky.
Warning: This is just a suggestion and we do not guarantee profits. We advise you analyze the chart before opening any position.

BAND / USDT QUICK TRADE IDEADear all,
here is a quick scalp idea in an overall bullish trend for this great coin.
Quick drop to ~8.530 and then bounce off.
Of course DYOR, this is a personal trade.
Share your opinion about this.
Good luck!

IT'S GUD TO GOO HIGHBand has recent make somen ew acivment and it already broke the line it going high

The opportunity in BANDThe opportunity in BAND
The entry point is 7.8-50$
First target 9.5$
second target 63$
third target 11$
Forth target 12$

BAND long updatePrice breaks LH and seems bullish. The bearish flag is broke out, waiting for the retest and long position.

Band Looking Pretty GoodWould look for an entry around 7.50 with a target around 11-12. We are looking to break above the .236 fib level right now before heading higher.
Thank you for viewing my post!
