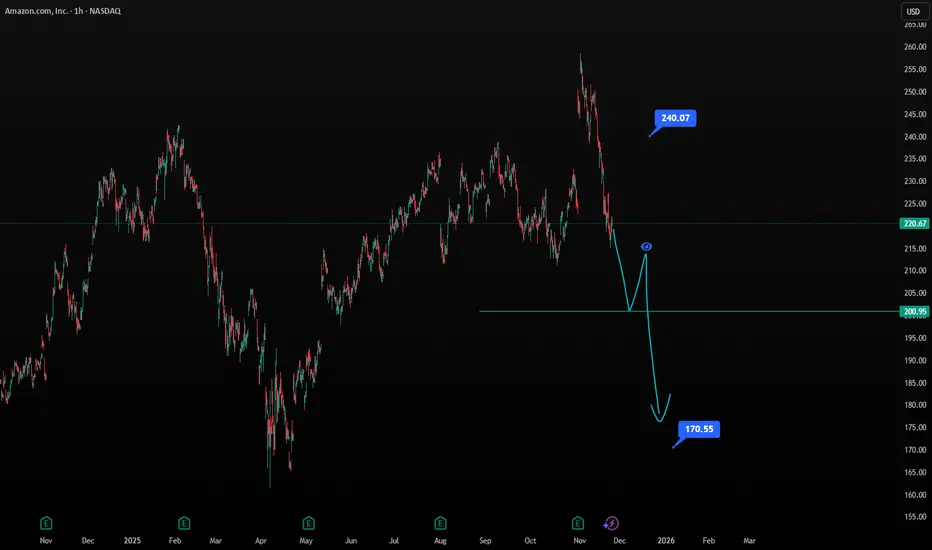
Midterm Stock Forecast for AmazonNASDAQ:AMZN At 220, Amazon sits at a pivotal midterm level. Holding $200 keeps bullish structure intact with upside potential toward $244. A breakdown below $200, however, exposes $170 as a downside target. Fundamentally, AWS growth and retail margin improvements support the bull case, but macro s
Key facts today
0.040 USD
52.62 B USD
566.64 B USD
About Amazon.com, Inc.
Sector
Industry
CEO
Andrew R. Jassy
Website
Headquarters
Seattle
Founded
1994
ISIN
ARBCOM460176
Amazon.com, Inc. is a multinational technology company, which engages in the provision of online retail shopping services. It operates through the following segments: North America, International, and Amazon Web Services (AWS). The North America segment offers retail sale of consumer products, including from sellers, advertising, and subscriptions services through North America-focused online and physical stores. The International segment focuses on retail sale of consumer products, including from sellers, advertising, and subscription services through internationally-focused online stores. The AWS segment is composed of global sales of compute, storage, database, and other services for start-ups, enterprises, government agencies, and academic institutions. The company was founded by Jeffrey P. Bezos in July 1994 and is headquartered in Seattle, WA.
Related stocks
Stock market will test yearly levels below current supportAs the yearly candle closes and the new one opens, there is an orderflow pattern that is well developed. This will play out again as always 💎

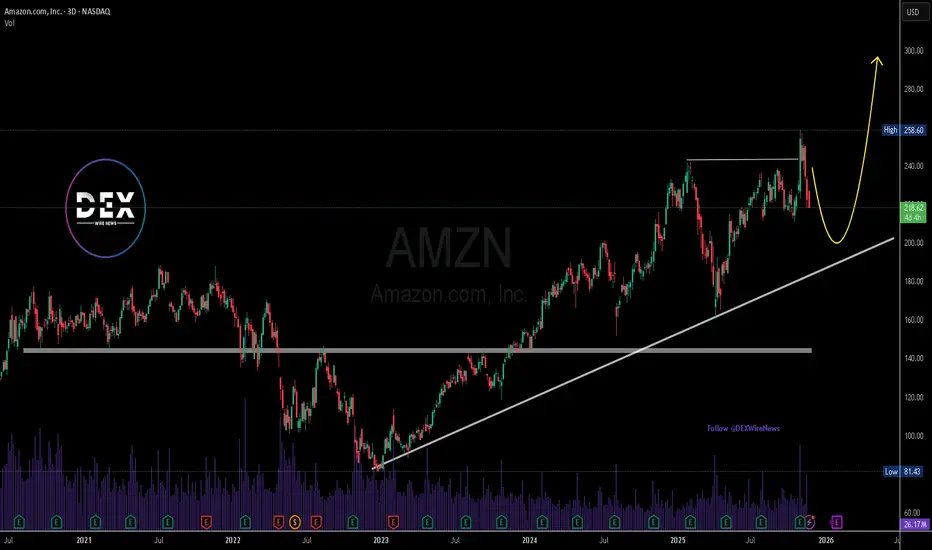
1 HR AMZN Target Area (Green Box)
To the upper right is a green rectangle labeled “TARGET”.
The dotted diagonal green line projects price from the bottom low up into this box.
This represents the bullish target if the reversal continues.
Failed Target Marker
Below the price, far down, there is a dotted y

Amazon(NASDAQ: $AMZN) Invests $3B in New Mississippi AI Data HubAmazon.com (NASDAQ: NASDAQ:AMZN ) announced plans to invest at least $3 billion in a new data-center campus located in Warren County, Mississippi. The project will support Amazon Web Services’ expanding AI and cloud-infrastructure needs, reinforcing AWS’s position as the company’s fastest-growing a
Amazon (AMZN) Shares PlungeAmazon (AMZN) Shares Plunge
As the chart shows, Amazon (AMZN) shares fell to around $222 yesterday, despite trading above $255 at the start of the month.
The price drop is the result of several factors, including:
→ A rating downgrade from Rothschild & Co. Redburn (to “Neutral”). Analysts doubt

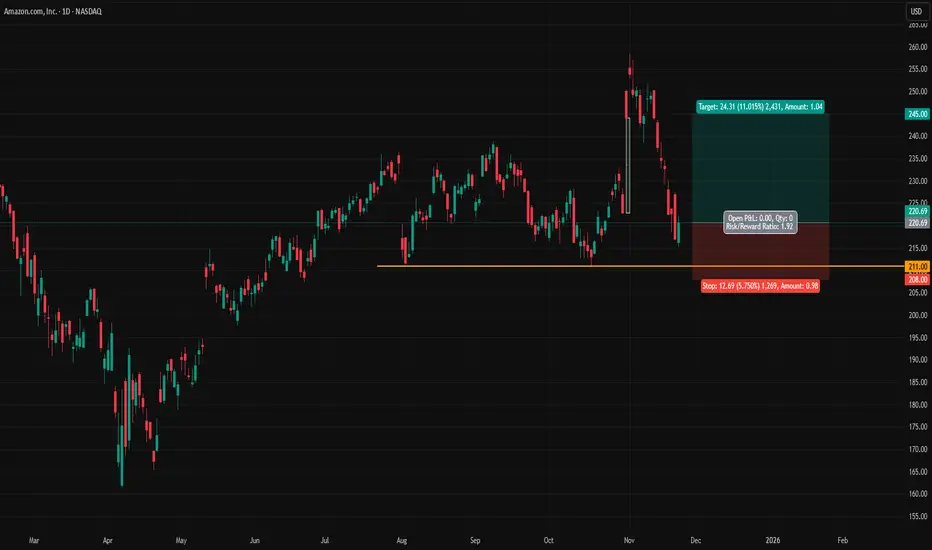
AMZN at a Critical Turning PointThe chart shows a large Cup & Handle formation, with the neckline marked by the black horizontal resistance. Recently, AMZN broke above this neckline but failed to hold, pulling back to retest the breakout zone.
Right now, price is sitting exactly on a major decision area where:
• The neckline
• T

Amazon Raises $15B for AI Expansion — Stock at Key Support ZoneAmazon has launched its first US dollar bond sale since 2022, securing $15 billion to accelerate investments in AI infrastructure. Demand was massive, reaching $80 billion, signaling strong investor confidence in Amazon’s long-term growth story. The funds will support capital expenditures, acquisiti

Possible Amazon BounceAmazon fill the earnings gap. I'm bullish on Amazon but not too strongly beacause of pressure on whole stock market. I don't know where the stock will open today but if it gave me a favarable enty, I plan to go long.
Amzn weekly chartI think we are heading into a tough correction based on my personal view.
Look at this divergence on the RSI indicator on the weekly timeframe.
I believe I’m done with this stock.
Good luck 4all🌷

Sanctions and Their Role in the Global Market1. Understanding Sanctions
Sanctions are restrictions placed by one country or a group of countries on another nation or entity to enforce international laws or influence political or economic decisions. They are often used as alternatives to military intervention, serving as diplomatic or economic

See all ideas
Summarizing what the indicators are suggesting.
Oscillators
Neutral
SellBuy
Strong sellStrong buy
Strong sellSellNeutralBuyStrong buy
Oscillators
Neutral
SellBuy
Strong sellStrong buy
Strong sellSellNeutralBuyStrong buy
Summary
Neutral
SellBuy
Strong sellStrong buy
Strong sellSellNeutralBuyStrong buy
Summary
Neutral
SellBuy
Strong sellStrong buy
Strong sellSellNeutralBuyStrong buy
Summary
Neutral
SellBuy
Strong sellStrong buy
Strong sellSellNeutralBuyStrong buy
Moving Averages
Neutral
SellBuy
Strong sellStrong buy
Strong sellSellNeutralBuyStrong buy
Moving Averages
Neutral
SellBuy
Strong sellStrong buy
Strong sellSellNeutralBuyStrong buy
Displays a symbol's price movements over previous years to identify recurring trends.
AMZN5508427
Amazon.com, Inc. 4.6% 01-DEC-2025Yield to maturity
5.88%
Maturity date
Dec 1, 2025
US23135CK0
Amazon.com, Inc. 4.1% 13-APR-2062Yield to maturity
5.54%
Maturity date
Apr 13, 2062
AMZN6237342
Amazon.com, Inc. 5.55% 20-NOV-2065Yield to maturity
5.52%
Maturity date
Nov 20, 2065
US23135CC8
Amazon.com, Inc. 3.25% 12-MAY-2061Yield to maturity
5.52%
Maturity date
May 12, 2061
US23135CJ3
Amazon.com, Inc. 3.95% 13-APR-2052Yield to maturity
5.45%
Maturity date
Apr 13, 2052
US23135BT2
Amazon.com, Inc. 2.5% 03-JUN-2050Yield to maturity
5.44%
Maturity date
Jun 3, 2050
AMZN4531868
Amazon.com, Inc. 4.25% 22-AUG-2057Yield to maturity
5.41%
Maturity date
Aug 22, 2057
AMZN4996701
Amazon.com, Inc. 2.7% 03-JUN-2060Yield to maturity
5.39%
Maturity date
Jun 3, 2060
AMZN6237344
Amazon.com, Inc. 5.45% 20-NOV-2055Yield to maturity
5.38%
Maturity date
Nov 20, 2055
AMZN5182959
Amazon.com, Inc. 3.1% 12-MAY-2051Yield to maturity
5.36%
Maturity date
May 12, 2051
AMZN4531866
Amazon.com, Inc. 4.05% 22-AUG-2047Yield to maturity
5.32%
Maturity date
Aug 22, 2047
See all AMZNC bonds
Curated watchlists where AMZNC is featured.


