BRK.B- Double Top Pullback – Healthy Correction or Trend Shift?BRK.B Elliott Wave Breakdown: Double Top Pullback – Healthy Correction or Trend Shift?
BRK.B just hit a double top at 516, pulling back to 491 amid Fed jitters. Is this the end of Wave 5's rally, or just a healthy breather?
Let's dive into the chart for Dec 2025 insights:
Primary Count Overvi
Berkshire Hathaway Inc. Shs B Cert Deposito Arg Repr 0.0454545 Sh B
No trades
Key facts today
1,675 ARS
81.49 T ARS
340.11 T ARS
About Berkshire Hathaway Inc.
Sector
Industry
CEO
Warren Edward Buffett
Website
Headquarters
Omaha
Founded
1839
Identifiers
2
ISIN:ARBCOM4603L1
Berkshire Hathaway, Inc. is a holding company, which engages in the provision of property and casualty insurance and reinsurance, utilities and energy, freight rail transportation, finance, manufacturing, and retailing services. It operates through the following segments: Insurance, Burlington Northern Santa Fe, LLC (BNSF), Berkshire Hathaway Energy (BHE), Pilot Travel Centers (PTC), Manufacturing, McLane, and Service and Retailing. The Insurance segment includes the underwriting of GEICO, Berkshire Hathaway Primary Group, and Berkshire Hathaway Reinsurance Group. The BNSF segment involves the operation of railroad systems. The BHE segment focuses on regulated electric and gas utility, power generation and distribution, and real estate brokerage activities. The PTC segment consists of managing travel centers and marketing of wholesale fuel. The Manufacturing segment refers to industrial, consumer and building products, home building, and related financial services. The McLane segment covers the wholesale distribution of groceries and non-food items. The Service and Retailing segment relates to the provision of shared aircraft ownership programs, aviation pilot training, electronic components distribution, retailing businesses, automobile dealerships and trailer, and furniture leasing services. The company was founded by Oliver Chace in 1839 and is headquartered in Omaha, NE.
Related stocks

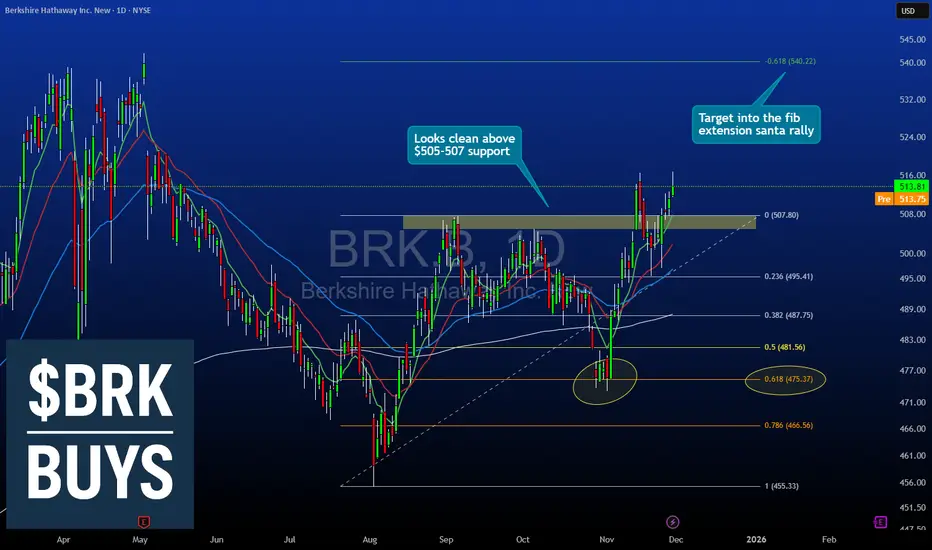
Berkshire Hathaway ~ Holiday Accumulation Zone $505-507 SupportBRK.B Pre-Christmas Accumulation Setup
Berkshire Hathaway has pulled back into a well-defined support zone at $505-507, presenting a structured entry opportunity heading into the holiday period with targets at the May 2025 highs.
🎯 Setup Overview:
Entry Zone: $505-507 (current support area)
Target:
Berkshire Hathaway Finds Support at Key Ascending TrendlineWarren Buffett’s Berkshire Hathaway has made a notable shift in its investment portfolio by initiating a $4.9 billion position in Alphabet during Q3. The firm bought 17.9 million shares, giving Berkshire a 0.31% stake in the tech giant. This move stands out because Berkshire has historically avoided

Buffett to Shareholders: “I’m Going Quiet”Buffett to Shareholders: “I’m Going Quiet”
Legendary investor Warren Buffett, the 95-year-old head of Berkshire Hathaway, has marked the end of an era by publishing what he called his “final letter” to shareholders on 10 November. The “Oracle of Omaha” announced that he is “going quiet”, bringing

Berkshire Hathaway is breaking out of channelBerkshire Hathaway NYSE:BRK.B is breaking out of its long descending channel on the daily timeframe.
After months of consolidation, price has finally pushed through the upper boundary near $495, signaling the start of potential upward momentum.
If this breakout holds, the next major target could

Strategically Investing in Berkshire HathawayI'm going to write about what makes Berkshire a good company, and why I am buying it. Since it is such a huge company I might not be able to define every single detail but I will do my best to cover the most important aspects of the company for you. I hope you enjoy my idea, I am using my time to wr
BRK.A (Berkshire Hathaway) Breakout Alert: Bullish Setup Ready 🚀 BRK.A (Berkshire Hathaway) Breakout Alert: Bullish Setup Ready to Soar! 🚀
Traders, get ready for action! 🔥 The NYSE:BRK.A (Berkshire Hathaway Inc) chart is screaming opportunity on the 1-hour timeframe, with price coiling up against a descending trendline, poised for a powerful breakout. This s

Mean Reversion Setup: BRK.B1. RSI in oversold region
2. Price likely to rebound back the the mean
Trade Rules:
Entry Trigger - RSI has cross below oversold region, enter limit buy at close price
Exit Trigger - Close at market when close price cross above exit trigger (Red Line)

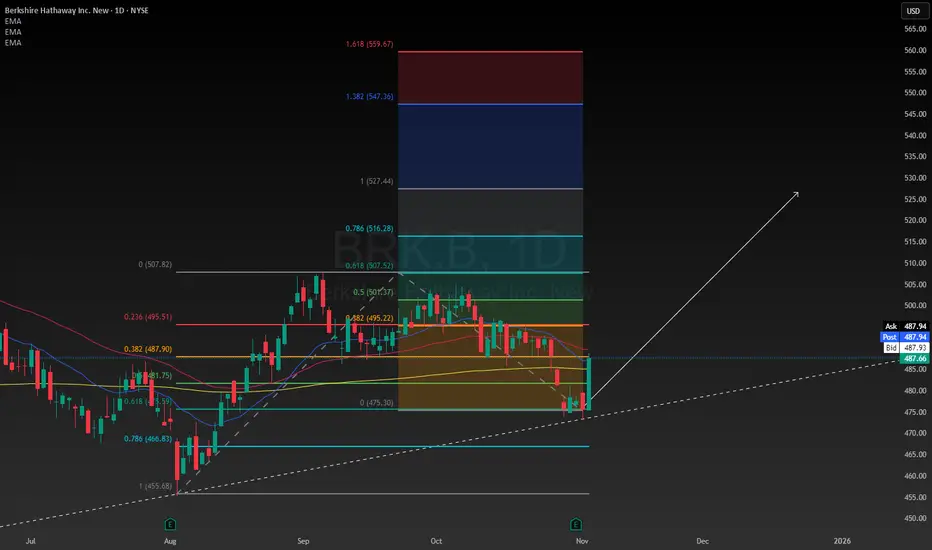
Buying the Dip or Catching a Falling Knife?Berkshire Hathaway has just broken its long-term rising channel after several years of steady growth. The recent pullback looks scary at first glance, but for long-term investors, this kind of correction could be exactly the kind of discount opportunity that rarely comes around.
Right now, NYSE:

Berkshire’s Lower HighsBerkshire Hathaway has lagged as the broader market hits new highs. Is the financial giant stalling?
The first pattern on today’s chart is the series of lower highs since early May. Those may suggest its long-term uptrend is fading.
Second is the pair of large solid candles on October 10 and Octob

See all ideas
Summarizing what the indicators are suggesting.
Oscillators
Neutral
SellBuy
Strong sellStrong buy
Strong sellSellNeutralBuyStrong buy
Oscillators
Neutral
SellBuy
Strong sellStrong buy
Strong sellSellNeutralBuyStrong buy
Summary
Neutral
SellBuy
Strong sellStrong buy
Strong sellSellNeutralBuyStrong buy
Summary
Neutral
SellBuy
Strong sellStrong buy
Strong sellSellNeutralBuyStrong buy
Summary
Neutral
SellBuy
Strong sellStrong buy
Strong sellSellNeutralBuyStrong buy
Moving Averages
Neutral
SellBuy
Strong sellStrong buy
Strong sellSellNeutralBuyStrong buy
Moving Averages
Neutral
SellBuy
Strong sellStrong buy
Strong sellSellNeutralBuyStrong buy
Displays a symbol's price movements over previous years to identify recurring trends.
B
BRK3668499
Burlington Northern Santa Fe Corp. 7.0% 15-DEC-2025Yield to maturity
6.68%
Maturity date
Dec 15, 2025
N
ENRN5056545
Northern Natural Gas Co. 4.1% 15-SEP-2042Yield to maturity
6.62%
Maturity date
Sep 15, 2042
E
D4145683
Eastern Energy Gas Holdings, LLC 4.8% 01-NOV-2043Yield to maturity
6.12%
Maturity date
Nov 1, 2043
N
ENRN5163032
Northern Natural Gas Co. 3.4% 16-OCT-2051Yield to maturity
6.12%
Maturity date
Oct 16, 2051
See all BRKB bonds


