STRATEGY Mirror crash with 2022 to $60 has started.Michael Saylor won't like this. But the chart is what it is and that's an objective dynamic.
** The 5-year Channel Up and Bear Cycle **
Strategy (MSTR) has been trading within almost a 5-year Channel Up since the February 2021 Top of its previous Cycle. Within this lines, it has had its latest top (Higher High) on the week of November 18 2024 and since then it has been on a structured strong decline.
This decline has gotten even stronger once the price broke below its 1W MA50 (blue trend-line). So far, the 2025 correction is mirroring the 2021 one, which was the start of a 2-year (2021/21) Bear Cycle.
** The three Stages **
Based on that, we have valid reasons to expect that 2026 will also mirror the past Bear Cycle. What stands out on this analysis is that we have classified the whole Bear Cycle into three Stages. Based on that, we have now already entered Stage 2 as the price has broken below its 1W MA50 (and should stay as the Resistance for the remainder of the Cycle) and almost touched its 1W MA200 (orange trend-line). When that happened in January 2022, the market rebounded towards the 1W MA50 where it was rejected and when it broke below the 1W MA200 as well, Stage 3 started. This Stage made the Bear Cycle bottom on the 1M MA250 (red trend-line) after a -90% decline in total. It was completed when the price broke above the 1W MA50 again, essentially confirming the start of the new Bull Cycle.
** Where is the bottom now? **
As a result, we may now see a short-term rebound, limited by the 1W MA50, which after it gets rejected and breaks below the 1W MA200, Stage 3 may start. If this Bear Cycle also crashes by -90%, we should then be expecting a bottom at $60 (at least), supported by the 1M MA250 again.
Notice also the striking symmetry among the 1W RSI patterns of the two Cycle fractals. The 1W RSI has currently hit the 30.00 oversold barrier (similar to Jan 2022) and it was a second break and then a Higher Lows Bullish Divergence that confirmed the bottom of the Bear Cycle, essentially turning Strategy Inc. into a long-term buy opportunity again.
---
** Please LIKE 👍, FOLLOW ✅, SHARE 🙌 and COMMENT ✍ if you enjoy this idea! Also share your ideas and charts in the comments section below! This is best way to keep it relevant, support us, keep the content here free and allow the idea to reach as many people as possible. **
---
💸💸💸💸💸💸
👇 👇 👇 👇 👇 👇
Strategy Inc Shs A Cert Deposito Arg Repr 0.05 Sh A
No trades
Trade ideas

MSTR. Long?Tough call on this one. It is at all time highs and going off fibs. It rejected perfectly at my projection off the yearly move to the high from the past. Now it must hold here or the level below. Not to confident in that though. I personally wouldn't touch this stock for a long until $100 range. Not going to short this or take a long until we hit major support. If I miss out that is fine!

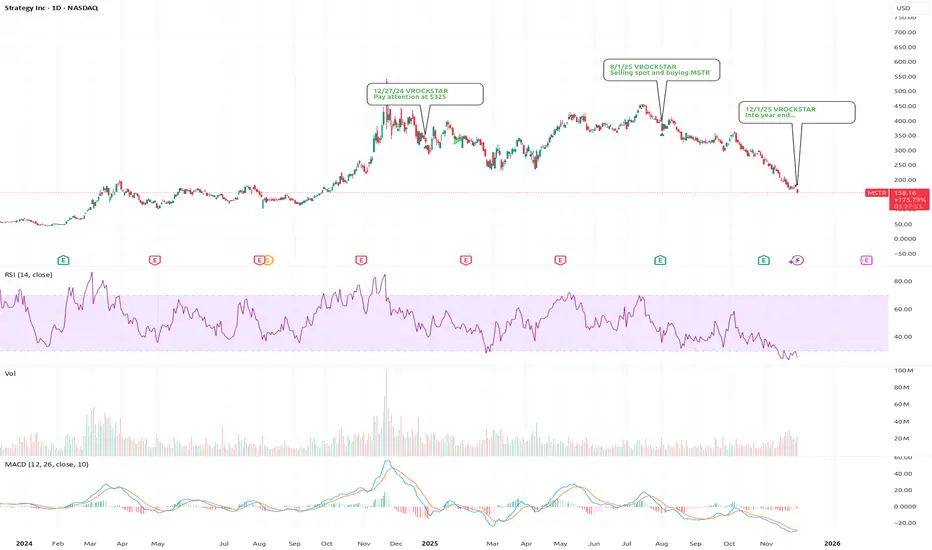
12/1/25 - $mstr - Into year end...12/1/25 :: VROCKSTAR :: NASDAQ:MSTR
Into year end...
- 1.1x mnav
- people FUD'ing over not understanding the company on the way up and abusing Kleenex on the way down while rage posting on X
- it's a leveraged bitcoin model with access to issue high-yield dollars in a wrapped token (STRC)
- so when bitcoin down, mstr down more, when bitcoin up, mstr up more
- there's not really magic going on at this point now that the mnav is squarely in the "buy zone"
- "yuh but V saylor is selling BTC to buy dollars"
- correct. because he'll want to use dollars to fund these payments... to keep this STRC flywheel running smoothly, b/c that's the fiat nuke
- so while honestly i still like eth more, and spot btc feels comfy
- fade or FUD mstr at your own peril at this pt
- you have a license to sell covered calls like a bank if u play this right... that's like 2-3% weekly yield (lmfao)
- so yuh. merry christmas. buy a calculator and chill. don't listen to the ppl who have no idea how this is done. saylor is not SBF. c'mon. SBF didn't even own or champion btc.
V
MSTR: Now I can't unsee itWas on a Livestream Friday talking about my (now closed) short and migrated to the Monthly timeframe on $NASDAQ:MSTR. I've seen this pattern many times before and now I can't unsee it.
Turns out there is nothing new under the sun... of finance. All the same patterns of human behavior repeat just with different narratives.

Where is the market going in Dezember 2025If we reach 10 likes over here, I will do another update on what we are looking for.
Up, down, sideways, everything in between.
In this video, you will know that.

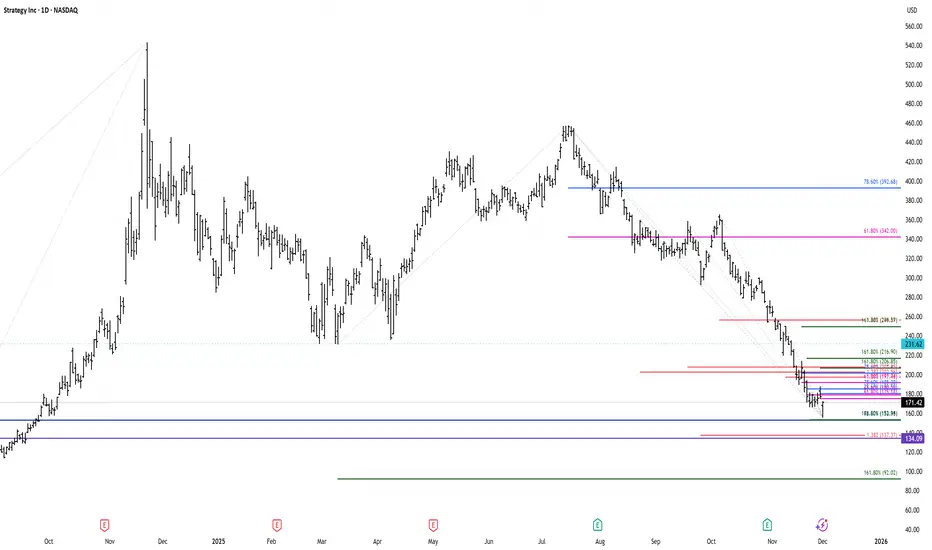
$MSTR BUY THE DIP!MicroStrategy Incorporated (NASDAQ: MSTR) is navigating a significant correction phase. The stock, currently trading around $185.88, has experienced a steep 30% decline over the past month, largely attributed to a concurrent 13% drop in the price of Bitcoin. This downturn has been more severe for MSTR than for the underlying asset, with the stock falling 65% from its all-time high set in November 2024, compared to Bitcoin's 6% retracement over the same extended period.
Amid this volatility, a contingent of market observers, primarily active on social media platforms, maintains a thesis of resilience for the Bitcoin-focused treasury firm. Their argument centers on MicroStrategy's established public market stature and its systemic importance within the cryptocurrency ecosystem. They highlight that, according to metrics from CompaniesMarketCap, MicroStrategy ranks as the 433rd largest company globally by market capitalization. This position, they argue, suggests a lower probability of a catastrophic collapse, positing that external entities or market participants would likely intervene to "bail out" the firm rather than face the widespread repercussions of its failure. This perspective draws a distinction between MicroStrategy and private crypto companies that have failed, citing its regulatory transparency and public accountability as key buffers.
From a technical analysis standpoint, the chart for MSTR indicates two critical support zones that could halt the current descent. The primary support level is identified near $120, with a secondary, stronger support zone around $100. These levels are viewed as potential accumulation areas where buying interest may resurge.
Conversely, for any sustained recovery, key Fibonacci retracement levels from the recent downtrend provide clear resistance targets for taking profits. The first and more immediate target resides at the 0.236 Fibonacci level, approximately $226.79. A stronger bullish momentum would then face significant resistance at the 0.382 Fibonacci level, around $270.83, which represents the second major take-profit zone.
In summary, while fundamental debates about the company's durability persist, the technical framework suggests a path defined by the $100-$120 support range and a recovery trajectory capped by resistance near $227 and $271. The stock's trajectory will likely remain tightly coupled to Bitcoin's price action, with these technical levels serving as crucial markers for both downside risk and potential recovery.

It's a time for MICROSTRATEGY - 40% potential profit - 250 USDThe chart shows a clear slowdown in the prolonged downtrend, with price action forming a local support zone around 176–180 USD. Recent candles indicate an attempt to stabilize, while the short-term moving averages are beginning to flatten out — a common early sign of shifting sentiment.
The RSI has also rebounded from oversold levels and is now trending upward, suggesting growing bullish momentum after an extended period of selling pressure. If buyers manage to defend the current support area, the technical structure opens the possibility for a continued upward move.
Under this scenario, a natural target could be the 250 USD region, representing an increase of roughly 40% from the current price. This level aligns with previous consolidation zones and may act as a reasonable objective should a stronger recovery unfold.
Potential TP: 250 $
⚠️ DISCLAIMER
This analysis is for informational and educational purposes only and does not constitute financial advice, investment recommendations, or a suggestion to buy or sell any asset. All trading and investment decisions involve risk and should be made based on your own research or consultation with a licensed financial professional.

Strategy Inc. (NASDAQ: $MSTR) Boosts BTC With $963M BuyStrategy Inc. (NASDAQ: MSTR), the largest publicly traded holder of Bitcoin, expanded its BTC reserves with a major purchase of 10,624 BTC valued at approximately $962.7 million between December 1–7. This marks the company’s largest weekly acquisition since mid-year, signaling renewed confidence as Bitcoin volatility stabilizes. Strategy accumulated the new BTC at an average cost of $90,615, lifting its total holdings to 660,624 BTC purchased for roughly $49.35 billion. At current market prices near $94,000, the stash is now worth about $60.5 billion, translating to an estimated $11 billion in unrealized gains.
The purchase was funded through Strategy’s at-the-market equity program. The company raised $928.1 million through the sale of 5.13 million common shares and $34.9 million through the sale of 442,536 preferred shares. With more than $39 billion in unused issuance capacity across several securities, Strategy continues to position itself as a Bitcoin-focused structured finance entity with significant capital-raising flexibility. Executive Chairman Michael Saylor also highlighted the firm’s BTC Yield metric—up 24.7% year-to-date—which measures Bitcoin growth per diluted share and reinforces Strategy’s long-term accumulation model.
Shares of MSTR saw a modest rebound, gaining roughly 2% after recently dropping near $155 on December 1 following broad weakness in crypto-linked equities. Despite short-term improvements, MSTR remains down more than 50% over the past six months as investors reassess risk across digital-asset equities.
Technical Analysis
The chart shows MSTR rebounding strongly from the $155 support zone, with price reclaiming the horizontal support area. The RSI sits in oversold territory, showing early momentum recovery. Price action suggests the potential for a corrective bounce toward the descending trendline near $300–$330. However, the broader trend remains bearish as long as price stays below the long-term downtrend line. A break above the trendline would indicate a structural reversal, while a rejection may send the stock back toward support.

MSTR LongDemand Zone had been confirmed
trendline break
Long entry 191
Stop 155
Target 300
Risk management is much more important than a good entry point.
I am not a PRO trader.
In my trading plan, the Max Risk of each short term trade should be less than 1% of an account.

Super bullish MSTR to $235Obviously, this is getting liftoff today. My dowsing work is super bullish calling for 19% up from here. That makes the target around $235.
There is a message about a "look above & fail", so a slight retracement may occur, but this is a shorter term trade from what I get.
I'll be watching next Monday as it's saying that's the exit date. I get 2 of the most bullish options when I ask about this, and they are not typically just for the day only and I could imagine a lot of people jumping on board.

$MSTR ..Houston we’ve found a support NASDAQ:MSTR , MSTR went from trading at 400 times bitcoin value to less than 1(slightly) book to value. And it Happened suspicously while hitting the volume profile point of control.

MSTR - Wave 4? - Next stop 197-202 then reload for 220-235!THESIS
The recent price action confirms a bullish Elliott Wave impulse move from the $155.61 low. The market has validated an Extended Wave 3 by successfully holding the maximum 61.8% retracement level during the deep Wave 4 pullback (low of $177.82).
We are now in the final thrust of Minor Wave 5, we should then see a 3 wave pullback which sets up the full corrective rally to our higher-degree target of $220-$235!
Analysis & Targets (Aligned to the Chart)
1. 🎯 Wave (A) Completion: The Final Minor Impulse
The current action is the final push of Minor Wave 5 (the fifth wave of the initial impulse from the $177.82 low).
• Entry Signal: The bounce from the $177.82 low confirmed the Wave 4 bottom.
• Target Zone (A): The technical projection for Wave 5 (using W5 = W1 or 0.618 \times W1-3) places the peak between $196 - $202
• Action: This is the initial profit-taking zone. Look to sell calls here, as this completes the first major structural move.
2. 🌊 Wave (B) Correction: The High-Grade Reload
Once the Wave (A) target is hit, a larger corrective pullback (Wave (2) in the larger context) is mandatory before the final surge. Since the preceding Wave 4 was sharp/deep, this Wave (B) correction is likely to be shallow/sideways (a Flat or Triangle) to adhere to the Principle of Alternation.
• Target Zone (B): We project a 38.2-50-61.8% retracement of the entire impulse. This places the reloading zone between $182 - $172 (The green box on the chart).
• Action: This is the Optimal Reloading Zone for long positions before the final rally.
3. 🚀 Wave (C) Final Target: The Greater Rally Peak
The final Wave (C) completes the overarching corrective rally. This leg is targeting a significant Fibonacci retracement of the prior, large bear wave.
• Target Zone (C): The $220 - $235 box is perfectly aligned with the high-probability 38.2% of the massive Wave 3 down that preceded this entire rally.
• Action: This is the final take-profit target for the entire trade structure.
Key Levels to Watch
• Buy Target (Sell Limit): $197 (Exit Minor W5).
• Reload Zone: $182- $172 - (Buy the Wave B dip).
• Invalidation Price: $170 (A close below this invalidates the entire impulse).
Good luck with the final wave! Remember to manage risk and set a stop loss! I am a guy on the internet and not a financial advisor!
#ElliottWave #MSTR #Bitcoin #Bullish #TechnicalAnalysis

MSTR - 3 Bar pattern followed by reaction - powerful pattern !MSTR - 3 Bar pattern followed by reaction - powerful pattern ! - based on BTC strong reaction, monitor check if it can clear the symmetry and make higher low post clearing the symmetry overhead!

MicroStrategy - The red channel of doom returns - November 2025Ah, MicroStrategy…. the stock that’s half software company, half Bitcoin cult. Every time you think it’s about to behave like a normal tech firm, Michael Saylor pops up with a grin, another billion dollars of debt, and the conviction of a man who’s never heard the words “margin call.”
And here we are, November 2025, staring at the Red Channel Crossover. Sounds ominous doesn’t it? Like something NASA would warn about before the Sun goes super nova.
Déjà Vu: February 2022 Says Hello
Look left.
The last time price action crossed into the red channel was February 2022. Market structure broke. Price dumped. Holders prayed. And then just when everyone thought it was over, sneaky sellers rotated the gravity dial to 2G.
Now we’re back at it. November 2025, same crossover, same setup, same “this time is different” nonsense. Every influencer on X is already typing “Buy the dip 🚀”, as if adding a rocket emoji somehow fixes negative momentum.
The technicals
The green channel represents calm waters, an uptrend, happy times, and Saylor buying jets with the profits. The red channel is the opposite. It’s like when the hangover kicks in and you realise that was not sugar free Red Bull. Each time MSTR entered this red zone, it meant one thing:
Broken market structure,
50–70% correction,
Mass denial phase.
Right now, the chart’s showing that same red crossover again, after breaking below structural support around the $240 area. If you’re still shouting “to the moon” at this point… well that rocket exploded months ago.
RSI & sentiment
RSI is rolling over faster than a drunk at a wedding. Momentum’s drained and what’s left are bag holders explaining to their spouses that “it’s a long-term store of value.” It’s not. It’s a tech stock with a crypto addiction.
So what happens next?
If history’s anything to go by, and it usually is, price action is heading for the same fate it suffered post February 2022:
First, a short-lived bounce to sucker in the hopeful.
Then, the slow, grinding descent into despair.
A retrace toward the $80–$100 region would fit perfectly with prior cycle behaviour. And if Bitcoin confirms its own Gaussian bear trend, well… let’s just say Michael Saylor’s going to need more than “diamond hands”, he’ll need a therapist.
Before that can happen expect price action to test the $300 area to confirm broken market structure. Today price action is considerably oversold, this idea only becomes validated after a resistance confirmation on past support . Wrote that in bold for those of you who struggle to get past the headline. I blame Tik-Tok
Conclusions
Every cycle it’s the same story:
1. MSTR breaks structure.
2. The red channel appears.
3. Everyone panics.
4. Then comes the silence.
The only variable is how many motivational tweets Saylor can post before margin calls start rolling in. This setup isn’t new, isn’t rare, and isn’t bullish, it’s just math doing its job while people pretend it’s spiritual warfare. So yes, the red channel crossover is back. Same movie. Different year. Still ends badly for the extras.
Ww
Disclaimer
==================================================================
This isn’t financial advice, obviously. If you need a stranger on the internet to tell you not to buy a company using borrowed money to gamble on Bitcoin, you deserve the portfolio you get.
If it pumps, you’ll take credit.
If it dumps, you’ll blame the FED.
Either way, I’ll be here limiting my desire to say "I told you so".

MSTR HIGH PROBABILITY LONG SETUP SOON!!!🚨 MSTR HIGH PROBABILITY BUY SETUP 🚨
* Here We Can See Clearly The Next Potential Moves For MSTR Coming Hours/Days.
* Keep Your Eyes Close On Your Trading Positions.
* Happy PIP Hunting Traders.
FXKILLA.

MSTR - Daily - interesting reaction low against support -MSTR - Daily - interesting reaction low against support - - monitoring to see if it can clear symmetry and previous low is key monitor.
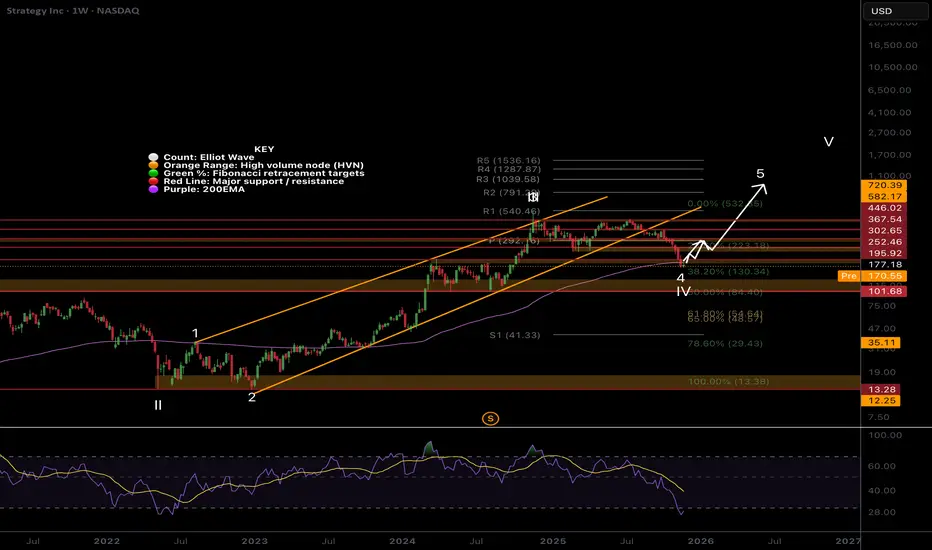
MSTR when will it end? Soon...NASDAQ:MSTR Sentiment is low, the asset is hated and misunderstood by TradFi and retail. It’s a recipe for a bottom!
Price hit the weekly 200EMA in wave 4. Not much more to add, there is room to fall to $101 High Volume Node, but a bottom should emerge soon.
🎯 Terminal target for the business cycle could see prices as high as $1000 based on pivots
📈 Weekly RSI hit oversold with bullish divergence from wave 2
👉 Analysis is invalidated if we close back below $84
Safe trading
MSTR Could Be Forced Out of MSCI — Here’s What That Means📌 Chart Overview
This chart compares MicroStrategy (MSTR) vs Bitcoin (BTC) on a YTD returns basis.
After several years of extreme outperformance, 2025 marks the first major divergence in years:
BINANCE:BTCUSDT YTD: about –4%
NASDAQ:MSTR YTD: about –41%
From highs: MSTR trades ~–63%
This is the widest decoupling in the last cycle, and it reflects a structural break in how the market prices MSTR.
1. MSTR = Leveraged Bitcoin With Higher Beta
For years, MicroStrategy acted as a leveraged Bitcoin proxy:
Higher beta than BTC
Equity issuance used to buy more BTC
mNAV premium amplified upside moves
Investors treated it like an ETF with embedded leverage
When BTC rallied, MSTR rallied even more.
That dynamic is now reversing.
2. The mNAV Premium Has Collapsed Into Discount
The second chart (mNAV Analysis) tells the real story:
Historical mNAV premium: often 1.5x–3.5x
Current levels: ~1.46x, falling toward 1.0x
In recent weeks, intraday prints have even touched discount territory (<1.0x)
This is critical:
➡️ MSTR only outperforms BTC when it trades at a premium to NAV.
When that premium evaporates, the “leveraged BTC” thesis breaks.
Today the market is pricing:
Higher risk,
Lower confidence,
Reduced ability to issue accretive equity,
And potential forced selling due to MSCI.
The entire flywheel depends on that premium — and it’s now gone.
3. The MSCI Catalyst: A Binary Structural Event
MSCI is reviewing whether companies with >50% digital asset exposure should remain in:
MSCI World
MSCI USA
MicroStrategy fits the proposed category perfectly:
➡️ Digital Asset Treasury Company
➡️ Balance sheet ~70% BTC
Decision date: January 15, 2026
If excluded:
Forced selling: ~$2.8B
Potential cascade: up to $8.8B
Equivalent to 15–20% of MSTR’s market cap
These outflows are mechanical, not discretionary.
4. Liquidity Risk: The Hidden Problem
The October 10th BTC drop exposed MSTR’s fragility:
~17% BTC drop
~90% liquidity evaporation in MSTR’s order book
Thin depth for a company of this size
Large block orders cause outlier moves
If MSCI-related outflows hit in a volatile period,
MSTR may not have enough liquidity to absorb multi-billion flows.
This is not a solvency problem — it’s a market microstructure problem.
5. The Paradox: While Risks Rise, MSTR Keeps Buying
Recent actions:
Purchased 8,178 BTC (~$830M)
Issued five BTC-backed structures this year
Continues using financing to expand BTC exposure
Saylor reiterates resilience even under 75–90% BTC drawdowns
If MSCI does not exclude MSTR, the stock could stage a violent rerating
because the market has already priced in significant downside risk.
6. Key Takeaways
MSTR has decoupled sharply from BTC in 2025
The mNAV premium has collapsed, removing its leveraged upside
MSTR now trades near or below NAV, losing its structural advantage
MSCI’s January decision is the defining catalyst
If excluded → forced selling
If retained → high-beta rebound potential
MicroStrategy is no longer just a BTC proxy.
It is now a test of:
Index methodology,
Market microstructure,
Capital-structure engineering,
And whether a listed company can operate as a quasi-ETF on Bitcoin.

MSTR has bottomed out It appears the MSTR has bottomed out and it looks like the big boys have scared all the weak hands. As they are gobbling up positions in bitcoin and MSTR.

Strategy Inc. (MSTR)The stock is tied to the performance of Bitcoin, however, there seems to be a significant divergence in recent months. Handle with care.

MicroStrategy's Bitcoin Leverage Could Drive Sharp Weekly Downsi
Current Price: $179.25
Direction: SHORT
Confidence Level: 68%
Targets:
- T1 = $173.00
- T2 = $167.00
Stop Levels:
- S1 = $184.50
- S2 = $189.00
**Wisdom of Professional Traders:**
I'm combining insights from multiple professional traders across financial video platforms with real-time sentiment tracking from the X trading community. This collective view leans cautious on MicroStrategy, highlighting that its high-average Bitcoin purchase prices and poor recent share performance could set up further downside in the coming week. Several traders pointed to the MNAV threshold and overleveraged position in Bitcoin as structural weaknesses that could be quickly exposed if BTC pulls back. The wisdom here is clear: leveraged exposure to a volatile asset like Bitcoin magnifies price swings in MSTR.
**Key Insights:**
Here's what's driving this short bias: many traders stressed MicroStrategy’s vulnerability to Bitcoin price drops, given their majority buys between $80,000 and $100,000 per BTC. They noted the cushion at a current BTC price of $91,000, but if Bitcoin slips under $80,000 and the MNAV falls below 1.0, forced liquidation could trigger a cascade of selling in MSTR. The key point is that MSTR has already dropped 60% in a market where Bitcoin itself has rallied – that underperformance is telling.
What's interesting is that even some historically bullish voices on crypto proxies are now warning about the company's concentrated risk profile. Traders are watching the $180 zone as a fragile balance point – failure to hold it could see quick moves down to $173 and $167 within days. The idea is that technical weakness aligns with fundamental risk, creating a high-probability short setup for this week.
**Recent Performance:**
In the past three to four months, MicroStrategy has sold off roughly 60% from highs near $457. Instead of tracking Bitcoin's recent strong rallies, it has lagged significantly, suggesting that investor confidence has waned. The price has hovered near $179 recently, but intraday probes under $175 last week hint at sellers dominating the tape. This divergence from Bitcoin strength is a red flag for traders looking for relative strength plays.
**Expert Analysis:**
Several professional traders I follow identified MicroStrategy’s MNAV danger zone as a key technical and fundamental tripwire. The average Bitcoin purchase prices, documented in their analysis, drastically reduce flexibility in volatile markets. They also pointed out that the hype around MSTR tends to spike only when Bitcoin goes parabolic – the absence of such hype in current conditions is another bearish tell. In technical terms, repeated rejection near $184-$189 forms a clear short-term resistance area ripe for fades.
**News Impact:**
The most impactful recent discussion revolves around upcoming macro catalysts – Jerome Powell’s speech and PCE inflation prints – which could inject volatility into Bitcoin, thereby affecting MSTR’s price. Multiple traders noted that any surprise downside move in BTC could disproportionately hurt MicroStrategy due to its leveraged exposure. Coupled with the market’s newfound skepticism about their high purchase prices, news alignment is skewed negative for the week.
**Trading Recommendation:**
Putting it all together, I’d initiate a SHORT position near current levels ($179.25) with first target at $173.00 and second at $167.00 over the next 5-7 trading days. Stops should be set at $184.50 and $189.00 to protect against a squeeze if Bitcoin unexpectedly spikes. Position sizing should be moderate given macro event risk, but the alignment of technical selling pressure, fragile fundamentals, and cautious sentiment across platforms supports this short bias.

Why We Loaded $MSTR at $169 (5:1 Risk/Reward to $355)Have you ever watched a stock pull back 65% and wondered if it was opportunity or disaster?
Have you ever missed a major setup because fear told you to stay away?
This analysis breaks down why NASDAQ:MSTR at $169 presented a textbook geometric retracement opportunity with exceptional risk/reward asymmetry.
Hello ✌️
Spend 3 minutes ⏰ reading this educational breakdown of structure-based position entry.
🎯 Analytical Insight on MSTR
MicroStrategy pulled back from $543 to $169 a 65% retracement that brought price directly into a major accumulation zone. This wasn't random. It aligned perfectly with:
Fibonacci retracement from 2020 lows to 2024 highs
A long-term ascending trendline dating back to 2020
The monthly $112 support zone that held as a floor
Our position entry: $169
Our invalidation level: $131.80 (below structure)
Our first target: $360 (previous resistance zone)
Risk: $37.20 per share
Reward: $191 per share
Ratio: 5.13:1
This setup didn't require predicting the future. It required identifying where risk was defined and reward was probable based on historical price structure.
📚 Educational Section: Why Geometric Retracements Work
The Psychology of Pullbacks
When price drops 65%, most traders experience:
Fear that it will continue falling forever
Doubt about whether the trend is still valid
Paralysis from watching others panic sell
Professional traders see the same chart differently:
Defined risk at structural support
Historical patterns of mean reversion
Favorable asymmetry when risk is small relative to potential reward
The majority fears what professionals buy.
📉 Understanding Market Structure
Markets don't move in straight lines. They:
Trend in one direction (impulse)
Retrace to gather liquidity (correction)
Resume the primary direction (continuation)
The 0.618 to 0.786 retracement zone historically shows the highest probability of reversal in trending assets. Why?
Early sellers have exhausted
Value buyers recognize the discount
Risk can be defined tightly below support
At $169, MSTR offered:
Clear invalidation below $131.80
Multiple timeframe confluence
Structural support from prior consolidation
🎯 Why This Entry Made Sense
Risk Was Defined
Below $169, the next logical support was $131.80. If price broke below that level, the bullish structure would be invalidated. This gave us a clear exit point before entering.
Reward Was Probable
The previous resistance zone at $360 represented a 113% gain from entry. Even a conservative 50% retracement would target $220+, still offering excellent reward.
Structure Aligned
Monthly support held
Trendline from 2020 intact
Retracement zone tested multiple times
Volume showed exhaustion, not acceleration
📊 Tools Used for This Analysis
Fibonacci Retracement
Identified the 0.786 level as a deep pullback zone where buyers historically step in.
Trendline Analysis
The ascending line from 2020 provided dynamic support that price respected.
Volume Profile
Showed accumulation at lower levels with decreasing selling pressure.
Horizontal Support Zones
The $105-110 monthly level acted as a psychological floor, preventing further collapse.
Risk/Reward Calculator
Entry: $169
Stop: $131.80
Target: $360
Result: 5.13:1 asymmetry
🛡️ Risk Management Framework
Stop Loss Below Structure
Our stop at $131.80 was placed below the invalidation point. If price reached that level, our thesis would be wrong and we'd exit with controlled loss of $37.20 per share.
Position Sizing Based on Risk
With $37.20 risk per share, position size was calculated to risk only 1-2% of total capital. This meant even if wrong, the account remained intact.
Target Based on Structure, Not Hope
$360 wasn't arbitrary. It represented previous resistance where sellers had historically appeared. We planned to reduce exposure at that level.
🧠 Trader Psychology: Why Most Miss These Setups
Fear of Catching a Falling Knife
After a 65% drop, the brain assumes it will continue. But without defined support, there's no knife just falling into the void. At $169, support was visible and the stop at $131.80 was clear.
Recency Bias
The most recent price action (the drop) feels like it will continue forever. Historical structure suggests otherwise, but emotions overpower data.
Herd Mentality
When everyone is bearish, contrarian positions feel uncomfortable. But the best risk/reward setups rarely have crowd consensus.
Waiting for Confirmation
Many traders wait for price to "prove" itself by moving higher first. By then, risk has expanded and reward has diminished. Entry at $169 with $37.20 risk is superior to entry at $250 with $118.20 risk to the same stop level.
📌 Proper Entry Execution
We didn't enter the entire position at once:
First third at $169 (initial position)
Second third at $155 if support retested (average down if structure held)
Final third reserved if $140 tested (closer to stop but maximum opportunity)
This scaling approach:
Reduced emotional pressure
Improved average entry if structure tested
Maintained discipline through volatility
🏆 What Professionals Do Differently
They Don't Chase Momentum
Entry at $543 (the top) felt safe because price was rising. Entry at $169 felt dangerous because price was falling. Professionals understand that perceived safety is often maximum risk.
They Define Risk First
Before asking "how much can I make," they ask "how much can I lose." The $131.80 level answered that question clearly.
They Accept Being Wrong
If MSTR broke $131.80, the position would be exited without hesitation. No hoping, no averaging down into a broken structure. Wrong is wrong.
They Journal Every Decision
Entry logic, risk parameters, and target zones were documented before entry. This removes emotion from exit decisions later.
🎯 Key Takeaways
✅ Risk/reward asymmetry matters more than being right: A 5:1 setup allows you to be wrong multiple times and still profit overall if position sizing is consistent.
✅ Structure defines opportunity: Random entries have random outcomes. Entries at defined support with clear invalidation have statistical edges.
✅ Emotions are the enemy: When $169 felt scary, that was the signal. When $543 felt safe, that was the warning.
✅ Patience beats prediction: We didn't predict $169 was the bottom. We identified it as a zone where risk was small ($37.20) and reward was large ($191). That's enough.
⚠️ Important Disclaimers
This analysis is educational and reflects a specific position entry based on technical structure. It is not financial advice or a recommendation to buy or sell MSTR or any security.
Position entries, stop losses, and targets are shared for educational purposes to demonstrate risk management principles. Your risk tolerance, timeframe, and capital allocation should differ based on your individual circumstances.
Past price structure does not guarantee future performance. MSTR could have broken $131.80 and invalidated this setup entirely, resulting in a controlled loss. Not all setups work, which is why risk management exists.
Always conduct your own analysis, consider your risk tolerance, and consult with a financial professional before making investment decisions. All trading and investing involves risk of loss.
✨ Support This Content
If this breakdown helped you understand structure-based entries and risk management, leave a comment with your thoughts or questions. Your engagement helps us create more educational content like this.
📜 Do your own research. Manage your risk. Trade with discipline.

MSTR nearing bottom?NASDAQ:MSTR Price dropped hard wave Y of IV, invalidating the previous analysis.
Wave Y can complete any time in this flat correction pattern, but is approaching the 0.382 Fibonacci retracement, a high probability bottom.
📈 Daily RSI went deep into oversold, negating the bullish divergence
👉 Continued downside has a target of the High Volume Node, $101
Safe trading
