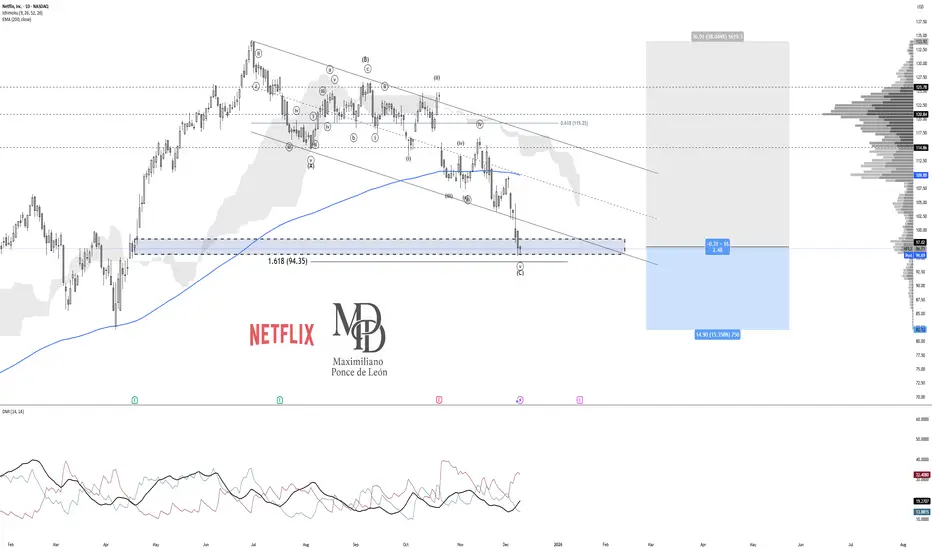
Netflix - This stock will drop another -30%!📽️Netflix ( NASDAQ:NFLX ) is still totally bearish:
🔎Analysis summary:
A couple of months ago, Netflix retested a major resistance trendline. This was a clear sign for us to take profits and Netflix has already been dropping about -30%. Looking at structure, the next support is the previous a
Netflix, Inc. Shs ert Deposito Arg Repr 0.0208333 Sh
No trades
Key facts today
60 ARS
7.98 T ARS
35.60 T ARS
About Netflix, Inc.
Sector
Industry
Website
Headquarters
Los Gatos
Founded
1997
Identifiers
2
ISIN:ARBCOM4601D2
Netflix, Inc operates as a streaming entertainment service company. The firm provides subscription service streaming movies and television episodes over the Internet and sending DVDs by mail. It operates through the following segments: Domestic Streaming, International Streaming and Domestic DVD. The Domestic Streaming segment derives revenues from monthly membership fees for services consisting of streaming content to its members in the United States. The International Streaming segment includes fees from members outside the United States. The Domestic DVD segment covers revenues from services consisting of DVD-by-mail. The company was founded by Marc Randolph and Wilmot Reed Hastings Jr. on August 29, 1997 and is headquartered in Los Gatos, CA.
Related stocks

Netflix Paramount - Acquisition war - What You need to know. Netflix is selling off because it announced a massive, high‑risk acquisition of major Warner Bros. Discovery assets — and the market hates the price, the leverage, and the regulatory risk.
The bid is in the range of $72-$82 Billion.
Trump tweeted last night putting the deal under scrutiny.
This

Netflix Going to 82 or lower? Here is a quick analysis of the market of we are currently seeing, if you need further help and are struggling send me a DM more than happy to answer any questions you may have
Trade Smarter Live Better
Kris

NETFLIX ($NFLX): Key Technical Zone With Strong ConfluenceNETFLIX ( NASDAQ:NFLX ): Key Technical Zone With Strong Confluence
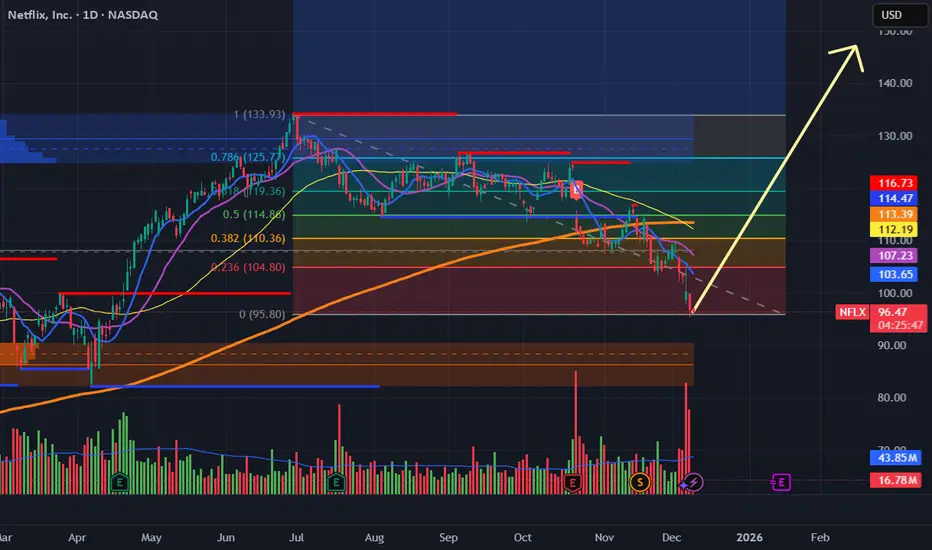
Netflix has retraced to a notable support area after reaching an all-time high on June 30th, 2025. The current structure suggests a potential continuation of the long-term bullish trend, supported by technical and fundamental develo

Netflix Buys Warner Bros in Historic $82.7B TakeoverNetflix’s $82.7B Warner Bros Discovery Takeover Signals a Historic Power Shift in Hollywood
Netflix (NASDAQ: NFLX) has officially struck a landmark deal to acquire the film and streaming divisions of Warner Bros. Discovery (WBD) in a transaction valued at $82.7 billion, including debt — the biggest

NFLX: Flag Forming as Market Awaits Clarity on Warner Bros DealNetflix has broken into a wider flag structure as the market digests the recent announcement of its planned acquisition of Warner Bros. Discovery. The initial move lower reflects uncertainty rather than a judgment on long-term value — which is exactly what you typically see in the early stages of la

NFLX - Conteo ElliotPossible end of the corrective ABC in NFLX, reaching the 1.618 extension of wave C and reacting in a Demand zone. Entries here seem reasonable with a stop-loss at 82 USD.
For more conservative entries, wait for the 61.8% retracement of the entire ABC (119 USD).
NFLX has bottomed and will reverseNASDAQ:NFLX With amazing earnings and ATH revenue, NFLX is set to reverse from here. Great price to buy here at a 35% discount.
NETFLIXDear Traders
Netflix i see it can reach this target first even i see lower in the future
lets see how this can play out

Netflix to Acquire Warner Bros: Effect on NFLX SharesNetflix to Acquire Warner Bros: Effect on NFLX Shares
A major development in the stock market is the news that Netflix is buying the assets of Warner Bros. Discovery for $82.7 billion. How might this influence the price of NFLX shares?
To assess the outlook, context is essential.
In the second

See all ideas
Summarizing what the indicators are suggesting.
Oscillators
Neutral
SellBuy
Strong sellStrong buy
Strong sellSellNeutralBuyStrong buy
Oscillators
Neutral
SellBuy
Strong sellStrong buy
Strong sellSellNeutralBuyStrong buy
Summary
Neutral
SellBuy
Strong sellStrong buy
Strong sellSellNeutralBuyStrong buy
Summary
Neutral
SellBuy
Strong sellStrong buy
Strong sellSellNeutralBuyStrong buy
Summary
Neutral
SellBuy
Strong sellStrong buy
Strong sellSellNeutralBuyStrong buy
Moving Averages
Neutral
SellBuy
Strong sellStrong buy
Strong sellSellNeutralBuyStrong buy
Moving Averages
Neutral
SellBuy
Strong sellStrong buy
Strong sellSellNeutralBuyStrong buy
Displays a symbol's price movements over previous years to identify recurring trends.
NFLX5862368
Netflix, Inc. 5.4% 15-AUG-2054Yield to maturity
5.64%
Maturity date
Aug 15, 2054
NFLX5862367
Netflix, Inc. 4.9% 15-AUG-2034Yield to maturity
4.61%
Maturity date
Aug 15, 2034
USU74079AN1
Netflix, Inc. 5.375% 15-NOV-2029Yield to maturity
4.33%
Maturity date
Nov 15, 2029
NFLX4901374
Netflix, Inc. 4.875% 15-JUN-2030Yield to maturity
4.30%
Maturity date
Jun 15, 2030
NFLX4908613
Netflix, Inc. 6.375% 15-MAY-2029Yield to maturity
4.06%
Maturity date
May 15, 2029
NFLX4826528
Netflix, Inc. 5.875% 15-NOV-2028Yield to maturity
4.03%
Maturity date
Nov 15, 2028
NFLX4764899
Netflix, Inc. 4.875% 15-APR-2028Yield to maturity
3.98%
Maturity date
Apr 15, 2028
NFCD
Netflix, Inc. 4.375% 15-NOV-2026Yield to maturity
3.94%
Maturity date
Nov 15, 2026
XS198938050
Netflix, Inc. 3.875% 15-NOV-2029Yield to maturity
3.32%
Maturity date
Nov 15, 2029
XS207282979
Netflix, Inc. 3.625% 15-JUN-2030Yield to maturity
3.19%
Maturity date
Jun 15, 2030
XS198938017
Netflix, Inc. 3.875% 15-NOV-2029Yield to maturity
2.99%
Maturity date
Nov 15, 2029
See all NFLX bonds
Curated watchlists where NFLX is featured.


