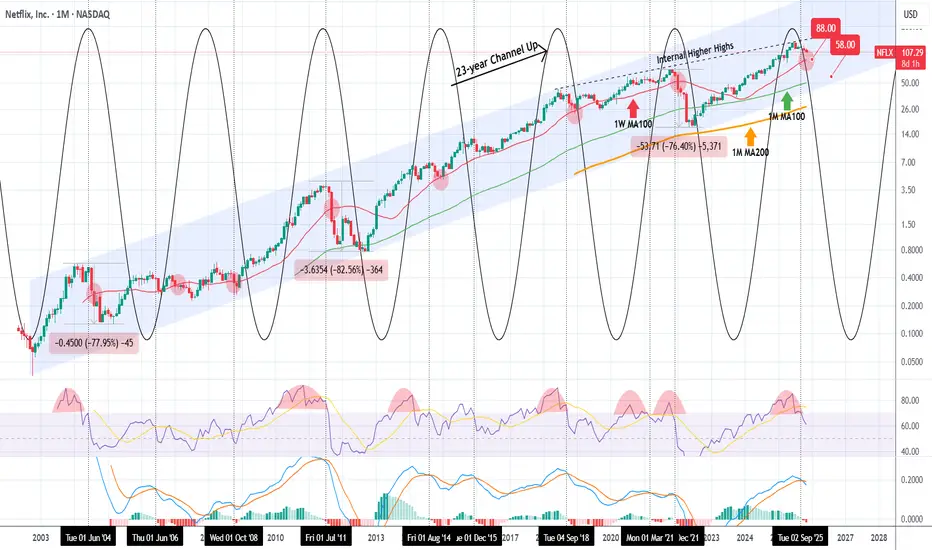
NETFLIX 23-year pattern started a correction. Could be massive.A month ago (October 14, see chart below) we published the following chart on Netflix (NFLX) calling for a strong correction, but the immediate split has distorted the price:
We thought it would be a good time to publish it again with the current price action and with the addition of its 23-yea
Key facts today
60 ARS
7.98 T ARS
35.60 T ARS
About Netflix, Inc.
Sector
Industry
Website
Headquarters
Los Gatos
Founded
1997
ISIN
ARBCOM4601D2
FIGI
BBG00PD5WBY1
Netflix, Inc operates as a streaming entertainment service company. The firm provides subscription service streaming movies and television episodes over the Internet and sending DVDs by mail. It operates through the following segments: Domestic Streaming, International Streaming and Domestic DVD. The Domestic Streaming segment derives revenues from monthly membership fees for services consisting of streaming content to its members in the United States. The International Streaming segment includes fees from members outside the United States. The Domestic DVD segment covers revenues from services consisting of DVD-by-mail. The company was founded by Marc Randolph and Wilmot Reed Hastings Jr. on August 29, 1997 and is headquartered in Los Gatos, CA.
Related stocks
The Future of the Global Trading Market1. Technology Will Drive Every Aspect of Global Markets
a) Artificial Intelligence & Algorithmic Trading Dominate
The rise of AI is set to completely redefine market participation. In today’s markets, more than 65–70% of global trades are already executed by automated algorithms. As AI improves, al
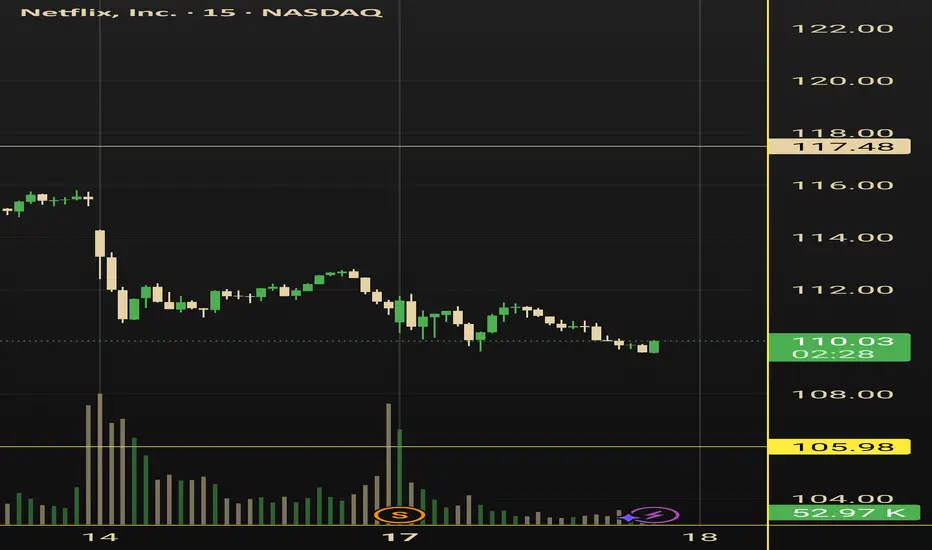
Eyeing $100 Before Going In Even though we got the split and demand will likely kick up from all the new eyes and smaller retail buyers jumping in, I’m still eyeing that $100 level before going in on Netflix long-term.
A split brings hype, more volume, and usually a short-term run, but long-term entries still need patience. A
Emerging Markets: India, Brazil, and Indonesia1. India: The Fastest-Growing Major Emerging Market
India stands out as one of the most dynamic emerging markets globally. With a population of over 1.4 billion and a young workforce, India provides a huge labor pool and consumer market. Its economic strengths lie in technology, manufacturing, serv

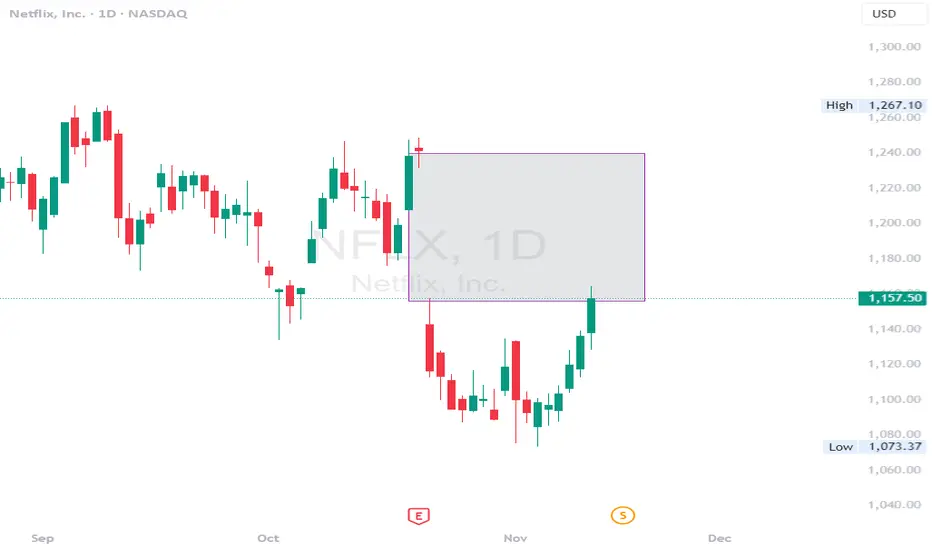
$NFLX - gap fill enter. Pre split move incomingNFLX - Stock moving higher as split date approaches. Stock held $1080 support level and now into the gap to $1241.11. looking for gap fill pre split. Stock is strong at indicator level.
The Role of the Metals Market in Global Trade1. Historical Background and Evolution of the Metals Market
Metals have played a pivotal role in the evolution of human societies. Ancient civilizations like Egypt, Mesopotamia, and the Indus Valley used copper, bronze, and gold for tools, ornaments, and trade. The discovery of iron marked the begi

Netflix (NFLX) - Elliott Wave Map to $25K📘 Netflix (NFLX) – The Final Act of Supercycle Wave III, Setting the Stage for Wave V to $25,000+
Symbol: NASDAQ:NFLX
Timeframe: Monthly
Published: October 2025
Current Price: ~$1,120
Framework: Elliott Wave | Fibonacci Extensions | Price Action | Smart Money Concepts (SMC) | Fundamenta

NFLX CRACK!!Classic breakdown move from a rising F flag!
Massive Head and shoulders formed, that head test followed through, taking out stops, and now failing off the top of the channel.
Screaming CAUTION to the bulls!
Nice simple short setup for bears.
Click boost, follow, and subscribe. Let's get to 5,000

Netflix Inc Eyes Video Podcast Expansion Amid Platform EvolutionNetflix Inc. (NASDAQ: NASDAQ:NFLX ) appears ready to expand its media ecosystem once again — this time, into the growing world of video podcasts. Following its recent partnership with Spotify that introduced 16 video podcasts to the platform, Bloomberg now reports that Netflix is developing its own

Bull flag on a pole Textbook falling wedge, made one just like it before exploding upward just to make another (good possibility it will continue upward when breakout) 😎

See all ideas
Summarizing what the indicators are suggesting.
Oscillators
Neutral
SellBuy
Strong sellStrong buy
Strong sellSellNeutralBuyStrong buy
Oscillators
Neutral
SellBuy
Strong sellStrong buy
Strong sellSellNeutralBuyStrong buy
Summary
Neutral
SellBuy
Strong sellStrong buy
Strong sellSellNeutralBuyStrong buy
Summary
Neutral
SellBuy
Strong sellStrong buy
Strong sellSellNeutralBuyStrong buy
Summary
Neutral
SellBuy
Strong sellStrong buy
Strong sellSellNeutralBuyStrong buy
Moving Averages
Neutral
SellBuy
Strong sellStrong buy
Strong sellSellNeutralBuyStrong buy
Moving Averages
Neutral
SellBuy
Strong sellStrong buy
Strong sellSellNeutralBuyStrong buy
Displays a symbol's price movements over previous years to identify recurring trends.
NFLX5862368
Netflix, Inc. 5.4% 15-AUG-2054Yield to maturity
5.52%
Maturity date
Aug 15, 2054
NFLX5862367
Netflix, Inc. 4.9% 15-AUG-2034Yield to maturity
4.49%
Maturity date
Aug 15, 2034
USU74079AN1
Netflix, Inc. 5.375% 15-NOV-2029Yield to maturity
4.15%
Maturity date
Nov 15, 2029
NFLX4901374
Netflix, Inc. 4.875% 15-JUN-2030Yield to maturity
4.14%
Maturity date
Jun 15, 2030
NFLX4908613
Netflix, Inc. 6.375% 15-MAY-2029Yield to maturity
4.06%
Maturity date
May 15, 2029
NFLX4826528
Netflix, Inc. 5.875% 15-NOV-2028Yield to maturity
3.97%
Maturity date
Nov 15, 2028
NFLX4764899
Netflix, Inc. 4.875% 15-APR-2028Yield to maturity
3.94%
Maturity date
Apr 15, 2028
US64110LAN64
Netflix, Inc. 4.375% 15-NOV-2026Yield to maturity
3.71%
Maturity date
Nov 15, 2026
XS198938050
Netflix, Inc. 3.875% 15-NOV-2029Yield to maturity
3.33%
Maturity date
Nov 15, 2029
XS207282979
Netflix, Inc. 3.625% 15-JUN-2030Yield to maturity
2.95%
Maturity date
Jun 15, 2030
XS198938017
Netflix, Inc. 3.875% 15-NOV-2029Yield to maturity
2.87%
Maturity date
Nov 15, 2029
See all NFLX bonds
Curated watchlists where NFLX is featured.


