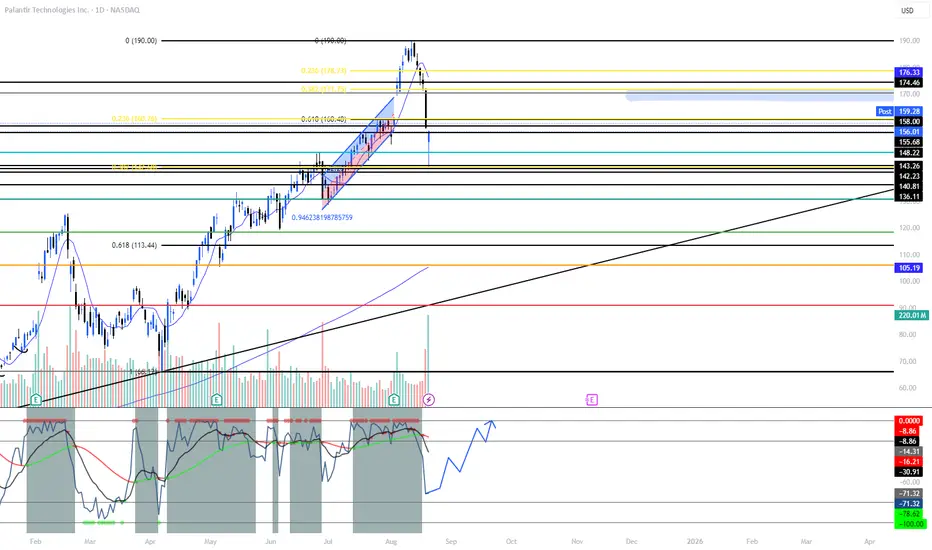
Palantir - A devastating -40% drop!🤬Palantir ( NASDAQ:PLTR ) will create a major correction:
🔎Analysis summary:
After a textbook bullish break and retest in mid 2024, we witnessed a parabolic rally on Palantir. During the entire rally, we only witnessed one red candle, which clearly shows some significant overextension. Theref
200 ARS
423.22 B ARS
2.62 T ARS
About Palantir Technologies Inc.
Sector
Industry
CEO
Alexander Caedmon Karp
Website
Headquarters
Denver
Founded
2003
ISIN
AR0132889822
FIGI
BBG01M5Z8WY1
Palantir Technologies, Inc. engages in the business of building and deploying software platforms that serve as the central operating systems for its customers. It operates through the Commercial and Government segments. The Commercial segment focuses on customers working in non-government industries. The Government segment is involved in providing services to customers that are the United States government and non-United States government agencies. Its platforms are widely used in areas such as defense, intelligence, healthcare, energy, and financial services, supporting data integration, large-scale analytics, and operational decision-making. The company was founded by Alexander Ceadmon Karp, Peter Andreas Thiel, Stephen Cohen, Joseph Lonsdale, and Nathan Dale Gettings in 2003 and is headquartered in Denver, CO.
Related stocks

PALANTIR Is there time to reach $250 before Bear Cycle begins?Palantir (PLTR) has been trading within a multi-year Channel Up throughout this Bull Cycle, which despite the recent correction just above the 1W MA200 (orange trend-line), it still stands.
The last time in fact that we had a similar 1W MA200 approach on such a 1D RSI pattern (RSI reaching 34.00) w

Midterm Stock Forecast for PalantirNASDAQ:PLTR at $154 maintains a strong accumulation profile, supporting expectations of a rise toward $200. H1 structure remains bullish with higher lows forming. Fundamentally, expanding government contracts and improving commercial AI adoption justify continued midterm optimism.

2025 Palantir Q4 Thesis Palantir is demonstrating a break in Market structure as shown over the last few weeks.
Causes:
Dollar Strength is causing the devaluation of All Assets.
Fear of an economic crisis are causing investors to take a risk off approach on Speculative assets which will create a particularly noticea

PLTR: This Drop ≠ February — Setup for 200+PLTR’s August dip looks nothing like February’s correction. In Feb, price unwound ~30% after insider-sale headlines + gov-spend fears and flushed to the 0.618 retrace, breaking key MAs. This time, the selloff paused at shallow fibs (0.236–0.382), held stacked support ($156 → $148 zone), and buyers s
QuantSignals V3: PLTR Weekly Put Play – Strong Bearish Momentum!PLTR Weekly (QuantSignals V3 | 2025-11-24)
Direction: BUY PUTS
Confidence: 60%
Expiry: 2025-11-28 (4 days)
Strike Focus: $148.00
Entry Range: $0.52 – $0.55 (mid: $0.54)
Target 1: $0.85 (≈63% gain)
Target 2: $1.10 (≈100% gain)
Stop Loss: $0.35 (≈35% loss)
Position Size: 2% of portfolio (moderate con

PLTR: Trend Analysis 📈 PLTR | SMC Trend Continuation or Reversal? Watch This Key Zone
🔍 Chart Type: 15m
🧠 Strategy: Smart Money Concepts (LuxAlgo), EMA Stack (20/50/100/200)
📊 Volume Surge: 177.99K
🧭 Narrative: Institutional Accumulation + Premium Rejection
🚨 Current Price: $145.88
📍 Market Structure:
Price is curren

PLTR long-term TAPalantir is a massive beast, this stock has a very strong uptrend on weekly time frame and it's far from done yet, currently there's a countertrend correction in the process and the distribution on mid-term but as for the long-term it has lots of resources left to continue the uptrend rally after th

Palantir Technologies Inc. poised for upside as AI sector momentCurrent Price: $158.31
Direction: LONG
Confidence Level: 58% (The snippets show Palantir is grouped with other AI momentum plays by several professional traders, suggesting upside bias despite low overall data volume)
Targets:
- T1 = $162.00
- T2 = $165.50
Stop Levels:
- S1 = $156.

Is the Tesla / Palantir Fractal showing where Tesla goes next?If Tesla follows the Palantir fractal then there may be bearish pressure on Tesla.
What do you think?
May the trends be with you.

See all ideas
Summarizing what the indicators are suggesting.
Oscillators
Neutral
SellBuy
Strong sellStrong buy
Strong sellSellNeutralBuyStrong buy
Oscillators
Neutral
SellBuy
Strong sellStrong buy
Strong sellSellNeutralBuyStrong buy
Summary
Neutral
SellBuy
Strong sellStrong buy
Strong sellSellNeutralBuyStrong buy
Summary
Neutral
SellBuy
Strong sellStrong buy
Strong sellSellNeutralBuyStrong buy
Summary
Neutral
SellBuy
Strong sellStrong buy
Strong sellSellNeutralBuyStrong buy
Moving Averages
Neutral
SellBuy
Strong sellStrong buy
Strong sellSellNeutralBuyStrong buy
Moving Averages
Neutral
SellBuy
Strong sellStrong buy
Strong sellSellNeutralBuyStrong buy
Displays a symbol's price movements over previous years to identify recurring trends.