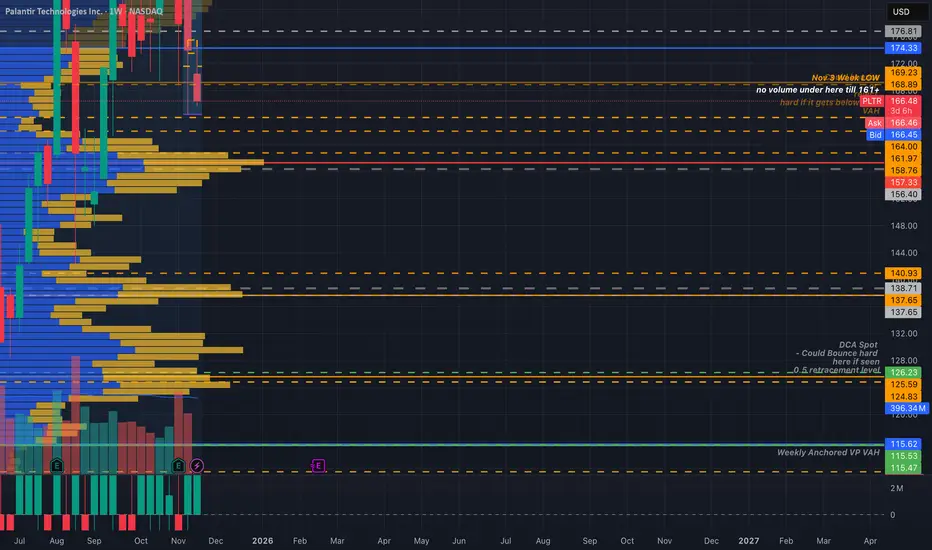
Huntin Wabbits 2.0 - The Doc Sees What's UpPalantir is coming into that death zone if the market doesn't see a recovery soon. If seen, the PA at 161-157(VPOC) will let us know if we dip to $126-$124 again.
Taking a look at this weekly volume profile, the most value for buyers would be at the $115 area.
I'd sell my wife and kids to buy tha
200 ARS
423.22 B ARS
2.62 T ARS
About Palantir Technologies Inc.
Sector
Industry
CEO
Alexander Caedmon Karp
Website
Headquarters
Denver
Founded
2003
ISIN
AR0132889822
FIGI
BBG01M5Z8WY1
Palantir Technologies, Inc. engages in the business of building and deploying software platforms that serve as the central operating systems for its customers. It operates through the Commercial and Government segments. The Commercial segment focuses on customers working in non-government industries. The Government segment is involved in providing services to customers that are the United States government and non-United States government agencies. Its platforms are widely used in areas such as defense, intelligence, healthcare, energy, and financial services, supporting data integration, large-scale analytics, and operational decision-making. The company was founded by Alexander Ceadmon Karp, Peter Andreas Thiel, Stephen Cohen, Joseph Lonsdale, and Nathan Dale Gettings in 2003 and is headquartered in Denver, CO.
Related stocks
Palantir - A devastating -40% drop!🤬Palantir ( NASDAQ:PLTR ) will create a major correction:
🔎Analysis summary:
After a textbook bullish break and retest in mid 2024, we witnessed a parabolic rally on Palantir. During the entire rally, we only witnessed one red candle, which clearly shows some significant overextension. Theref

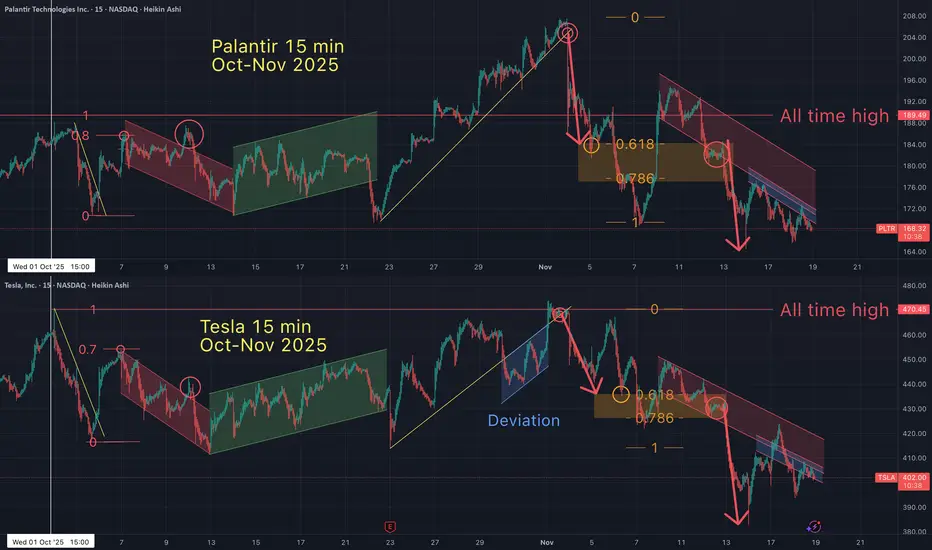
Tesla / Palantir FRACTAL - STILL following for weeks now.So why focus on fractals? I'm driving a point home and I hope you get it. These Tesla/ Palantir "fractal" charts should trigger questions like, "how is it possible for these 2 random assets to basically have the same price action (at the same time) over a 5 week period (on a 15 minute time frame & t
Update.155 target from prior post achieved. Price accelerated through the red bullish divergence lines. Got worried with NVDA pump but luckily now that created a very clean price target now. Looking to hit 142 next. White solid lines are showing a negative divergence in RSI vs price.

Midterm Stock Forecast for PalantirNASDAQ:PLTR at $154 maintains a strong accumulation profile, supporting expectations of a rise toward $200. H1 structure remains bullish with higher lows forming. Fundamentally, expanding government contracts and improving commercial AI adoption justify continued midterm optimism.

PLTR: Trend Analysis 📈 PLTR | SMC Trend Continuation or Reversal? Watch This Key Zone
🔍 Chart Type: 15m
🧠 Strategy: Smart Money Concepts (LuxAlgo), EMA Stack (20/50/100/200)
📊 Volume Surge: 177.99K
🧭 Narrative: Institutional Accumulation + Premium Rejection
🚨 Current Price: $145.88
📍 Market Structure:
Price is curren

2025 Palantir Q4 Thesis Palantir is demonstrating a break in Market structure as shown over the last few weeks.
Causes:
Dollar Strength is causing the devaluation of All Assets.
Fear of an economic crisis are causing investors to take a risk off approach on Speculative assets which will create a particularly noticea

155 targetIf price breaks the prior low (solid yellow line) target of 155.00 in play. Expect price to accelerate downward when RSI passes the bullish divergence line.

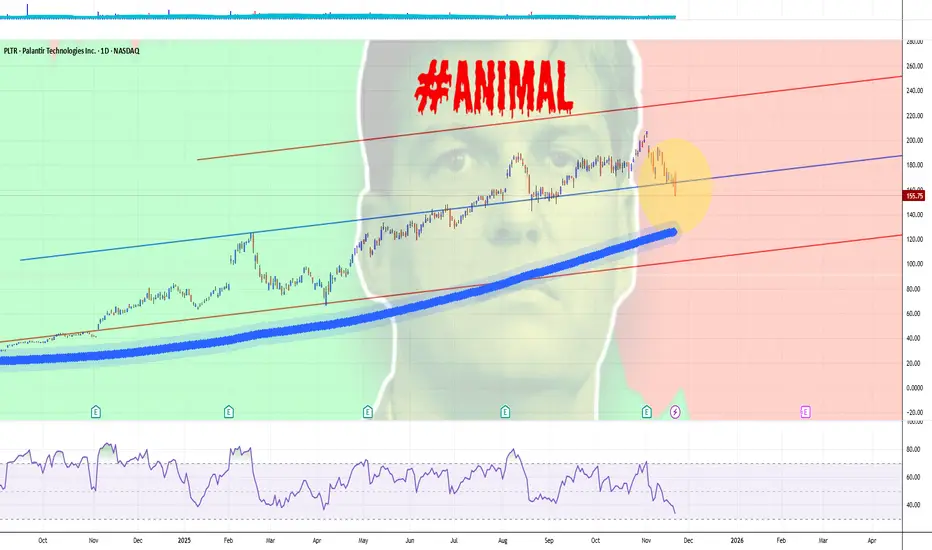
THE BATSHIT ANIMAL SENDS PALANTIR STOCK BELOW ITS MAJOR SUPPORTMichael Burry, known from "The Big Short," recently made a significant bearish bet against Palantir Technologies, placing put options on about 5 million shares valued around $912 million.
This move signifies strong skepticism about Palantir's stock prospects despite the company's robust recent earn
QuantSignals V3: PLTR Bearish Divergence PUT SetupPLTR QuantSignals V3 – Weekly PUT Trade (2025-11-19)
Trade Signal:
Direction: BUY PUTS (Short)
Strike Price: $165.00
Entry Price: $4.60–$4.65 (mid $4.62)
Target 1: $6.90 (50% gain)
Target 2: $8.32 (80% gain)
Stop Loss: $3.23 (30% risk)
Expiry: 2025-11-21 (2 days)
Position Size: 3% of portfo

See all ideas
Summarizing what the indicators are suggesting.
Oscillators
Neutral
SellBuy
Strong sellStrong buy
Strong sellSellNeutralBuyStrong buy
Oscillators
Neutral
SellBuy
Strong sellStrong buy
Strong sellSellNeutralBuyStrong buy
Summary
Neutral
SellBuy
Strong sellStrong buy
Strong sellSellNeutralBuyStrong buy
Summary
Neutral
SellBuy
Strong sellStrong buy
Strong sellSellNeutralBuyStrong buy
Summary
Neutral
SellBuy
Strong sellStrong buy
Strong sellSellNeutralBuyStrong buy
Moving Averages
Neutral
SellBuy
Strong sellStrong buy
Strong sellSellNeutralBuyStrong buy
Moving Averages
Neutral
SellBuy
Strong sellStrong buy
Strong sellSellNeutralBuyStrong buy
Displays a symbol's price movements over previous years to identify recurring trends.