SMH heads up at $209.43: Golden Genesis fib may Break-n-RetestSMH just hit a Golden Genesis fib at $209.43.
That fib is reinforced by a Covid Stimulus fib.
This is a major landmark in this ETF's history.
$ 209.43 - 212.89 is the immediate resistance.
$ 236.36 - 238.96 is the next major resistance.
$ 191.21 - 191.90 below is the first good support.
It is PROBABLE that we orbit this zone for a while.
It is POSSIBLE that we break and retest for late buy.
It is PLAUSIBLE that we get a pullback here and now.
Here is a full view of the Genesis Sequence:
==========================================================================================
SMHC trade ideas

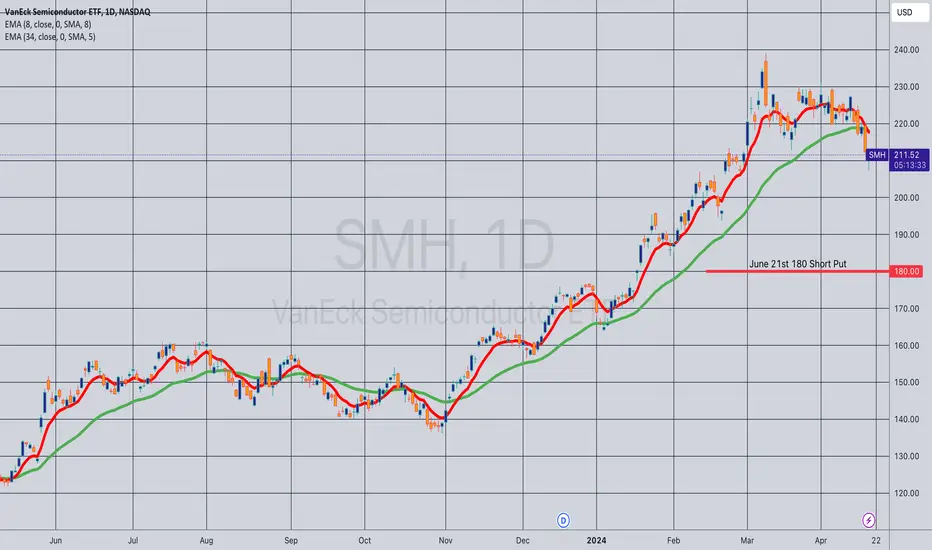
Opening (IRA): SMH June 21st 180 Short Put... for a 2.01 credit.
Comments: High IVR/IV at 75.1/35.1. Targeting the <16 delta strike paying around 1% of the strike price in credit to emulate dollar cost averaging into the semiconductor ETF.
I may look to ladder out at intervals if premium remains decent.
Opening (IRA): SMH July 19th 165 Short Put... for a 1.69 credit.
Comments: High IVR/IV at 78.9/34.5. Adding a rung out in July to my SMH position, targeting the <16 delta strike paying around 1% of the strike price in credit to emulate dollar cost averaging into the semiconductor ETF.
Generally, will look to take profit on the short put at 50% max.

SMH: Ain't over till its overThis is a follow-up on my Mar 9 post on NASDAQ:NVDA and I feel using the NASDAQ:SMH would explain overall market picture better. I struggled with how to frame this post as it is a combination of zooming into lower fractals and zooming out to higher fractals and hope this weekly chart helps.
In the immediate short-term, markets are oversold and you can spot the ABCD down completions in the 30M fractal. This is likely to be a short-term bounce into week end, month end to test 30M overhead neckline resistance.
In the weekly and daily chart, the overhead neckline resistance can be seen as the white dotted overhead resistance (representing extreme price volume action). Big picture wise, there are multiple ABCD completions for the SMH and its key component stocks which implies we should look at the Nov'21 to Oct'22 downturn guide the downside projection.
This would imply a downside projection to c.$164 with the $224 level as an invalidation level.

SMH in a symmetrical triangle hi traders,
The price is clearly in a symmetric triangle. Depends on which sloping it will break, it will then move upwards or downwards.
The long position can be taken if the price breaks to the upside. Target for long is 264.64$.
On another hand, short position can be taken if the price breaks down, with target 184.38$.

Opened (IRA): SMH May 17th 198 Monied Covered Call... for a 192.24 debit.
Comments: Opened this in late Friday's session as it floated to the top of my IV screener with IVR/IV at 106/39.
Sold the -75 delta call against 100 delta of long stock, with a resulting cost basis of 192.24/share. This is to emulate a 25 delta short put and to take advantage of call side IV skew while having "built-in" position defense via the short call. Will look to add at intervals, assuming IVR/IV remains high, generally taking profit at 50% max and defending via roll out of the short call.
Metrics:
BPE/Break Even/Cost Basis in Shares: 192.24
Max Profit: 5.76 ($576)
ROC at Max: 3.00%
ROC at 50% Max: 1.50%
Variants:
Short Put:
May 19th 200 Short Put, 4.65 at the mid, 195.35 (cash secured), 25.70 (on margin). 2.38% ROC at max, 1.19% at 50% max for cash secured; 18.09% ROC at max, 9.05% at 50% max on margin (which is why you stick with the short put on margin; it's more BP efficient).
Synthetic Short Put:
May 19th 110/200 Short Put Vertical, 4.50 at the mid, 85.50 (cash secured), paying .15 to bring in BPE by more than half, 5.26 ROC at max, 2.63% at 50% max.
This would only make sense in a cash secured environment from a BP efficiency standpoint; the naked short put remains more BP efficient on margin than either the covered call or the "synthetic naked short put" spread.
Standard Short Put Vertical:
May 19th 190/200 Short Put Vertical, 2.03 at the mid on BPE of 7.97 (both cash secured and on margin), 25.57% ROC at Max; 12.74% ROC at 50% max.

SMH breaks above its updward, reversal likelySMH has gone on a wonderful tear the last year and has recently showing signs that it is way overbought and due for a correction.
From a 1W period we see that SMH has broken above year long upward trend.
This is a first for SMH to do over the last year
The ETF has gone through some notable contractions like from Aug - Oct of 2023. This occured without breaking above the trend.
RSI 20 is now also for the first time showing that it has reached above 70 in over a year.
We should expect a decent contraction or elongated pull back in time to correct fore this over purchasing it went through.
Tighten your stop losses to protect against downside risk.

AI hype vs longer trend SemiconductorsIf hype continues to grow for AI and companies continue to increase spending on AI chips then semiconductors can break out of longer trend. Otherwise, the longer trend might see soon see a short term peak or even a 50% decline for SMH before going up to new highs.

"Have at it folks" - (Semi-conductors)Buyer beware here for the semis... NASDAQ:SMH
Monthly chart, parallel channel resistance..

SMH shortBearish Engulfing, breakaway Gap, trendline break + retest.
assumption: Fib# Ext. to 3.618 ( 238 ), retracement to 1.618 (182)
Short 240
Stop 225
Target 185
Risk management is much more important than a good entry point.
I am not a PRO trader.
In my trading plan, the Max Risk of each short term trade should be less than 1% of an account.

Opened: SMH March 15th 169/175/199/205 Iron Condor... for a 2.07 credit.
Comments: 30-day IV at 27.8%. (Higher would be better, but you can't have everything).
Collecting 1/3rd of the width of the wings in credit. 2.07 credit on BPE of 3.93; 52.7% ROC at max; 26.3% at 50% max.
As usual, will generally look to take profit at 50% max; adjust sides on side test. This is probably my last trade in the March monthly, since 45 DTE is kind of the wheelhouse for this stuff, and the March monthly is at 43 DTE.
I'll mostly hand sit from here until month end, with most of the trades being adjustments.

SMH $350 by Decmber 2025There are a number of trends and fibs that are showing SMH could be $350 by December of 2025. Of course, the smaller channel intersects with top of the larger channel right around that time, which would be likely to see a significant pullback.
Thoughts? Questions? Let me know and boost if you like this idea!

$SMH: Little More Off 210?SMH and AMD are showing signs of continuing their run here and we believe there could be a trade made here for a move off this handle. Prominent outperformance by both and our belief at the moment is that the Nasdaq may help out.

Opening (IRA): SMH March 15th 176 Monied Covered Call... for a 172.42 debit.
Comments: While I'm waiting for a July contract to open up in broad market instruments (IWM, QQQ, SPY), shopping around the ETF space for premium. Relative to broad market, SMH IV isn't horrible (the 30-day is currently at 29.3%). Selling the -75 delta call against long stock, to emulate a 25 delta short put and to take advantage of call IV skew (32.9% on the call side; 27.2% on the put).
3.58 max on BPE of 172.42; 2.08% at max; 1.04% at 50% max.
Will generally look to take profit at 50% max; roll out the short call to reduce cost basis further if it doesn't get there.

Parking some funds into this ETF - SMHIf we take a step back and plot the weekly chart of SMH, there lies a possibility that we may have a ABC pattern playing out in the weeks/months to come.
We are not out of the descending channel yet (a bullish sign) and it could also notch another level down as well (can't rule this out though I think is quite remote), so those who have yet to go LONG can wait for the breakout, establish bullish signals on smaller time frame and decide if you should add this to your portfolio.

SMHNot the best spot to try & get long semi's imo. NVDA reports tonight. I'm playing it short via SOXS. This way I won't get burned if NVDA doesn't fall hard & could possibly get a chance to add if NVDA goes up a little. Ultimately looking for SMH to test VWAP from October lows around $172.

SMH double top??What do you think?!? Looks easy to see IMO. Daily top on the SMH. Bad things coming for semis?

SMH to $191 Anchored in 2018 FibThis is a very long-term view of SMH. You can see the FIB that is in play which is anchored at $41 in December of 2018. We ran up all the way to just about $160 in December of 2021. We had a hard pullback to $84 and did a fast turn around, again to $160, in July of 2023.
We retraced almost perfectly to the 50% of that move to $136 and we are now in the uptrend of that move, which we hit that .272 extension of at $166.
We pulled back and are now heading for the 272 extension at $190, anchored way back in 2018. We may get there pretty quick and I would not be surprised if we peak out over the top of the channel to do it.
What do you think?

All time highs : MEMBERS DAILY ANALYSIS Jan 21 2024 The S&P500 broke out this week to new all time highs.
Finally playing catchup the nasdaq indices.
Semi-conductors continue to be the bright spot in the market.
10 year yield confims breakout.
many S&P sectors closed negative on the week despite the marekt making ATH's

VanEck ETF (SMH) should target 238 then 258Weekly chart, the formed chart pattern (Cup & Handle) has a target of 238, then 258 (after stabilizing above 240)
The stop loss below line R2 should be considered.

SMH - Inverse H&SSMH has formed an Inverse Head and Shoulders Pattern. Looking for a bounce to 169-170 if it can close above the neck line. Trading this with SOXL if pattern confirms.

$SMH Cup & Handle PatternWait for a pull back to the blue trend line before buying. A close below and the pattern fails. Best moves come from failed moves.
Cup & Handle Pattern The NASDAQ:SMH (Semiconductor ETF) is exhibiting a Cup & Handle pattern in technical analysis. This bullish continuation pattern involves a rounded bottom (cup) followed by a consolidation period (handle). Investors often anticipate an upward breakout after the handle formation, suggesting potential positive price movement in semiconductor stocks.

$SMH Looking for Gap Fill?The semiconductor sector has been on fire since bottoming out at the end of October. In fact, the low to the high in November was just over 21%! Some consolidation of those gains would be healthy.
I am looking for the NASDAQ:SMH ETF to fill the gap from Nov 14th. I am not predicting that it will however, I am thinking that is a good possibility. I have an alert set just above the gap fill. If that triggers, I will be looking for a reversal back up for a long entry. All TBD. NASDAQ:SOXX is a similar ETF with a similar pattern so whichever one you prefer I think is worth putting on a watchlist.
I ideas, not investing / trading advice. Comments always welcome. Thanks for looking.
