Intel Corp. The one that got away #2Didnt buy because of the masssive gap, but a day before the gap up, planned to buy if it were to break out from the pennant flag formation because i saw a similar setup in NYSE:SE before. Regrets? Yes, but there are still other stocks out there.
Trade ideas

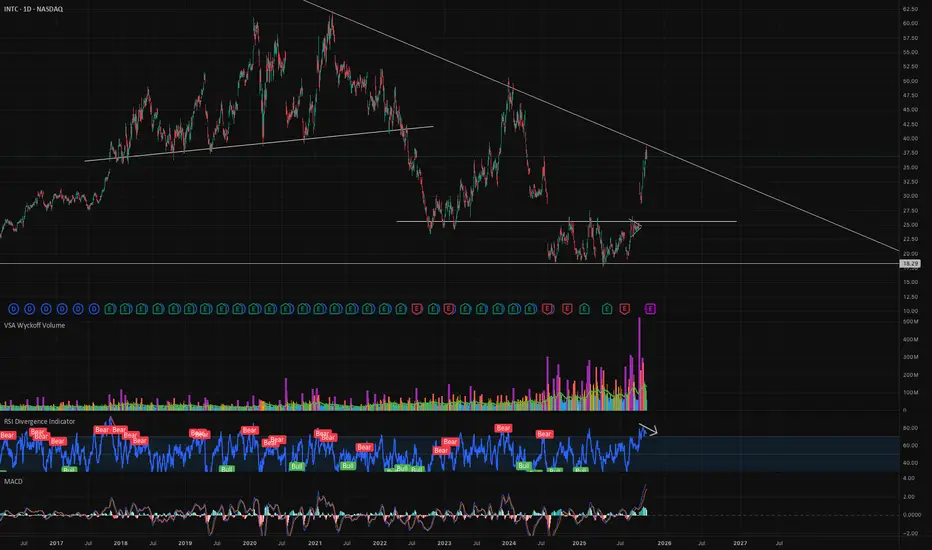
correction coming for $intccorrection coming for NASDAQ:INTC
- over extended, ATH daily RSI and MACD
- 4h and daily RSI divergence
- hit downtrend resistance
I've sold 80% of my intc position, and plan to buy back when correction reach $30-32.
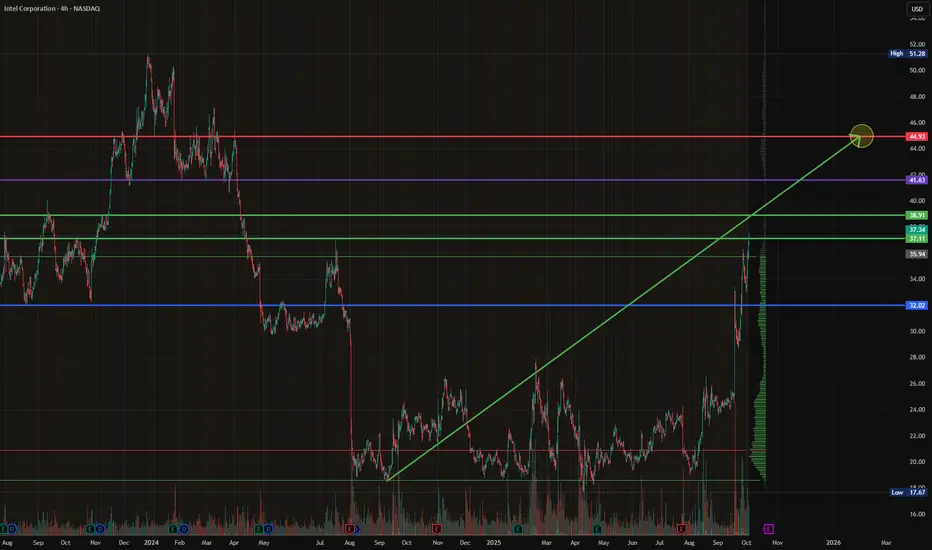
$INTC - Intel Corporation - $44.93 RetestNASDAQ:INTC is marching to it's next breakpoint at $38.91, with the potential to find next level resistance around the $41.63's, which we're looking for Momentum to drive it through, to retest $44.93.
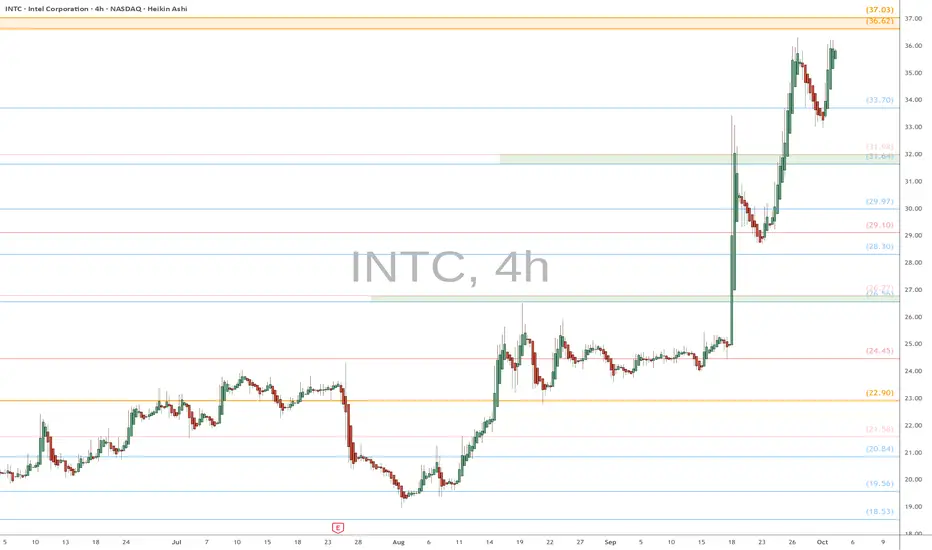
INTC heads up into $37: Double Golden zone likely to GRAB itINTC keeps getting "good" news after good news.
Now approaching a Double Golden Zone at $36.62-37.03
This should be a "Sticky" level stalling the wave for a bit.
.
Previous Analysis about another Goldden Genesis that caught the BOTTOM:
Hit BOOST and FOLLOW for more such PRECISE and TIMELY charts.
=========================================================
.
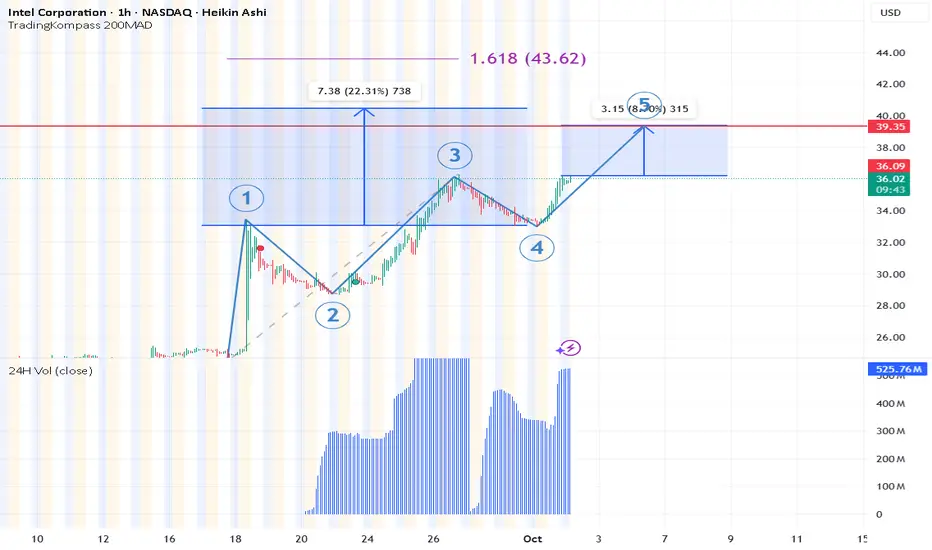
Wave 5We saw the beginning of wave 5 impulse wave.
Wave 1 and 3 are oft he same length aprox.
This means we should see a bigger wave 5
TP1 39,35$ (minimum extension)
TP2 161,8% fib extension to 43,62 $
Most likely we see tp2 very soon
Intel - The breakout happens now!💰Intel ( NASDAQ:INTC ) will break out quite soon:
🔎Analysis summary:
For the past two decades, Intel has overall been moving sideways. While we witnessed significant swings during this period of time, Intel recently retested another strong support area. If Intel now breaks the short term resistance, we will officially see the bottom formation.
📝Levels to watch:
$25
SwingTraderPhil
SwingTrading.Simplified. | Investing.Simplified. | #LONGTERMVISION

Intel (INTC) Shares Trade Around $30Intel (INTC) Shares Trade Around $30
In August, we noted that:
→ Intel (INTC) shares gained strong bullish momentum following reports that the US government was in talks to acquire a stake in the company;
→ the INTC chart was signalling that the depressed market, in place since 2021, was undergoing a fundamental shift in sentiment, with a potential rally foundation being formed.
Last month also brought the official announcement that Japanese conglomerate SoftBank Group would invest $2 billion in Intel. September, in turn, delivered further reasons for price gains:
→ On 18 September 2025, Nvidia officially announced a $5 billion investment in Intel and the launch of a multi-year strategic partnership. This came as a shock to the market: instead of competing, the two giants decided to join forces in developing new products. INTC shares gapped strongly higher, surpassing the psychological $30 mark for the first time this year.
→ More recently, Bloomberg reported that Apple is also considering investing in Intel. Although this remains at the level of speculation (with no official confirmation from either side), INTC shares rose by more than 6% yesterday.
Technical Analysis of INTC Shares
In earlier chart analysis, we highlighted the importance of the $20 level, which appeared to act as support from large players. This may have reflected confidence that the government would not allow a strategically important US company to be left behind in difficult times, particularly in the context of technological competition with China.
For many months, INTC shares had been in decline (shown by the red line). However, the price action in August–September has broken this pattern, confirming earlier assumptions. Higher lows and higher highs in 2025 have established an ascending channel (shown in blue), with key features as follows:
→ in early September, the price consolidated near the median, signalling a balance between supply and demand around $25;
→ September’s bullish news shifted the balance in favour of buyers, with INTC stock jumping towards the upper boundary of the channel.
From a bearish standpoint, potential obstacles to further growth include:
→ the psychological $30 level (which acted as support in May);
→ the upper boundary of the blue channel.
Although the market looks overbought, it is possible that:
→ buyers may refrain from taking profits in anticipation of longer-term gains;
→ and if positive rumours of further investment in Intel continue to be confirmed, this could drive an extension of the upward trend — potentially along a steeper trajectory (shown in orange).
This article represents the opinion of the Companies operating under the FXOpen brand only. It is not to be construed as an offer, solicitation, or recommendation with respect to products and services provided by the Companies operating under the FXOpen brand, nor is it to be considered financial advice.
INTC Intel Corporation Options Ahead of EarningsIf you haven`t bought INTC before the recent rally:
Now analyzing the options chain and the chart patterns of INTC Intel Corporation prior to the earnings report this week,
I would consider purchasing the 25usd strike price Calls with
an expiration date of 2026-1-16,
for a premium of approximately $1.83.
If these options prove to be profitable prior to the earnings release, I would sell at least half of them.

Intel Is Up 20%+ on the Nvidia Deal. What Does Its Chart Say?Struggling Intel NASDAQ:INTC had its best market session in nearly four decades the other day when Nvidia NASDAQ:NVDA unexpectedly announced plans to invest $5 billion in the company. Does INTC's chart show this is the start of an uptrend -- or just a short-term rebound?
Let's take a look:
Nvidia's Intel Deal
I'll admit I didn't see it coming when Nvidia and Intel announced a headline-making deal last Thursday to jointly develop PC and data-center-friendly chips.
As part of the agreement, Nvidia announced a $5 billion investment in Intel at $23.28 per share, pending regulatory approval.
Intel shot up as much as 30% intraday on the news -- its biggest one-day percentage gain in 38 years.
Nvidia gained 3.5% as well, while INTC rival Advanced Micro Devices NASDAQ:AMD briefly dropped 5.8% intraday. AMD competes directly with Intel for share in the PC/CPU business, while also providing the only real competition to Nvidia at the AI/data-center design level.
As for Intel, it's since given back some of last Thursday's big gains, but was trading Wednesday afternoon at about $30.80 a share. That's up some 23% since the Nvidia announcement, as well as 74.3% from the stock's $17.67 52-week low set on April 8.
Intel's Technical Analysis
Now let's take a look at INTC's chart going back some nine months and running through Thursday's close:
What readers will see here is a so-called "flat base" for the stock that ran for more than 12 months, with a $27.55 pivot.
Intel broke out of that in response to the Nvidia news, but investors have to be cognizant of the looming halfway-back point -- a 50% retracement of the stock's December 2023-April 2025 sell-off.
That spot, which stands at about $34.50, has potential to show resistance in the face of Intel's sudden surge.
Most Fibonacci retracement models include 50% retracements even though they're not actual Fibonacci levels. Twelfth-century Italian mathematician Leonardo Bonacci never included a 50% retracement level for his sequence.
However, that does not make them any less real. So, if the halfway-back point presents potential resistance for Intel, where does the stock's support level sit?
Potentially at the old flat base's upper trendline, which was Intel's old pivot of $27.55.
An Options Option
Options traders who want to get long on Intel, but not get picked off close to potential resistance often employ a simple buy-write strategy.
This is accomplished by buying INTC shares while also decreasing net basis by writing a call with a higher strike price.
Here's an example:
-- Buy 100 shares of INTC at about $32.
-- Sell (write) one INTC Oct. 24 $34 call for about $2.
Net Basis: $30.
A trader wanting to lower cost basis even more might consider one additional step. They could write a put with a strike price down around the stock's potential support level if the trader is willing to add to their long INTC position at that price:
-- Sell (write) one INTC Oct. 24 $27.50 put for roughly $0.85.
New Net Basis: $29.15.
(Moomoo Technologies Inc. Markets Commentator Stephen “Sarge” Guilfoyle had no position in INTC at the time of writing this column, but was long NVDA and AMD.)
This article discusses technical analysis, other approaches, including fundamental analysis, may offer very different views. The examples provided are for illustrative purposes only and are not intended to be reflective of the results you can expect to achieve. Specific security charts used are for illustrative purposes only and are not a recommendation, offer to sell, or a solicitation of an offer to buy any security. Past investment performance does not indicate or guarantee future success. Returns will vary, and all investments carry risks, including loss of principal. This content is also not a research report and is not intended to serve as the basis for any investment decision. The information contained in this article does not purport to be a complete description of the securities, markets, or developments referred to in this material. Moomoo and its affiliates make no representation or warranty as to the article's adequacy, completeness, accuracy or timeliness for any particular purpose of the above content. Furthermore, there is no guarantee that any statements, estimates, price targets, opinions or forecasts provided herein will prove to be correct.
Options trading is risky and not appropriate for everyone. Read the Options Disclosure Document ( j.moomoo.com ) before trading. Options are complex and you may quickly lose the entire investment. Supporting docs for any claims will be furnished upon request.
Options trading subject to eligibility requirements. Strategies available will depend on options level approved.
Moomoo is a financial information and trading app offered by Moomoo Technologies Inc. In the U.S., investment products and services on Moomoo are offered by Moomoo Financial Inc., Member FINRA/SIPC.
TradingView is an independent third party not affiliated with Moomoo Financial Inc., Moomoo Technologies Inc., or its affiliates. Moomoo Financial Inc. and its affiliates do not endorse, represent or warrant the completeness and accuracy of the data and information available on the TradingView platform and are not responsible for any services provided by the third-party platform.
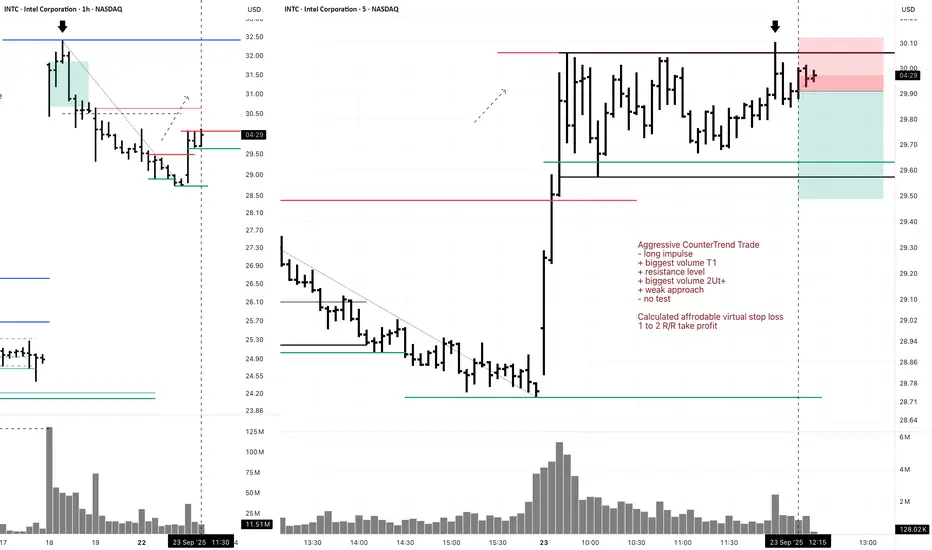
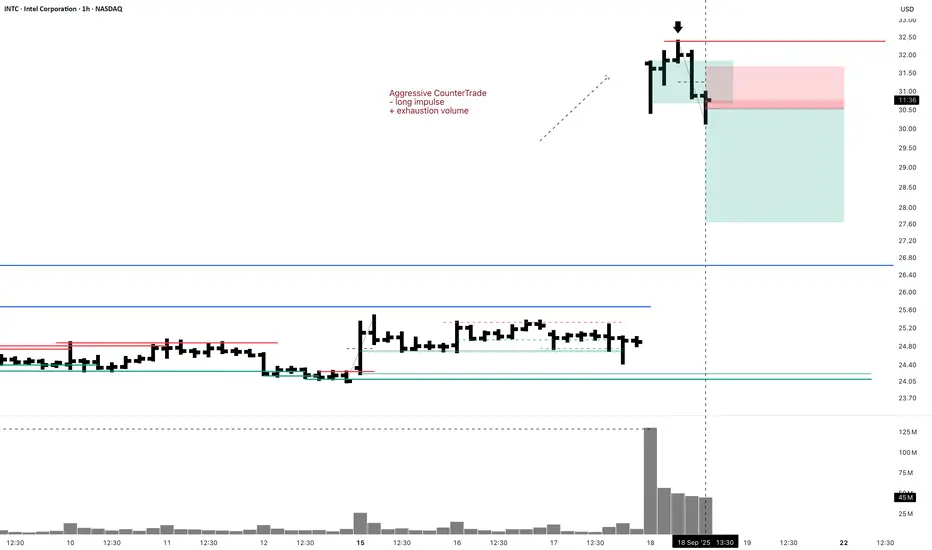
INTC Short 5M Aggressive CounterTrend Day TradeAggressive CounterTrend Trade
- long impulse
+ biggest volume T1
+ resistance level
+ biggest volume 2Ut+
+ weak approach
- no test
Calculated affordable virtual stop loss
1 to 2 R/R take profit
1H CounterTrend
"- long impulse
+ T1 level
+ resistance level
+ 1/2 correction?"
1D CounterTrend
";- long impulse
+ expanding CREEK / TE
+ exhaustion volume
- too high
+ correction to 1/2"
1M Trend
"+ short impulse
+ T2 level
+ resistance level
+ 1/2 correction"
1Y CounterTrend
"- long impulse
+ correction
- 1/2 of impulse
- biggest volume"
INTC: Break solid base and backtest to catch you!INTC:
Break solid base and backtest to catch you!
Confirmed smart money.
Backtest to validate supply and demand; low volume is considered ideal.
.
US STOCKS- WALL STREET DREAM- LET'S THE MARKET SPEAK!
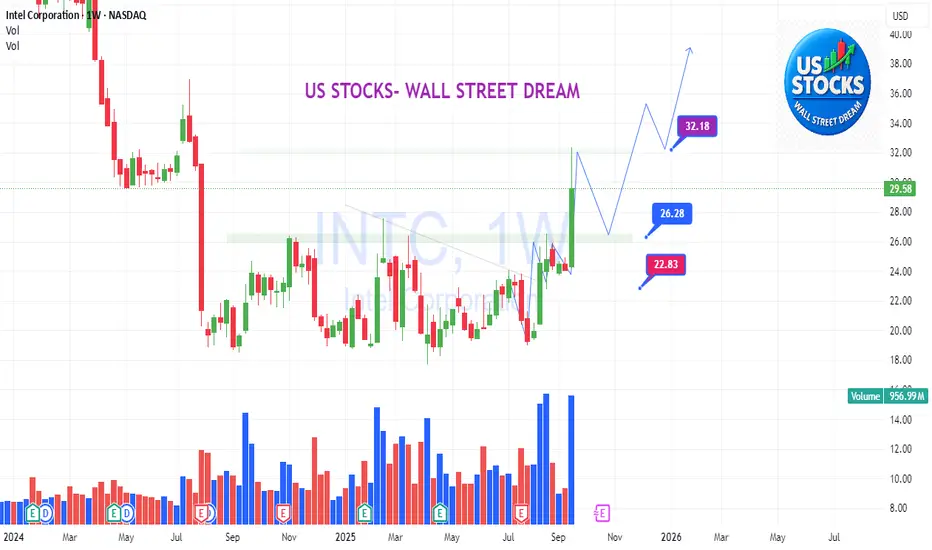
Mag 7 + Holding Companies + The RingLemme tell ya, Intel’s finally stretchin’ its legs. Don’t get me wrong — it’s been brutal watchin’ every other stock moon 30, 50, 100% while INTC’s been joggin’ like it’s late for the bus but don’t really care if it misses it. But listen, the DD’s done, the will’s strong, and right now the algos are just checkin’ if you’re packin’ Charmin hands or the full Buffett diamond grip.
Now, are half the Mag 7 gonna each toss five billy into Intel ’cause Uncle Sam gave ’em a wink? Fuhgeddaboudit. But if they did? Forget the pump, we’d need oxygen tanks at open.
Here’s the setup:
$29.50 bottom: Solid as Brooklyn concrete. Been tested since ’22, still holdin’.
$31.97 resistance: That’s the ceiling. Crack through it, and now we’re cookin’ with gas.
RSI reset around 60: That’s the coil windin’ up. You load that right, and bam — straight shot into $35–57.
Wildcard’s earnings. Gimme a GAAP EPS of 0.001 or better with a little happy talk about partners or foundry traction, and this thing rips +16–25% before the suits finish their bagels.
So yeah, I’m expectin’ a sideways shuffle into earnings, little RSI cool-off, then either a BOOM or a bust. (And c’mon, I’m prayin’ it’s the boom — nobody needs another bust in this city.)
And honestly? I wouldn’t even blink if the Don pumps this thing right back to $45–47, just like that election-time run last year. That’s a meme waitin’ to happen.
I can see it already.
Still sittin’ on a truckload of calls and a mountain of shares. Not movin’, not flinchin’.
Let’s ride this chip train 🚂💎✋

Intel + NVIDIA = Chip Avengers?This move from NVIDIA is giving me major déjà vu. It reminds me of 1997, when Apple shocked the world by teaming up with their “enemy,” Microsoft. Back then, Apple fans literally booed when Steve Jobs announced the deal on stage. Jobs had to calm everyone down and say, “We have to let go of this notion that for Apple to win, Microsoft has to lose.”
That $150M investment from Microsoft kept Apple alive long enough to reinvent itself, iMacs, iPods, iPhones the rest is history. Microsoft got what it wanted too: a healthy second platform to run Office and keep regulators happy. Two rivals, both winning.
Fast forward to now, NVIDIA investing in Intel feels just as weird at first glance, but strategically it’s brilliant. Intel has fabs all over the world. NVIDIA, for all its dominance in GPUs, still relies heavily on third-party fabs like TSMC. This stake is about more than money it’s about NVIDIA securing extra manufacturing capacity and reducing supply chain risk.
For Intel, this is huge. It puts them back in the conversation as a critical player in the AI arms race, not just a company that’s “fallen behind.” Investors now have a reason to see Intel as part of the solution, not part of the past.
Technically, the chart agrees. We’ve broken out of a multi-month range on massive volume, reclaimed VWAP, and opened up a clear path toward $33–34 (Target 1) and $36–38 (Target 2) over the next couple of quarters. A retest of $28 would be a gift for dip buyers as long as $26 holds, this breakout remains intact.
Bottom line: two rivals teaming up isn’t a sign of weakness, it’s a sign of strategic brilliance. Just like 1997, this could mark the start of Intel’s reinvention story.

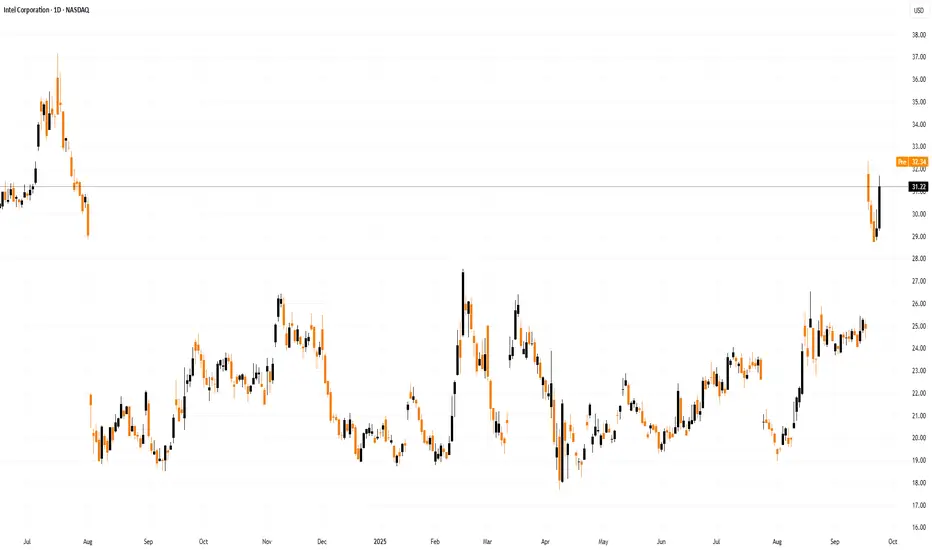
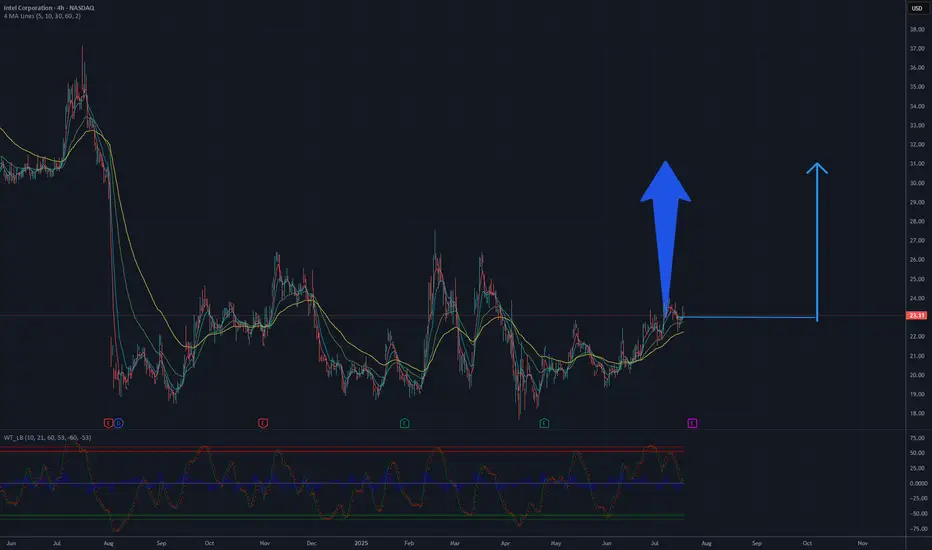
Is it a time for INTEL? 32 $ will be soon.The Intel Corporation (INTC) chart on NASDAQ illustrates the stock price dynamics from 2024 to July 2025. Initially, the price rose to a peak in the first half of 2024, followed by a significant decline, reaching its lowest point around 24 USD by the end of 2024. Since then, the price has been consolidating in the 24-26 USD range, which may signal preparation for a potential rebound.
The moving averages (MA) on the chart suggest a gradual convergence of lines, indicating a possible turning point. Oscillators at the bottom of the chart, such as RSI, may indicate oversold conditions, supporting the hypothesis of an upward move. The 26 USD level acts as a strong support, and breaking above 28-30 USD could pave the way to 34 USD, a previous resistance level.
A potential rise to 34 USD is plausible if the price maintains momentum and breaks through the resistance with sufficient volume.
Potential TP: 32 USD
INTEL CORPIntel Corporation (INTC)
Intel is a global technology leader based in Santa Clara, California, focusing on designing and manufacturing semiconductor chips and computer technologies. Founded in 1968, Intel plays a critical role in powering everyday computing across personal, enterprise, and data center applications. Key recent points about Intel in 2025 include:
Continuing restructuring with plans to cut around 24,000 jobs (~15% workforce) to save costs and improve profitability.
Strategic pivot towards AI and data-center products, strengthening its CPU offerings and expanding into AI infrastructure.
Notably, in September 2025, NVIDIA invested $5 billion in Intel, partnering to jointly develop AI infrastructure and integrated CPU-GPU platforms leveraging Intel’s x86 chips and NVIDIA’s AI acceleration technology.
Intel forecasts improved execution and operational efficiency, focusing on core products and AI roadmap innovation.
NVIDIA Corporation (NVDA)
NVIDIA, based in Santa Clara, California, is a dominant global player in GPUs (graphics processing units) and AI computing hardware. Established in 1993, NVIDIA pioneered GPU technology for gaming and has expanded into AI, machine learning, professional visualization, and automotive markets. Highlights in 2025:
Maintains ~92% market share in discrete GPUs for desktops and laptops.
Leading supplier of AI chips, powering over 75% of the world’s TOP500 supercomputers.
In July 2025, became the first company to surpass $4 trillion market capitalization.
Released advanced AI models and platforms, including large language models in 2025.
NVIDIA’s technology powers AI workloads for enterprise, consumer, and cloud markets.
Partners with Intel to co-develop data-center CPUs integrated with NVIDIA GPUs.
INTEL STOCKS TO THE MOON ....BUY IF HAVE MONEY TO RISK.
#AI #STOCKS #INTEL

Intel (INTC) BUYIntel (INTC), though struggling in recent years, is heavily investing in AI accelerators. If its turnaround is successful, Intel could re-emerge as a leader in the space.
Intel gets on radar after deal with NVDAIntel gets in play.
The deal announced with Nvidia had pushed the price higher substantially, for more than 3 values of daily volatility (measured in ATR). We can expect the momentum to go higher.
The move is happening in the context of Q2 results where revenue exceeded expectations, alongside management’s focus on cost cutting, asset sales, and streamlined operations. Investors were encouraged by Intel’s progress in repositioning toward higher-growth segments such as foundry services and AI, helping shift sentiment away from near-term EPS pressure toward long-term competitiveness.
Don't forget - this is just the idea, do your own reserch and never forget to manage your risk.
INTC Short Swing 1H Aggressive CounterTradeAggressive CounterTrade
- long impulse
+ exhaustion volume
Daily CounterTrend
"- long impulse
+ expanding CREEK level
+ exhaustion volume
+ too high"
Monthly Trend
"+ short impulse
+ T2 level
+ resistance level
+ 1/2 correction"
Yearly Trend
"- long impulse
+ correction
- 1/2 of impulse
- biggest volume"
Intel | INTC | Long at $20This is going to be purely about technical analysis since Intel NASDAQ:INTC has a 90x P/E and has not proven themselves to be a viable challenger in the semiconductor market (yet...). Bad news could continue to destroy this ticker, but without that news, there could be some recovery in the near term.
The NASDAQ:INTC chart is in an overall downward trend. However, based on a few of my selected simply moving averages (SMAs), there is some predictability around support/resistance areas. Some of my favorite setups are a nice bounce on the lowest (green) selected SMA, occurring in October 2022 for a "rip then dip" to the second lowest (blue) - which it hit now. Often, but not always (I can't stress this enough), this green to blue SMA bounce represents a very strong support area during a downward trend. The other move is a further dip to retest the green SMA, but I suspect that would come with tremendously bad news for Intel... let's hope not, though.
Currently, NASDAQ:INTC is in a personal buy zone at $20.00 based on technical analysis only. A stop has been set if it drops below the blue SMA (which is may further test).
Target #1 = $28.00
Target #2 = $32.00
Target #3 = $60.00+ (very long-term, but high-risk unless fundamentals change)

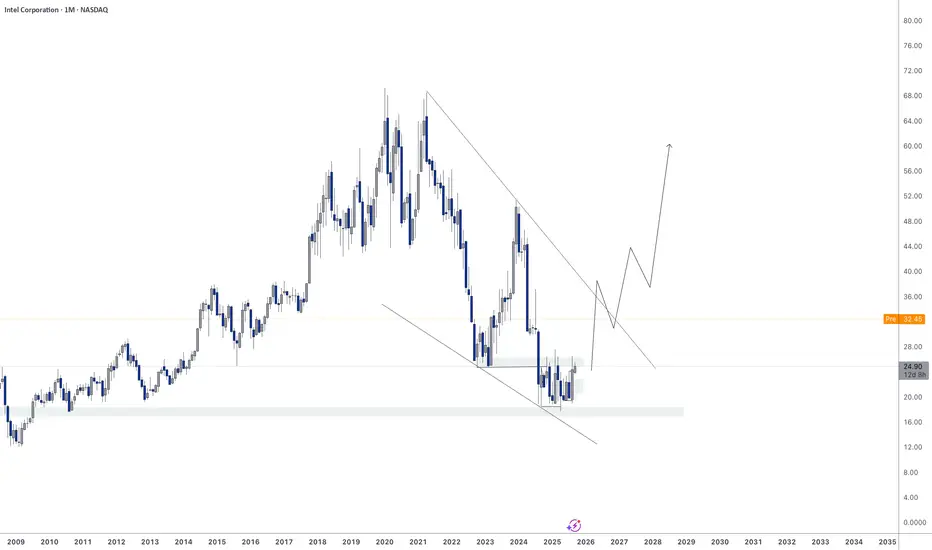
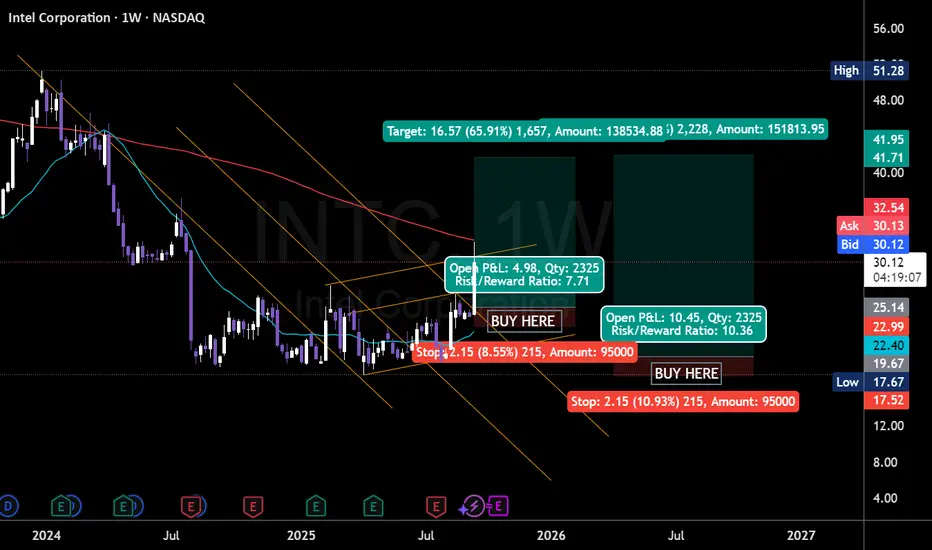
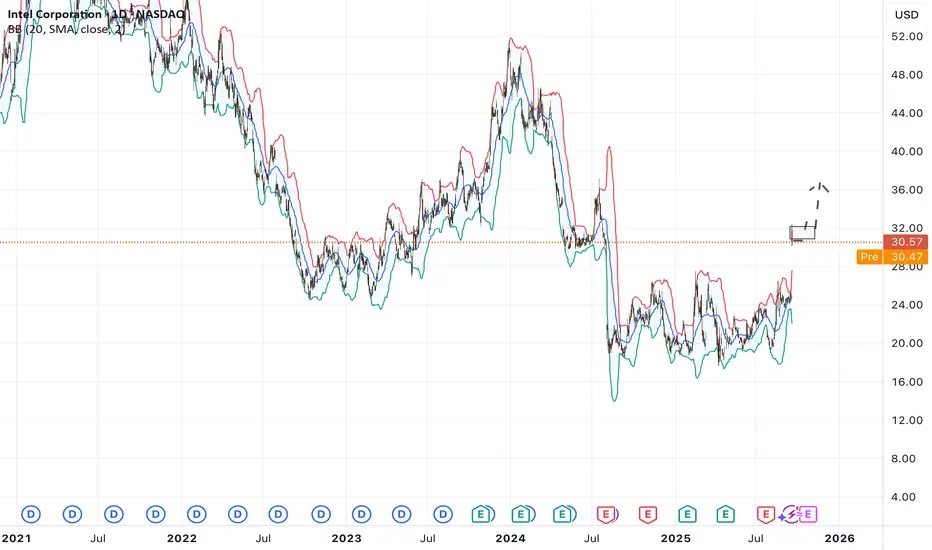
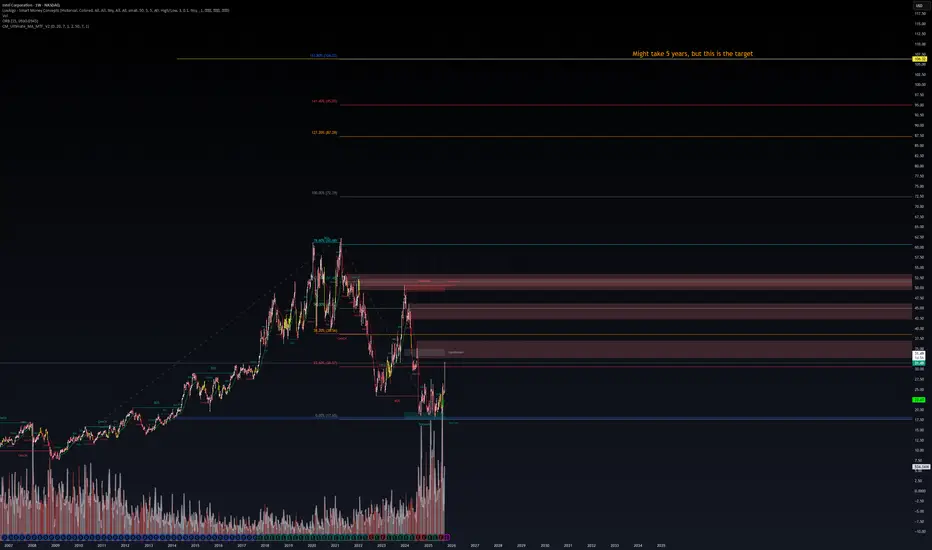
INTC Weekly – Long-Term Accumulation with 5-Year TargetINTC Weekly – Long-Term Accumulation with 5-Year Target
Intel (INTC) has been through a major downtrend since its 2021 peak, but the weekly chart suggests we may have found a structural bottom.
🔑 Key Levels
Support Zone: $27 (recent bottom), $23 major long-term floor.
Resistance: $40–42 (key breakout zone).
Upside Targets (Fibonacci Extensions):
$52–55 → prior supply zone.
$72 → full retracement of 2021 highs.
$87–90 → 127% extension.
$105–110 → 161% extension.
$119 → ultimate 5-year target.
📊 Technical Notes
Price bounced strongly from the 0.786 retracement near $27 with heavy accumulation volume.
Breakout above $40 could confirm a long-term reversal.
Risk remains if support at $27 fails → next major level is $23.
🎯 Outlook
This might take years, but the long-term structure favors accumulation. INTC is positioning to benefit from AI, chip manufacturing expansion, and U.S. semiconductor subsidies.
Bias: Accumulation in the $27–32 range, with long-term targets $72 → $119.
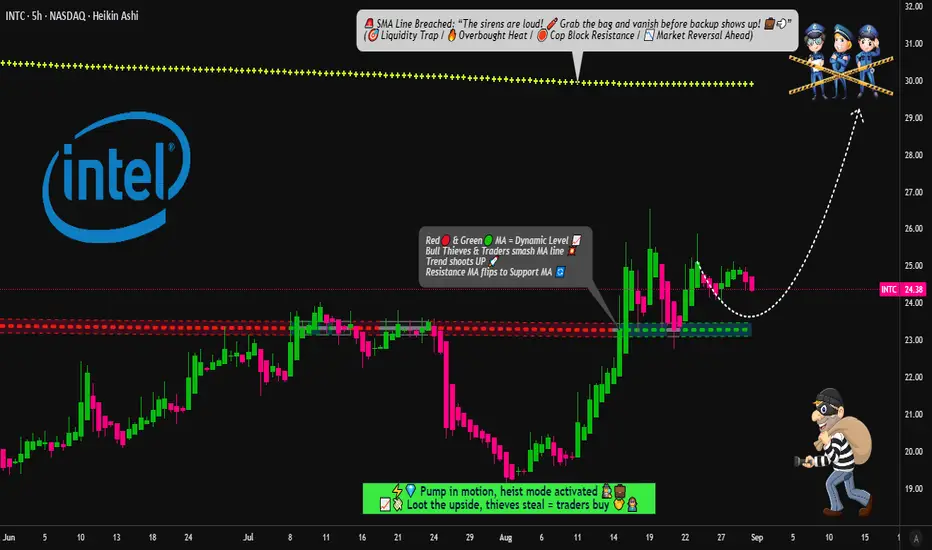
INTEL Heist Playbook: Buy the Dips, Escape Before the Sirens🔓💻 INTEL CORPORATION "Chip Heist" Stock Raid 💻🔓
🎯 Plan: Bullish Robbery | Targeting $30.00 | Stop Loss: $21.00
💰 Layered Limit Entries | Silicon Valley Loot | Calculated Takedown
🚨⚠️ Attention TRADERS, Tech Pirates & Market Mercenaries! ⚠️🚨
The INTC data vault is cracked, and the Thief Trader squad is executing a multi-layer LIMIT ENTRY HEIST – stacking shares like we're loading the getaway van. 🚐💾⚡
👀 We ain't chasing price – we're ambushing it with precision. Every discount? A planned acquisition.
💥 ENTRY: Any Price Level is a Gift 💥
"Bullish on Silicon" – we're collecting shares on any dip into value town!
Deploy buy limits at key psychological support layers: $25.00, $24.00, $23.00 (Add more layers based on your own capital).
Thief-style: We don't buy the hype; we steal the undervalued chips.
🛑 STOP LOSS: This is a Thief SL @ $21.00 🔐
Dear Ladies & Gentleman (Thief OG's), this is set at the breakdown panic zone – where the weak hands get shaken out.
Adjust your final SL based on your own risk appetite and strategy. Size wisely.
🎯 TARGET: $30.00 💸
The police barricade is there, so kindly escape with your stolen money before arrival.
We're targeting the next major resistance vault. Take profits and live to trade another day.
🧠 Swing Traders? Load the boat. Day Traders? Snatch the quick flips. Investors? Stack and hold. 💵☕
Use a trailing stop loss to protect your capital as the trend accelerates.
🕵️♂️ THIEF TRADER INSIGHTS:
📊 Backed by tech sector momentum, oversold bounces, and order block analysis.
🗞️ Earnings? Chip news? = increased volatility = adjust your layers accordingly.
⚠️ HEIST PROTOCOL:
✅ Avoid over-leveraging – this is a layering strategy, not a casino bet. 📉
✅ Use risk-adjusted position sizing on every limit order.
✅ Discipline is key. The market will deliver the discounts; you just need to be patient.
❤️🔥 Hit that 💥 LIKE & FOLLOW 💥 if you're riding with the Thief Squad!
Support the strategy. Respect the plan. Stack your gains like a true Market Outlaw.
🔔 Follow for the next HEIST. Big bags only. 💼🚀📈
“The market is a river of money—flowing from the impatient to the patient.” – Thief Trader
#INTC #Intel #StocksToWatch #TradingPlan #SwingTrading #StockMarket #Investing #LayeredEntries #ThiefTrader #ChipHeist
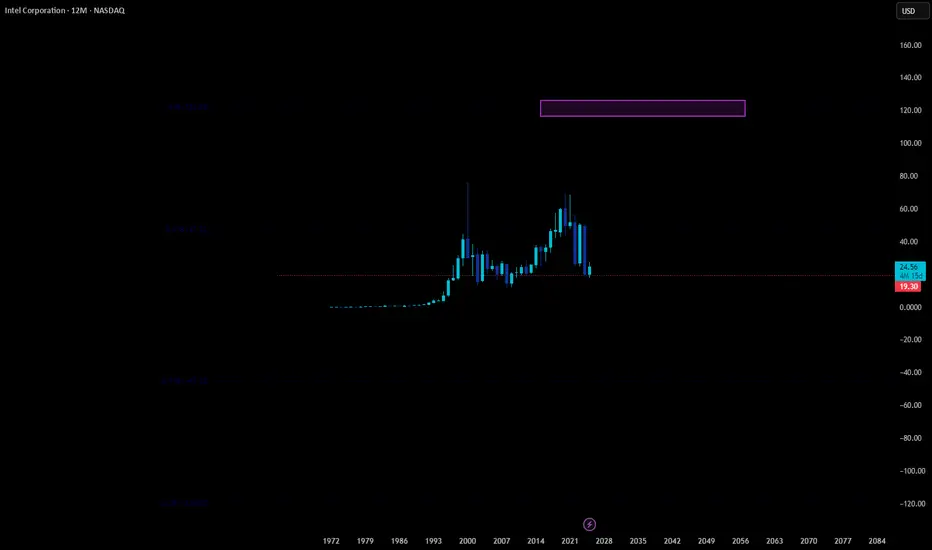
$120 Intel in the next few yearsI bought intel 20 minutes before the news a couple days ago. Very lucky timing! But I dont plan on selling until we hit $120. $40 is tested. Could see some downward pressure before we see trend reverse.
Intel INTC: Bullish Falling Wedge, Growth CatalystsNow is a great time to consider investing in Intel due to its strong fundamentals and positive industry catalysts. The company is benefiting from a major $5 billion investment by Nvidia and is ramping up significant U.S.-based manufacturing expansion backed by government support. Management’s turnaround efforts have improved financial stability, positioning Intel for potential strong earnings growth and stock price appreciation. Technically, Intel’s stock is forming a classic falling wedge pattern on the monthly chart, which often signals a bullish breakout ahead. This combination of solid fundamentals and constructive technicals makes Intel a compelling opportunity right now. Not financial advice (NFA).