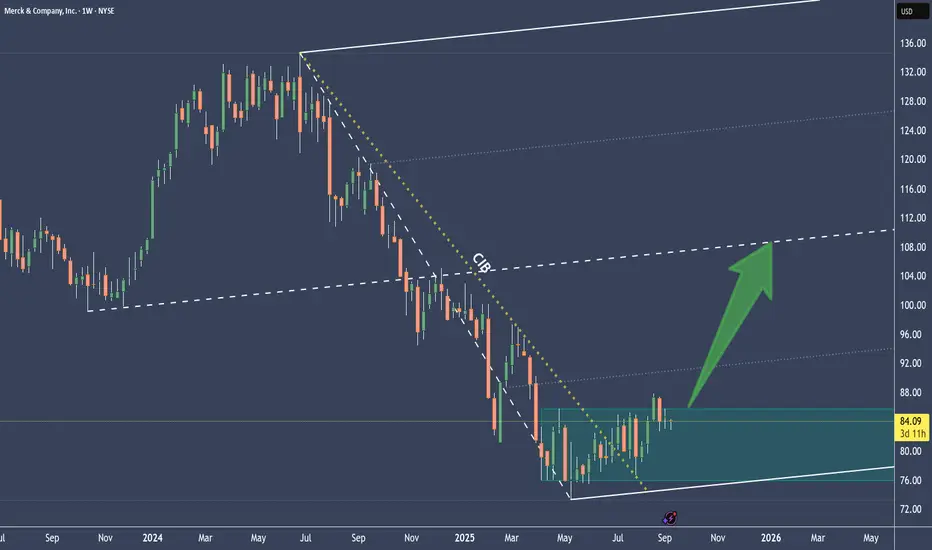
MRK is showing some breakout signsThe white fork is pointing slightly to the upside.
CIB is broken and signals a change in behavior. The pullback to it was very nice - a Eye twinkle? §8-)
Then price opened the door to the upside by peeking through the resistance of the consolidation, asking: "Anybody here to buy me?"...silence...
Key facts today
Next report date
—
Report period
—
EPS estimate
—
Revenue estimate
—
6,084 CLP
17.08 T CLP
63.85 T CLP
2.50 B
About Merck & Company, Inc.
Sector
Industry
CEO
Robert M. Davis
Website
Headquarters
Rahway
Founded
1891
ISIN
US58933Y1055
FIGI
BBG00YFSTJK2
Merck & Co., Inc. is a health care company, which engages in the provision of health solutions through its prescription medicines, vaccines, biologic therapies, animal health, and consumer care products. It operates through the following segments: Pharmaceutical, Animal Health, and Other. The Pharmaceutical segment includes human health pharmaceutical and vaccine products. The Animal Health segment discovers, develops, manufactures, and markets animal health products, such as pharmaceutical and vaccine products, for the prevention, treatment and control of disease in livestock, and companion animal species. The Other segment consists of sales for the non-reportable segments of healthcare services. The company was founded in 1891 and is headquartered in Rahway, NJ.
Related stocks
MRkStock: Merck & Company (MRK) – NYSE
Timeframe: 1H (short–to–mid term outlook)
Current Situation
The stock is trading around 85.16 – 85.33.
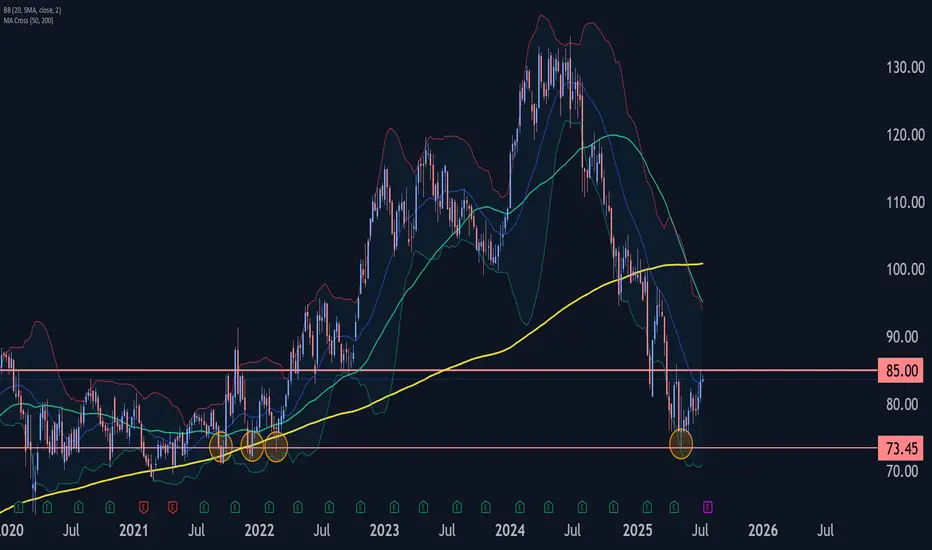
It has broken out of a long descending channel (yellow zone), signaling a potential trend reversal to the upside.
Suggested entry on the chart: Buy at 84.80

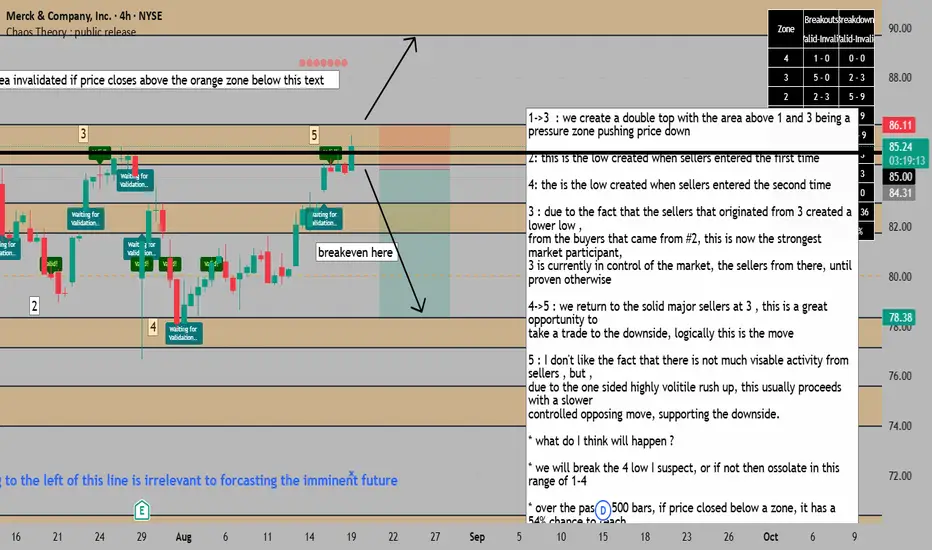
double top includes a solid major high as second top=SELL1->3 : we create a double top with the area above 1 and 3 being a
pressure zone pushing price down
2: this is the low created when sellers entered the first time
4: the is the low created when sellers entered the second time
3 : due to the fact that the sellers that originated from 3 created
Is Merck Ready for a Rebound?Fundamental Analysis
Financial Performance
Revenue Decline: Q2 revenue fell 2% year-over-year to $15.8 billion.
Earnings Drop: Adjusted earnings per share decreased by 7% to $2.13.
Key Product Challenges
Keytruda Competition: Facing increased competition for its top cancer drug, Keyt
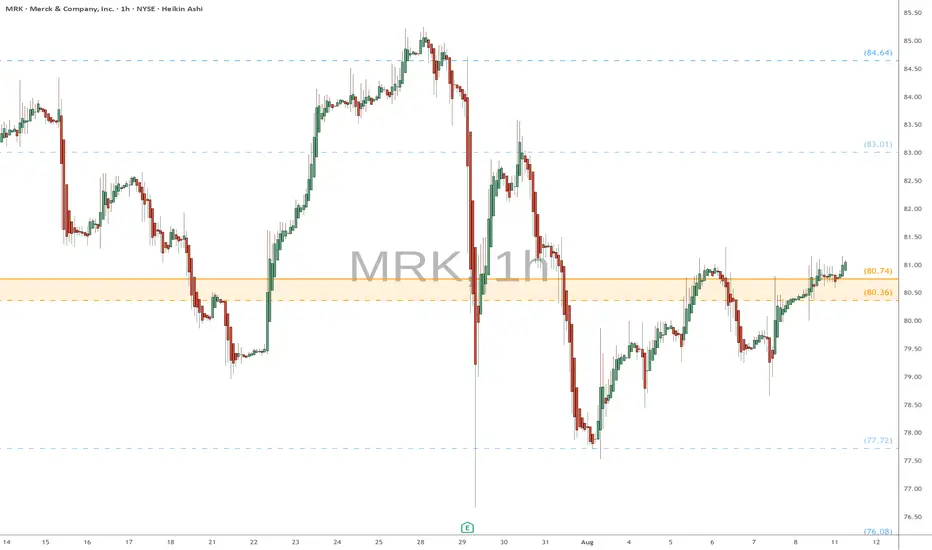
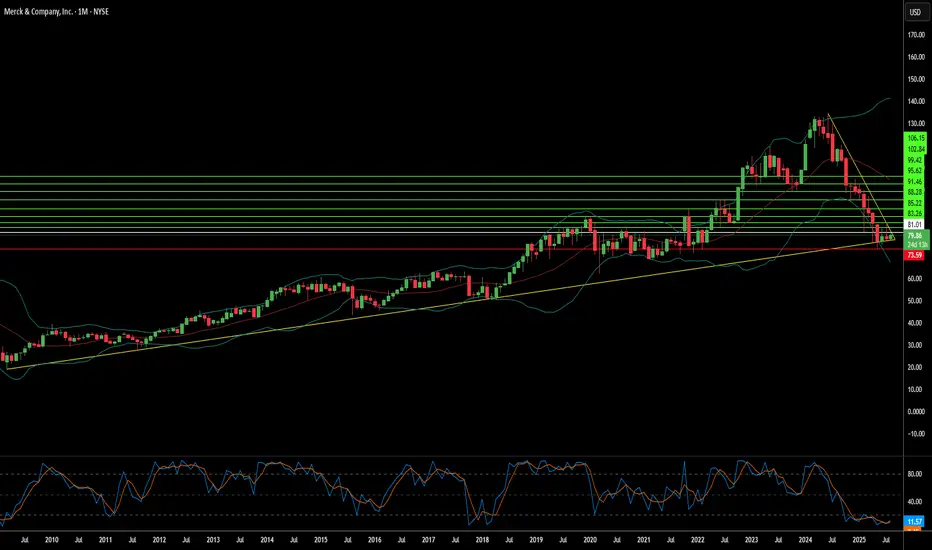
MRK eyes on $80.36/74: Double Golden zone could mark the bottomPharma has been struggling with Trump's tariff threats.
This one is orbiting a Double Golden zone at $80.36-80.74
Looking for a clean Break-n-Retest for possible long entries.
Can Global Chaos Fuel Pharmaceutical Giants?Merck's remarkable growth trajectory demonstrates how a pharmaceutical leader can transform global uncertainties into strategic advantages. The company has masterfully navigated geopolitical tensions, including US-China trade disputes, by diversifying supply chains and establishing regionalized manu
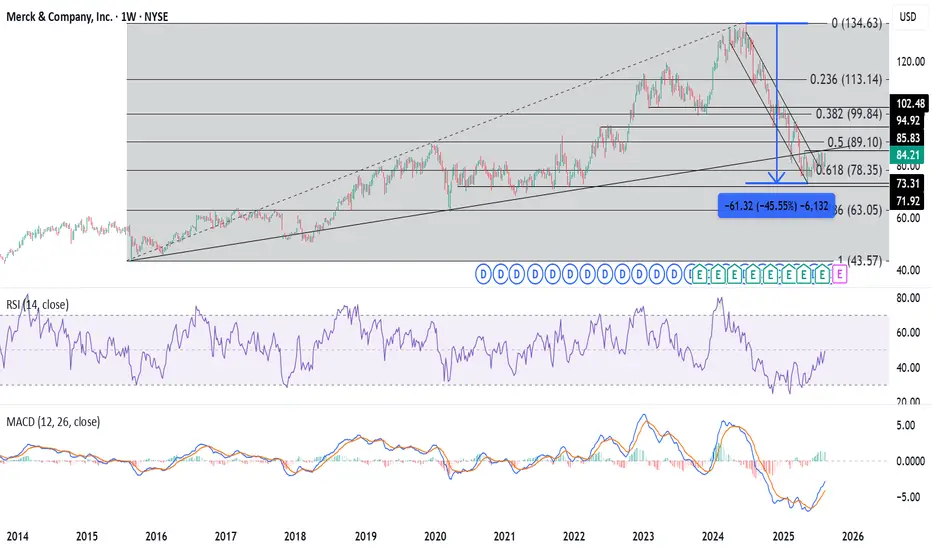
MRK potentially enters the Wyckoff accumulation phase this week.The weekly chart points strongly towards a stock emerging from a prolonged Markdown Phase and potentially entering Accumulation (Phase C), with signs of strength appearing.
Merck is basically yelling 'buy me' across all timeframes, so I'm jumping into a long call

MRK eyes on $80.36/74: Double Golden zone break to end DownTrendMRK and all pharma has been dropping forever.
Just pierced the Double Golden zone yet again.
Break and Hold of this zone will say "bottom".
.

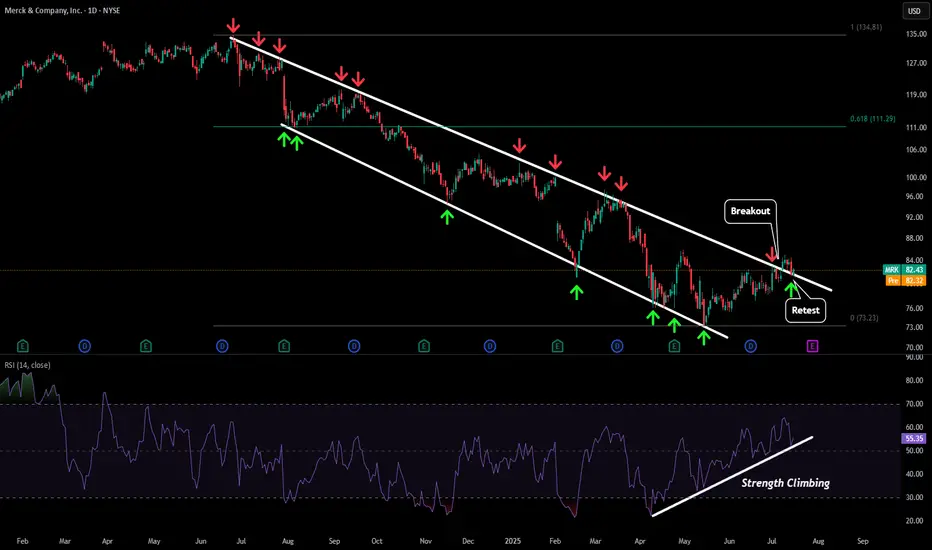
MRK - Retesting BreakoutAfter being in a downtrend for almost a year things finally look like they are starting to turn around for MRK.
Recently price broke the downwards sloping resistance and has retested that level as a new support level. We have also seen strength increasing on our daily RSI bringing some life back i
MRK Wave Analysis – 14 July 2025- MRK reversed from the support zone
- Likely to rise to resistance level 85.00
MRK recently reversed up from the support zone surrounding the long-term support level 73.45 (which has been reversing the price from the start of 2020, as can be seen from the weekly MRK chart below).
The upward rever
See all ideas
Summarizing what the indicators are suggesting.
Neutral
SellBuy
Strong sellStrong buy
Strong sellSellNeutralBuyStrong buy
Neutral
SellBuy
Strong sellStrong buy
Strong sellSellNeutralBuyStrong buy
Neutral
SellBuy
Strong sellStrong buy
Strong sellSellNeutralBuyStrong buy
An aggregate view of professional's ratings.
Neutral
SellBuy
Strong sellStrong buy
Strong sellSellNeutralBuyStrong buy
Neutral
SellBuy
Strong sellStrong buy
Strong sellSellNeutralBuyStrong buy
Neutral
SellBuy
Strong sellStrong buy
Strong sellSellNeutralBuyStrong buy
Displays a symbol's price movements over previous years to identify recurring trends.
MRK3671638
Schering-Plough Corporation 6.55% 15-SEP-2037Yield to maturity
—
Maturity date
Sep 15, 2037
MRK6166087
Merck & Co., Inc. 5.7% 15-SEP-2055Yield to maturity
—
Maturity date
Sep 15, 2055
MRK3900816
Merck & Co., Inc. 3.6% 15-SEP-2042Yield to maturity
—
Maturity date
Sep 15, 2042
MRK6165795
Merck & Co., Inc. FRN 15-SEP-2027Yield to maturity
—
Maturity date
Sep 15, 2027
MRK.GF
Merck & Co., Inc. 5.76% 03-MAY-2037Yield to maturity
—
Maturity date
May 3, 2037
MRK5002722
Merck & Co., Inc. 1.45% 24-JUN-2030Yield to maturity
—
Maturity date
Jun 24, 2030
MRK.GA
Merck & Co., Inc. 6.3% 01-JAN-2026Yield to maturity
—
Maturity date
Jan 1, 2026
MRK5002693
Merck & Co., Inc. 2.45% 24-JUN-2050Yield to maturity
—
Maturity date
Jun 24, 2050
MRK6165794
Merck & Co., Inc. 3.85% 15-SEP-2027Yield to maturity
—
Maturity date
Sep 15, 2027
MRK4806277
Merck & Co., Inc. 3.4% 07-MAR-2029Yield to maturity
—
Maturity date
Mar 7, 2029
MRK5584756
Merck & Co., Inc. 5.15% 17-MAY-2063Yield to maturity
—
Maturity date
May 17, 2063
See all MRKCL bonds
Curated watchlists where MRKCL is featured.


Frequently Asked Questions
The current price of MRKCL is 76,219 CLP — it hasn't changed in the past 24 hours. Watch Merck & Co., Inc. stock price performance more closely on the chart.
Depending on the exchange, the stock ticker may vary. For instance, on BCS exchange Merck & Co., Inc. stocks are traded under the ticker MRKCL.
MRKCL stock has fallen by −2.20% compared to the previous week, the month change is a −2.20% fall, over the last year Merck & Co., Inc. has showed a −32.79% decrease.
We've gathered analysts' opinions on Merck & Co., Inc. future price: according to them, MRKCL price has a max estimate of 136,760.43 CLP and a min estimate of 79,534.43 CLP. Watch MRKCL chart and read a more detailed Merck & Co., Inc. stock forecast: see what analysts think of Merck & Co., Inc. and suggest that you do with its stocks.
MRKCL reached its all-time high on Mar 28, 2024 with the price of 130,550 CLP, and its all-time low was 53,962 CLP and was reached on May 4, 2021. View more price dynamics on MRKCL chart.
See other stocks reaching their highest and lowest prices.
See other stocks reaching their highest and lowest prices.
MRKCL stock is 7.63% volatile and has beta coefficient of 0.46. Track Merck & Co., Inc. stock price on the chart and check out the list of the most volatile stocks — is Merck & Co., Inc. there?
Today Merck & Co., Inc. has the market capitalization of 205.49 T, it has decreased by −0.82% over the last week.
Yes, you can track Merck & Co., Inc. financials in yearly and quarterly reports right on TradingView.
Merck & Co., Inc. is going to release the next earnings report on Oct 30, 2025. Keep track of upcoming events with our Earnings Calendar.
MRKCL earnings for the last quarter are 1.99 K CLP per share, whereas the estimation was 1.90 K CLP resulting in a 4.77% surprise. The estimated earnings for the next quarter are 2.29 K CLP per share. See more details about Merck & Co., Inc. earnings.
Merck & Co., Inc. revenue for the last quarter amounts to 14.79 T CLP, despite the estimated figure of 14.84 T CLP. In the next quarter, revenue is expected to reach 16.45 T CLP.
MRKCL net income for the last quarter is 4.14 T CLP, while the quarter before that showed 4.84 T CLP of net income which accounts for −14.47% change. Track more Merck & Co., Inc. financial stats to get the full picture.
Yes, MRKCL dividends are paid quarterly. The last dividend per share was 761.28 CLP. As of today, Dividend Yield (TTM)% is 3.76%. Tracking Merck & Co., Inc. dividends might help you take more informed decisions.
Merck & Co., Inc. dividend yield was 3.14% in 2024, and payout ratio reached 46.32%. The year before the numbers were 2.72% and 2.07 K% correspondingly. See high-dividend stocks and find more opportunities for your portfolio.
As of Sep 13, 2025, the company has 75 K employees. See our rating of the largest employees — is Merck & Co., Inc. on this list?
EBITDA measures a company's operating performance, its growth signifies an improvement in the efficiency of a company. Merck & Co., Inc. EBITDA is 25.04 T CLP, and current EBITDA margin is 39.30%. See more stats in Merck & Co., Inc. financial statements.
Like other stocks, MRKCL shares are traded on stock exchanges, e.g. Nasdaq, Nyse, Euronext, and the easiest way to buy them is through an online stock broker. To do this, you need to open an account and follow a broker's procedures, then start trading. You can trade Merck & Co., Inc. stock right from TradingView charts — choose your broker and connect to your account.
Investing in stocks requires a comprehensive research: you should carefully study all the available data, e.g. company's financials, related news, and its technical analysis. So Merck & Co., Inc. technincal analysis shows the sell today, and its 1 week rating is sell. Since market conditions are prone to changes, it's worth looking a bit further into the future — according to the 1 month rating Merck & Co., Inc. stock shows the sell signal. See more of Merck & Co., Inc. technicals for a more comprehensive analysis.
If you're still not sure, try looking for inspiration in our curated watchlists.
If you're still not sure, try looking for inspiration in our curated watchlists.