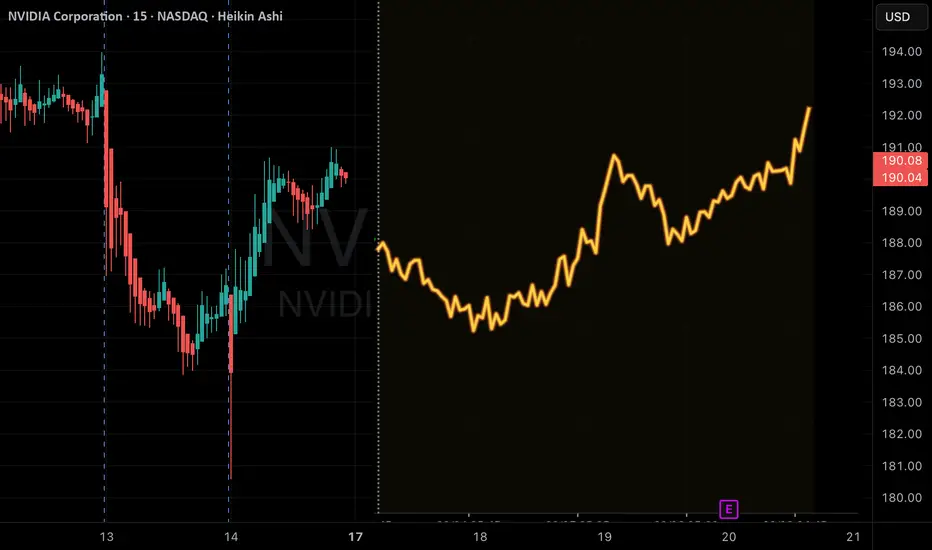
Nvidia (NVDA) Price Action Statistics Around EarningsWith Nvidia set to release earnings after the US close on Wednesday, I take a look at recent price action around past reports, the Nvidia chart and the Nasdaq.
Matt Simpson, Market Analyst at City Index.
Trade ideas

NVDA earnings thsi week - will that be catalyst for a move?Its been another few months of great bullish moves on NVDA, however the last couple of weeks have been choppy. We rejected the $200 level and now find ourselves sat above $180 and the Weekly 20MA.
If the numbers are good then I'm sure the giddiness will take us higher. If the numbers are poor the you have to ask will $180 and the Weekly 20MA act as support, or will they collapse? If they do, what will happen to tech and US markets in general? It means that its going to be an interesting week!

NVIDIA – Best Buy of the Decade (4T Record but now resistance)🚀🔥 NVIDIA – Best Buy of the Decade Post #6
💡📉 Great but why am I taking half profits Today?
Back in July 2021, I named NVIDIA "The Best Buy of the Decade. " Today, it just hit a mind-blowing milestone — becoming the first company to reach a $4 trillion market cap. But here's the thing... that happened right at major resistance.
From our initial call in 2021 , to the target at $143.85 drawn via parabola in 2023, to the April 2025 re-entry at $95, it’s all on the chart — and it's been a textbook ride so far.
At the current level of $163.89, we’re pressing into serious overhead resistance. This doesn’t mean the story is over — not even close. But it could mean we take a breather before the next leg higher.
🧭 Targets ahead remain unchanged:
🔹 First stop: $182.85
🔹 Long-term vision: $227.41
What started as a bold macro call in 2021 has now become a multi-year thesis with precision updates along the way. This is post #6 in the NVIDIA journey — and if you scroll back through the chart, each piece has built on the last with clarity and conviction.
🎯 NVIDIA is not just a tech stock — it’s the AI backbone. But every cycle has pauses, and this one looks ready for a short rest before we see the next breakout.
Stay sharp, follow the structure, and honor the parabola.
One Love,
The FX PROFESSOR 💙
Additional info, for those who like to dive deeper into NVDA:
🔍 Technical Breakdown Version
For the chartists and structure followers, here’s the breakdown:
📌 2021: Original call — "Best Buy of the Decade"
📌 2023: First parabola plotted, projecting toward $143.85 — target hit precisely
📌 April 2025: Market offered $95 re-entry — second parabola begins
📌 Now: Price sits at $163.89, testing resistance from both structure and Fibonacci
📌 Next levels:
- $182.85 → Key extension level
- $227.41 → Long-term target based on full parabolic arc
Current structure suggests a possible pause before continuation. No need for panic — parabola remains valid unless structure is broken. Volume still supportive, and price action is following projection beautifully.
🧠 AI Macro Narrative Version
The big picture? NVIDIA isn't just another semi stock — it’s the nervous system of the AI revolution.
From gaming → crypto → AI, NVIDIA has consistently been first to adapt, and now it’s the leader in AI hardware infrastructure. The $4 trillion milestone is more than symbolic — it represents capital reallocation toward AI as the next dominant sector.
🧠 Key macro takeaways:
AI demand is insatiable
Data centers need NVIDIA
Generative AI isn't slowing down
Institutions are still buying — not selling
The resistance we see now isn’t weakness — it’s the market pausing to digest before another acceleration. Just like every past cycle... we ride, retrace, reload, and resume.
Disclosure: I am happy to be part of the Trade Nation's Influencer program and receive a monthly fee for using their TradingView charts in my analysis. Awesome broker, where the trader really comes first! 🌟🤝📈

Is SoftBank selling NVIDIA worrying you?Softbank has announced that it has pocketed all returns from their investment in NASDAQ:NVDA . I do not think this should concern anyone as it is logical to bank profits after a point where you want to redistribute cash. I do believe NVIDIA needs to take a small breath and might dip to $160 - $170 (near the gap it has created/ 1 x A Fib extension levels), as this will create some downward pressure to the already existing overvaluations. However, I think this is a setup to an amazing end of year rally.

NVDA Earnings Breakout Setup — QuantSignals V3 | Bullish CallNVDA QuantSignals V3 Earnings 2025-11-18
Instrument: NVDA
Date: 2025-11-18
Signal Type: Earnings (Pre-Earnings Position)
Model: QuantSignals V3
Direction: Calls
Confidence: 65%
Conviction: Medium
Earnings Date: 2025-11-19
Earnings Estimate: $1.27
Expiry: 2025-11-21
Options Setup
Strike Focus: $185.00
Entry Range: $6.45 – $6.55
Implied Move: $14.15 (7.7%)
Profit Target: $13.00
Stop Loss: $3.25
IV: 106.5% (elevated due to earnings)
PCR (Flow Intel): 0.37 (bullish)
24h Move: –1.91%
Price & Technicals
Current Price: $183.79
Katy Prediction Target: $184.60 (+0.44%)
Trend Classification: Neutral (50% confidence)
RSI: 31.3 (near oversold)
MACD: +2.17
Momentum (ROC): –7.42%
Support: $179.65
Resistance: $187.55
AI Forecast (Katy Model)
• Time-series predicts steady upward movement
• Range projection: $183.79 → $184.80 (+0.55%)
• Confidence moderate, trajectory shows bullish bias despite neutral label
Fundamental & News Notes
• Strong historical earnings performance (100% beat rate)
• Mixed news sentiment but leaning optimistic
• Nvidia positioned as key market driver for earnings week
• Pre-earnings selling pressure suggests potential reversal
Risk Notes
• Moderate risk due to high implied volatility
• Earnings event introduces binary outcome
• Premiums elevated; smaller sizing recommended
• Monitoring pre-market on 11/19 essential
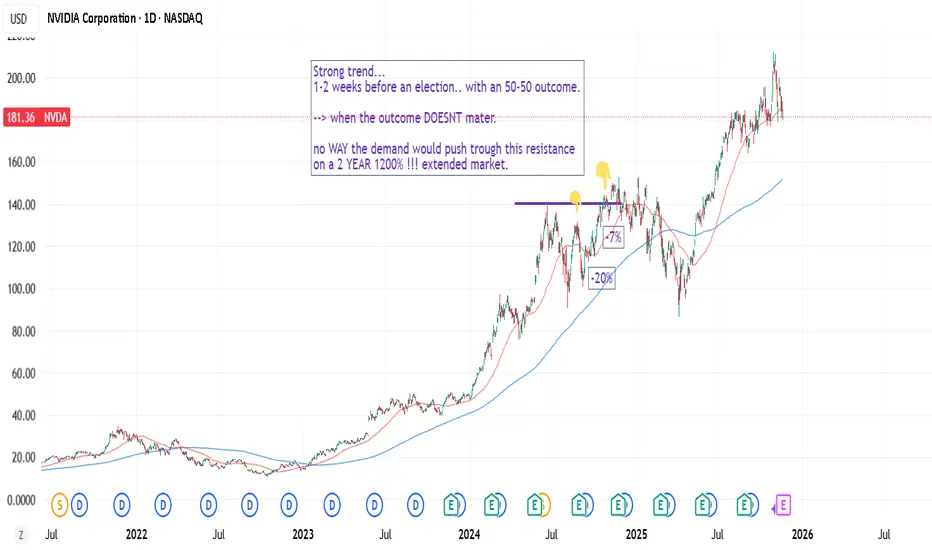
Markets are predictable. Trading S/D imbalances.Pre-election. 1200% extension after a 2-year rally. Facing ATH with strong trend and expectations.
This is a rule or factorial based approach. What most people think - is usually how most people are positioned, or usually also is the logical truth.
When something extends... and some risks emerge -- you can't really trust charts (ie demand strength). that's a prejudgement? ie sloppy way to look at things.
Also somewhat predictable is the 2 year rally, 3rd year weakness. If markets stall -- markets sells off on expectations of that "rule" lol
$NVDANASDAQ:NVDA reports earnings next week, but I feel the hype is slowing down.
The only catalysts that could keep them strong are deeper ties with Israel’s defense systems and the new military tech initiatives they’re trying to build.
But even with that, the price needs a balance point.
NVDA is too extended it needs a healthy correction before the next leg.

Nvidia - Squeezing every single bear!🧯NVidia ( NASDAQ:NVDA ) is finally breaking out:
🔎Analysis summary:
Over the course of the past couple of months, Nvidia has been rallying +125%. Considering the market cap of Nvidia, this is already an insane move but clearly not the end. We can still see another +25% from here, before Nvidia will then retest the next resistance.
📝Levels to watch:
$250
SwingTraderPhil
SwingTrading.Simplified. | Investing.Simplified. | #LONGTERMVISION

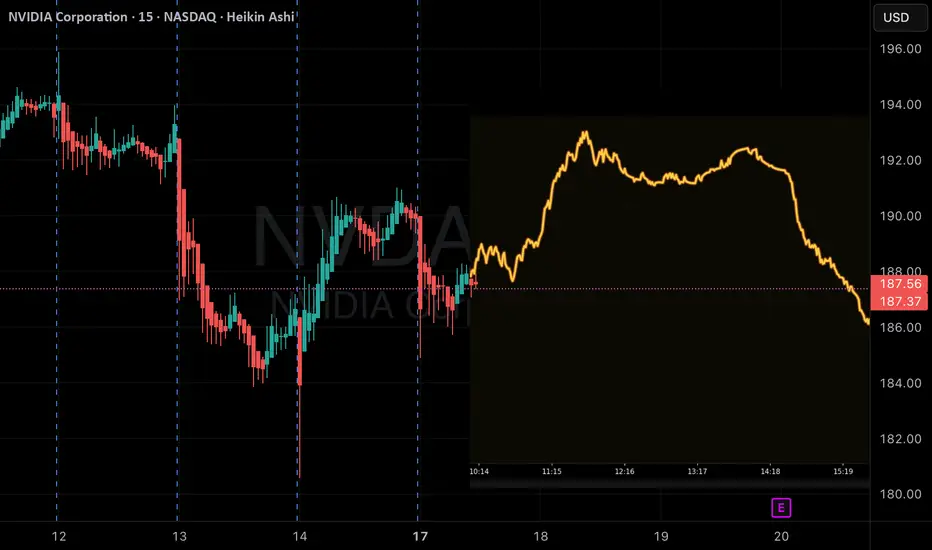
NVDA QuantSignals V3 — Katy Flags Subtle Reversal MoveNVDA (QuantSignals V3)
Market Structure:
NVDA is showing neutral-to-weak momentum with price hovering near short-term resistance at $189–190. Buyers are losing strength, and the tape shows lower high formations, signaling potential exhaustion.
Trend Outlook:
The Katy 1M model flags soft downside pressure. Despite the neutral trend reading, intraday structure leans toward a controlled pullback, supported by moderate volatility (16.5%).
Order Flow Insight:
Momentum flow appears to be slowing, with reduced upward volume. The micro-trend suggests fade-the-rip behavior—small rallies may get sold into.
Key Levels:
Resistance: $189.40 / $191.70
Support: $188.00 / $186.80
Short Trigger Zone: $188.50–$189.00
Vision Summary:
NVDA shows lower momentum, weak buyer conviction, and a short-biased micro-shift. Best setup aligns with a tight short scalp targeting the next liquidity pocket below $188.00.
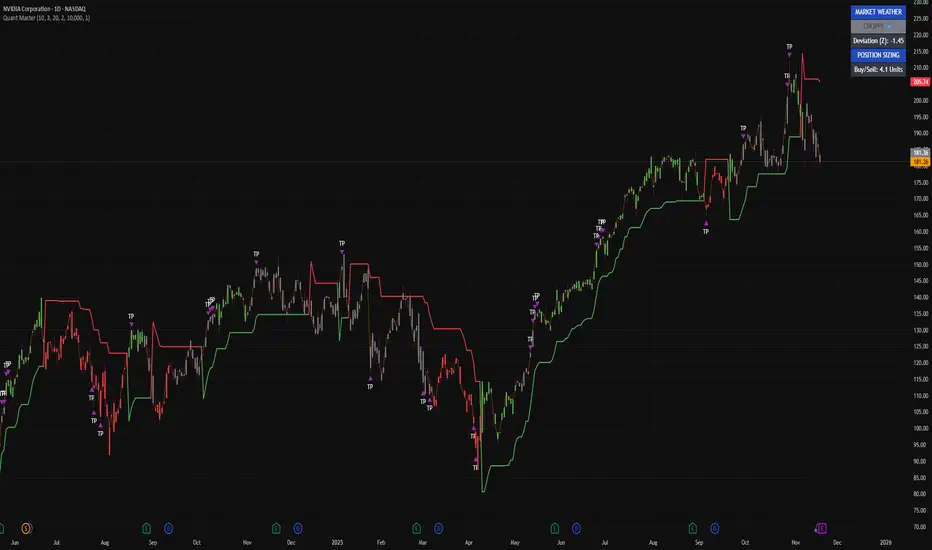
I’m reading NVIDIA through pure structureThis is NVDA on the 1-day with my Quant Master Trend System, and right now the message is simple: we’ve transitioned from impulse to instability.
The ribbon is still red from the recent flip, and every candle since that flip has respected the stop level. That’s the part most people miss — when the ribbon turns red while Market Weather is CHOPPY, it means the trend engine isn’t aligned. There’s pressure, but not clean momentum.
That’s exactly what you’re seeing here.
NVDA topped, printed a string of TP clusters during distribution, and then lost its green momentum base. Once that base broke, it instantly acted as resistance — a classic behavior in this model. The current deviation reading at Z ≈ -1.45 confirms price is stretched, but not in capitulation. This is structural unwind, not panic selling.
Look back at the last time NVDA printed this signature:
Green ribbon → long rally → heavy TP clustering → red flip → CHOPPY weather → multi-week digestion phase.
The system is showing the same rhythm right now.
So here’s how I see it:
The uptrend is no longer intact.
Momentum has shifted from expansion to dispersion.
Market Weather says don’t trust breakouts, don’t trust dips.
The clean trend is gone — this is recalibration.
And until NVDA builds a fresh green momentum base and holds above it, I’m treating every bounce inside red conditions as a continuation of the unwind.
NVDA Weekly Call Alert — AI Recovery + Institutional Flow🧭 Overview
Ticker: NVDA
Current Price (Entry): $187.50
Trend: Bullish (Analyst + AI recovery)
Expiry: 2025-11-21 (7D)
Strike: $187.50 (ATM, Delta 0.521)
Position Size: 4% of portfolio
📊 AI & Technical Forecast
Katy AI Target: Recovery sequence $185 → $190, timing for momentum reversal
Analyst Price Target: $250
PCR / Flow Intel: 0.33 → bullish institutional positioning
RSI: 80.9 → overbought, expect short-term dip before upward move
VIX: 19.84 → favorable volatility entry before expansion
Insights:
Friday entry captures weekend theta premium
Light weekly volume (0.6x) → monitor for institutional confirmation
Dip to $185.50 may provide optimal entry for maximum upside
🎯 Trade Setup
Parameter Value
Direction CALL
Strike $187.50
Entry $7.50
Target 1 $12.00 (+60%)
Target 2 $15.00 (+100%)
Stop Loss $4.50 (–40%)
Expiry 2025-11-21
Position Size 4% portfolio
Confidence 60%
⚡ Key Advantages
ATM call → balanced risk/reward vs OTM alternatives
Tight stop aligns with AI critical support at $184.44
Institutional bullish flow + AI recovery pattern → asymmetric reward potential
Timing advantage: Monday-Tuesday momentum reversal
🚨 Risk Notes
Low AI confidence (50%) → disciplined sizing required
Overbought RSI → short-term upside may be capped
Rising VIX → daily premium decay risk, consider scaling entry
Avoid holding past Wednesday if Target 1 isn’t reached
Summary
NVDA presents a medium-conviction weekly call leveraging AI recovery trajectory, institutional flow, and analyst support. Ideal for disciplined traders seeking timed momentum entry into a 7-day horizon.
NVDA using TrenVantage LITEQuick look at nvidia using the TrenVantage LITE indicator. Clearly in a downtrend here, close levels plotted are daily's that have been tested, chances are they wont hold. Would expect to see the lower levels since this has already turned into a downtrend. Weekly Monthly and Daily Key Levels all plotted.

NVDA Montly Neg. Divergence?Sure, stocks will rise eventually and we have been in a strong bull market since autumn 2022 but how about this negative divergence on the monthly chart of NVDA? (Also on the weekly chart.) Monthly charts always shows us the direction and we just take action according that by looking at the daily. How long more the buyers are going to buy NVDA? Count the Elliott waves since Oct. 2022 on higher time frames as well. Indicators getting weak, Fibonacci is struggling around 161 level… Something has to cool off.

nvidia is rangeThe inability of the price to break the 140 area and return to the 91 dollar area can be imagined in three scenarios:
1. The market will suffer in this area until the decision is reached
2. Breaking the 140 area and continuing the upward trend
3. Breaking the $75 support area and trying to reach the $53 area is out of the question at the moment.

Nvidia Stock Fails to Return to the $200 LevelAlthough Nvidia seemed poised to start the week with an optimistic bias, partly driven by the end of the U.S. government shutdown, which has generated a short-term confidence boost, the stock has begun to show a bearish tone in the current session, posting a decline of more than 2%. This weakness is mainly due to recent comments from the SoftBank Group, which sold its entire stake in Nvidia for approximately US$ 5.8 billion, raising concerns about a possible reduction in exposure to the semiconductor industry in the short term. This event has led to growing investor caution toward the stock and currently maintains a notable selling bias in the market.
Uptrend Tries to Hold
Despite recent downward corrections that have halted the stock’s steady advance, Nvidia has yet to show a decisive bearish move that would end the long-term uptrend line. In the broader picture, buying momentum continues to hold firm. However, if selling pressure continues to strengthen, the uptrend could be at risk, especially if the price falls below the 50-period moving average.
RSI
The RSI indicator line is gradually approaching the neutral level of 50, suggesting a balance between buying and selling forces over the last 14 trading sessions. As long as this equilibrium remains, the stock is likely to continue showing indecisive movements in the coming days.
TRIX
The TRIX indicator remains above the neutral level of 0, indicating that in the long-term outlook, bullish strength continues to dominate the average of exponential moving averages. As long as the TRIX stays above this level, the bullish bias may remain intact, allowing the uptrend line to continue defending its position over the coming weeks.
Key Levels to Watch:
208 USD – Major Resistance: Corresponds to the area of recent highs. Price movements breaking above this level could trigger stronger buying pressure, reinforcing the current uptrend.
200 USD – Nearby Resistance: A key psychological level. Price action above this zone would reactivate a short-term bullish bias and reduce the risk of a trendline breakdown.
184 USD – Key Support: This is the most relevant support area, coinciding with the 50-period moving average and the Ichimoku cloud, which increases its significance. Downward movements reaching this zone could end the long-term bullish structure and lead to a period of indecision or the formation of a short-term consolidation range.
Written by Julian Pineda, CFA, CMT – Market Analyst

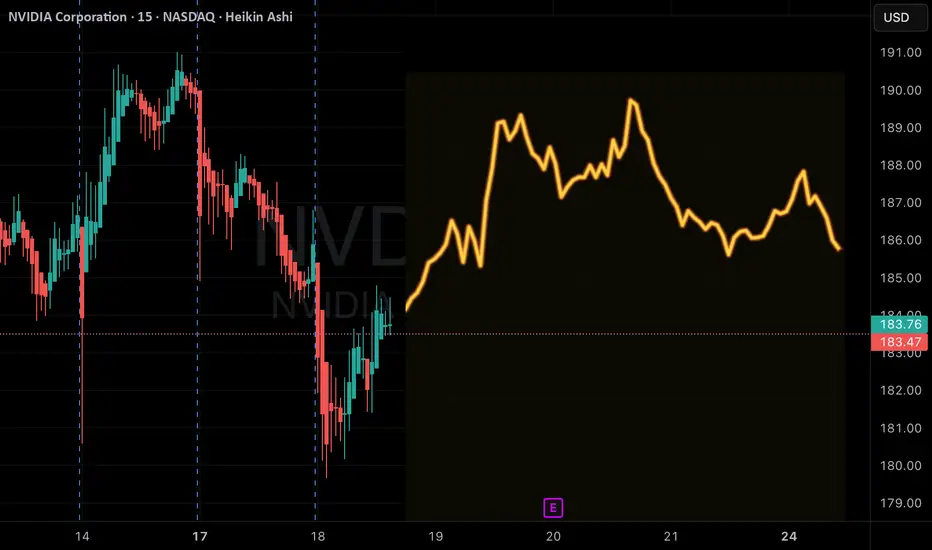
NVDA: 1 week before earnings effect. Supply-demand imbalance.Parretto principle (20-80): small important things can have great influence in grand scheme of things. Some events have greater weight, than say 80-90% of daily events.
Stocks move based on Supply-demand dynamics (disbalance etc), patterns or trends are just a feedback.
The problem with using charts as a feedback for strength (or feedback for S-D strength) is that: (1) on a expensive market, with extended prices (with high supply too), (2) during important NVDA earnings, it's almost predictable how markets would sink, or at least be volatile.
Demand stalls. Supply gets worried. Price down.
//People are risk averse. Hence.. predictable.

Pop and drop part deuxLooks like that is possible, although right now it definitely feels more bullish than not. I think the market will be choppy the next few days at least. Gold is at resistance. VIX looks like an ABC forming. Oil falling but likely a test of the bottom before a rally. BTC could get to 92500 but it will find resistance there. Good luck!

NVIDIA is CISCO 2.0 NVIDIA is a $20-$30 Stock without the Data Centers. There is zero demand for Data Centers. We are seeing the second Dot.com Bubble. NVIDIA is CISCO 2.0. CISCO dropped 80-90% after the Dot.com price discovery happened. This is coming in 2026.

Nvidia nov-dec 2025 end yearPrice in the middle of weekly range ($178.91–$200.05) at phase 1 to 2
EMA alignment confirms bearish weekly trend
i believe NVIDIA might dip to $160 - $170 (near the gap it has created/ 1 x A Fib extension levels), with downward pressure due to overvaluations

$NVDA | Fib Expansion Points to $212.81 → Is the AI Supercycle JWaverVanir International LLC | Weekly Fibonacci Roadmap
📅 June 25, 2025 | +7.27% Day | Post-Stock Split Momentum
NVIDIA ( NASDAQ:NVDA ) continues to dominate the AI-driven tech rally. After reclaiming the 1.618 Fibonacci level ($128.35), price has broken above the 0.886 retracement ($146.72) and is now pressing higher with bullish volume.
🧠 Fibonacci Insights:
🔺 1.786 Fib Extension: $207.76
🎯 Primary Target: $212.81 (Golden Projection)
🚀 Long-term Fib targets extend into $250–290+ zone (2.618–3.0 extensions)
🔻 Red trendline below signals well-respected diagonal support since early 2023
📊 Price Outlook:
Current Price: $154.31
Short-term Path: Bullish breakout → $168.21 → $178.43
Next Major Resistance: $212.81
Support to Hold: $139.93 / $128.35 (previous Fib clusters)
🧩 Catalysts Ahead:
Q2 Earnings (Late August 2025) – Focus on AI/data center revenue acceleration.
NVIDIA Blackwell GPU shipments – Institutional uptake will confirm pipeline robustness.
AI Sovereign Demand – U.S., UAE, Singapore and Saudi Arabia investing in GPU infrastructure.
AI Arms Race – Competitive moat widening vs. AMD, Intel.
AI App Ecosystem Expansion – Surge in demand for inferencing chips (L4, L40, GB200).
Post-Stock Split Rotation – Retail inflow and fresh institutional allocations.
📌 Summary:
NVIDIA is not just a chipmaker — it’s the core of the modern AI stack. With clear Fibonacci structure and geopolitical tailwinds, the next target is $212.81. Watch dips into $140s for potential reload zones.
🔖 Hashtags:
#NVDA #NVIDIA #AIstocks #WaverVanir #FibExtension #FibonacciTrading #AIboom #BlackwellGPU #GPUpower #PostSplit #TechLeadership #TradingView #SMC #AIarmsrace


$NVDA NVIDIA CORPORATIONExecutive Summary:
NVIDIA Corporation ( NASDAQ:NVDA ) has demonstrated remarkable resilience and sustained growth over multiple market cycles, consistently defending its leadership position despite intense competition within the semiconductor and AI sectors. This analysis outlines a structured, multi-layered support framework derived from Fibonacci retracement theory, which identifies strategic price levels for potential entry. Our primary area of interest converges around the $150.00 psychological level, which aligns with a key Fibonacci midpoint and is anticipated to serve as a robust zone for buyer participation.
Detailed Technical Framework:
1. A History of Defending Its Turf:
NVDA's impressive performance is not merely a function of bullish markets but a testament to its fundamental dominance, particularly in the parallel processing and AI revolutions. The company has repeatedly validated its market strength by navigating competitive threats and leveraging its technological moat, which in turn has created a foundation of strong investor confidence. This fundamental strength is often mirrored in its technical charts, where pullbacks are frequently met with aggressive buying at key value areas.
2. The Fibonacci Support Ladder: A Tiered Defense System
By applying Fibonacci retracement levels to a significant prior upward swing, we can map a hierarchy of potential support zones. These levels do not operate in isolation but represent a cascading series of defenses where buyers have historically stepped in. Our analysis identifies the following critical tiers, from shallowest to deepest:
First Line of Defense (Shallow Pullback):
23.6% Level ($182.53): This level represents a mild, healthy pullback. A hold here would signify exceptionally strong momentum and would likely be a continuation pattern rather than a deep correction.
Secondary Support Zone (Moderate Correction):
38.2% Level ($164.02): A retracement to this level indicates a more pronounced correction but remains within the bounds of a strong uptrend. This is a common level for institutions to begin accumulating positions.
50.0% Level ($149.39): The halfway point of the prior major move is a critical psychological and technical battleground. A successful bounce from this level suggests the overall bull trend remains intact and that market sentiment has found a balance.
Tertiary & Deep Value Zones (Significant Correction):
61.8% Level ($134.58): Known as the "Golden Ratio," this is a deep retracement that often holds in volatile but fundamentally sound assets. A test of this level would indicate a major correction is underway, presenting a higher-risk but potentially high-reward entry point for long-term believers.
78.6% Level ($113.49): This is a deep, rarely-tested retracement level. A move to this zone would signal a severe market downturn or a fundamental reassessment of the stock, but it would also represent a potentially profound long-term value opportunity.
The Ultimate Major Support:
The $100.00 Psychological Level: Beyond the Fibonacci structure, the triple-digit benchmark at $100.00 stands as a monumental psychological and technical support. It represents a round number that often attracts immense buying interest and would be considered a "line in the sand" for the long-term thesis.
3. Primary Strategic Interest & Risk Management:
While the Fibonacci ladder provides multiple potential entry points, our primary area of strategic interest converges around the $150.00 level. This is not a single price point but a zone encompassing the 50% Fibonacci level at $149.39. The rationale for favoring this zone is twofold:
Technical Significance: It is a classic "value area" in a strong trend, offering a favorable balance of potential upside and managed risk.
Psychological Strength: The $150 level is a major round number that is easy for the market to identify and act upon.
A decisive reversal at or near this $150 zone, confirmed by bullish price action (e.g., hammer candlesticks, increased volume on up-days), would provide a strong signal for capital deployment. As with any investment, this thesis requires disciplined risk management; a sustained break below the deeper supports, particularly the $134.58 (61.8%) level, would necessitate a re-evaluation of the near-term bullish outlook.

NVDA (NVIDIA) – Buy PlanNVDA (NVIDIA) – Buy Plan
📊 Market Sentiment
On October 29, the FED lowered rates by 25bps as expected. However, Powell’s remarks introduced uncertainty around further cuts in December, emphasizing that future policy will depend on incoming data.
One FED member dissented, preferring no cut this cycle — a notable shift from September’s unanimous decision.
Additionally, ADP Non-Farm Employment Change came at 42K versus 32K expected. It’s slightly higher, but since other macro data are missing due to the U.S. government shutdown, the overall sentiment remains mixed.
For now, macro sentiment leans bearish, as rate cuts may be delayed into 2026.
However, with NVDA earnings approaching, we could see a short-term bullish sentiment building around the stock.
📈 Technical Analysis
NVDA is currently trading around the 0.5 equilibrium zone, which aligns with the HTF bullish trendline.
This area could provide temporary support and a potential bounce setup.
However, it’s crucial to watch the SPY structure as it may influence NVDA’s short-term movement.
📌 Game Plan / Expectations
I’ll be watching the $185–$180 range as a key HTF support zone.
This area also aligns with a possible trendline deviation, where price could manipulate below the trendline to trap sellers before reclaiming it.
I plan to buy call options within this range, targeting a continuation of the bullish leg post-earnings.
💬 If this breakdown aligns with your outlook, like and comment below.
For deeper sentiment and strategy insights, subscribe to my Substack — free access available.
⚠️ Disclaimer
This analysis is for educational purposes only and does not constitute financial advice. Always conduct your own research before trading or investing.
