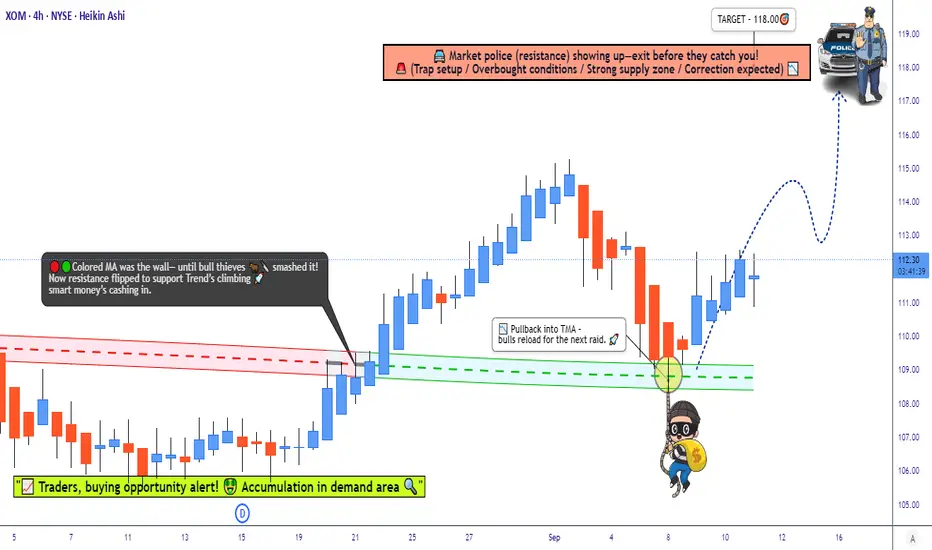
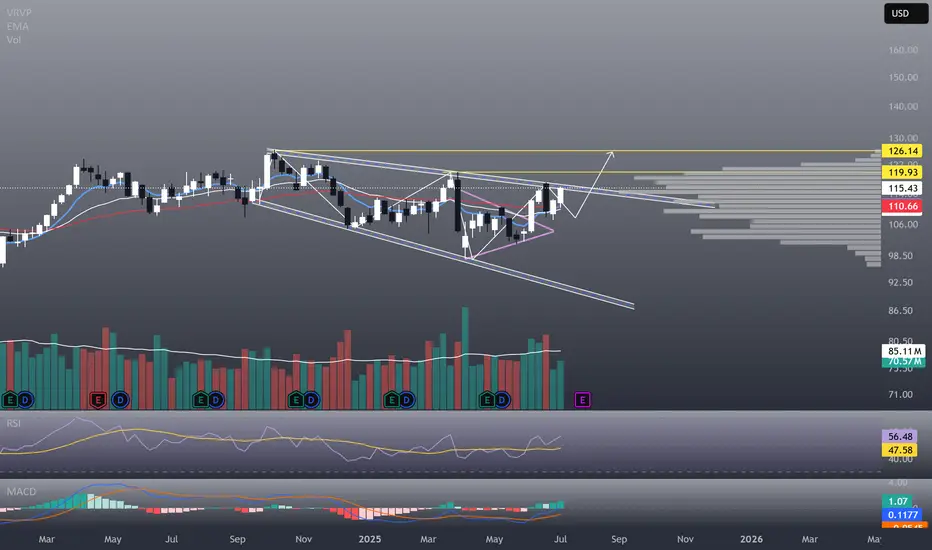
Exxon Mobil Stock Outlook: Fundamentals + Technicals Aligned📌 Exxon Mobil Corporation (XOM) — Bullish Master Plan (Swing / Scalping Trade)
🛠️ Plan Setup (Thief Strategy)
Bias: Bullish — Triangular Moving Average Pullback 📈
Entry: Multiple layered limit orders at 🔹 $110.00 🔹 $111.00 🔹 $112.00 (You can adjust layers based on your own strategy).
Stop Loss (Pro
Next report date
—
Report period
—
EPS estimate
—
Revenue estimate
—
6,620 CLP
33.61 T CLP
339.23 T CLP
4.26 B
About Exxon Mobil Corporation
Sector
Industry
CEO
Darren W. Woods
Website
Headquarters
Spring
Founded
1882
ISIN
US30231G1022
FIGI
BBG00YFSDGL4
Exxon Mobil Corp. engages in the exploration, development, and distribution of oil, gas, and petroleum products. It operates through the following segments: Upstream, Energy Products, Chemical Products, and Specialty Products. The Upstream segment organizes the exploration of crude oil and natural gas. The Energy Products segment includes fuels, aromatics, and catalyst and licensing. The Chemical Products segment offers petrochemicals. The Specialty Products segment provides finished lubricants, basestocks and waxes, synthetics, and elastomers and resins. The company was founded by John D. Rockefeller in 1882 and is headquartered in Spring, TX.
Related stocks
XOM: Decision PointXOM heating up and touching strong resistance here. A confirmation of a breakout would make me go long OR (more likely) a rejection to $108 in which case I'll also go long. Bullish either way.
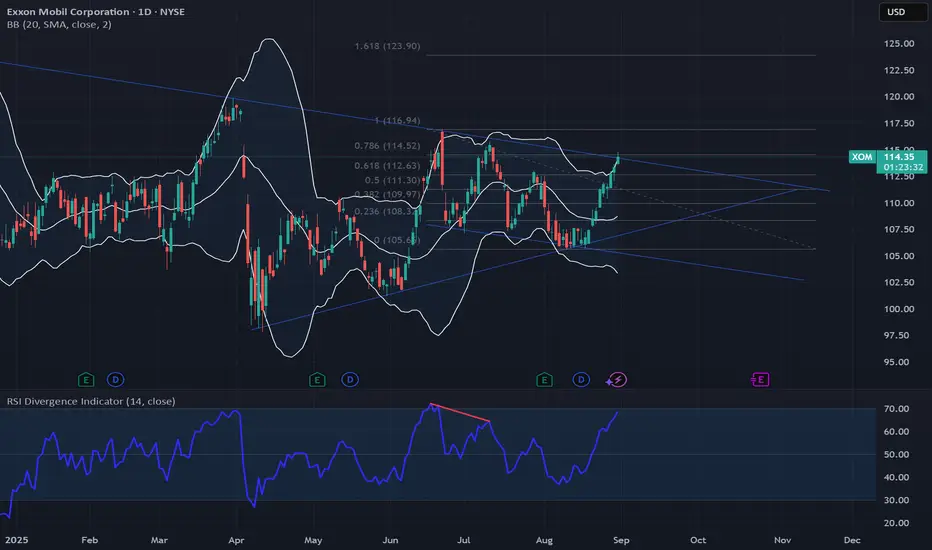
Exxon Stock Chart Fibonacci Analysis 082125Trading Idea
1) Find a FIBO slingshot
2) Check FIBO 61.80% level
3) Entry Point > 108/61.80%
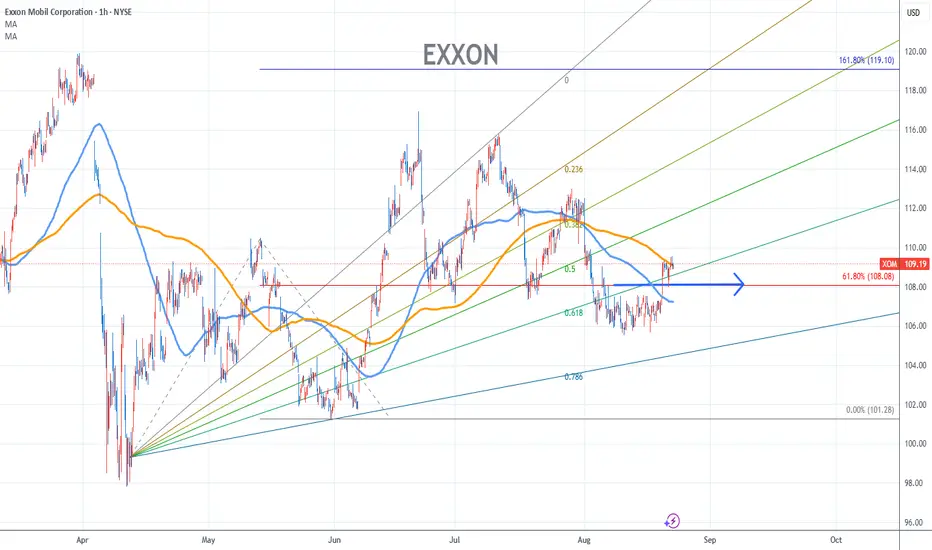
Chart time frame:B
A) 15 min(1W-3M)
B) 1 hr(3M-6M)
C) 4 hr(6M-1year)
D) 1 day(1-3years)
Stock progress:A
A) Keep rising over 61.80% resistance
B) 61.80% resistance
C) 61.80% support
D) Hit the bottom
E)
XOM Short (-33%)XOM is likely to Sharp decline from $112, aligning with its target within the FVG zone and the leg of the Crab pattern.

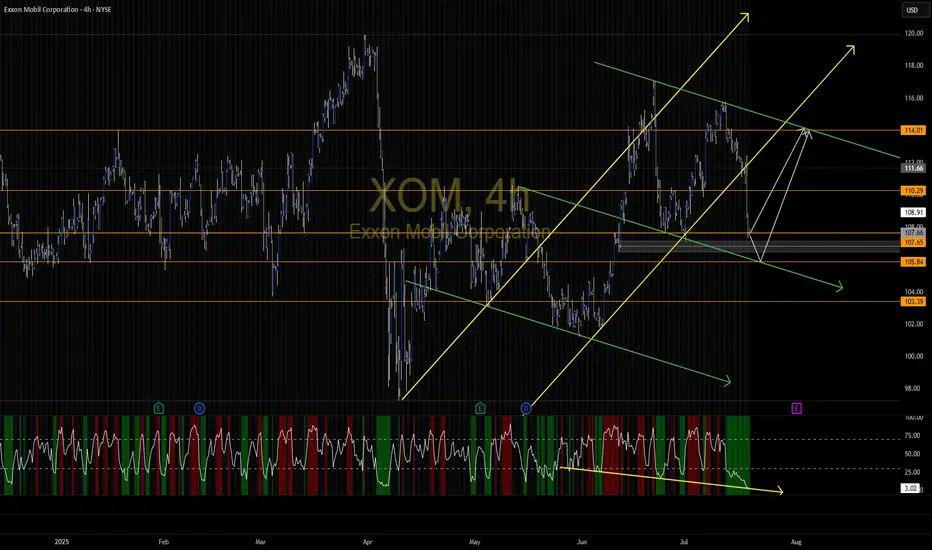
EXXON MOBIL Critical crossroads.Exxon Mobil (XOM) has been trading within a Channel Down since the June 17 2024 Low and just recently on the July 11 2025 High, it made a Lower High pattern similar to November 22 2024.
As long as the price trades below the 1D MA200 (orange trend-line), we expect to start the new Bearish Leg and te

XOM the Structure I see along with the RSIPlay the levels with confirmation and retest. I hope this helps
XOM 125 PT Leader of its sector XLE and showing relative strength.
Technical analysis is consistent with pattern formation and breakout
Top-Down Analysis in Action – Live Trade: Where I Enter and WhyIn this video, I walk you through my full trading process – starting with a clean top-down analysis.
I begin on the daily chart to spot key market structure and levels, then zoom in to the 1-hour chart for confirmation, and finally execute my trade on the 5-minute chart.
You’ll see:
✔️ How I define

XOM daily setup to $117XOM gave us a 50% retracement on the daily (I use 24 hour chart since it includes after hours), swept a key level, and bouncing off bullish FVG.
We break and hold $110.94 and we're in business.
Targeting $117.05. I have July 18 $110 calls.

Exxon Mobil Corporation (XOM) – BUY IDEA📌 We’re watching a strong bullish structure in XOM. After a sharp open, price retraces to fill the GAP and respects the key Low zone 🟧, signaling institutional interest.
🟢 Entry aligns with downside liquidity sweep followed by bullish momentum. This trade has confluence between previous liquidity,

See all ideas
Summarizing what the indicators are suggesting.
Neutral
SellBuy
Strong sellStrong buy
Strong sellSellNeutralBuyStrong buy
Neutral
SellBuy
Strong sellStrong buy
Strong sellSellNeutralBuyStrong buy
Neutral
SellBuy
Strong sellStrong buy
Strong sellSellNeutralBuyStrong buy
An aggregate view of professional's ratings.
Neutral
SellBuy
Strong sellStrong buy
Strong sellSellNeutralBuyStrong buy
Neutral
SellBuy
Strong sellStrong buy
Strong sellSellNeutralBuyStrong buy
Neutral
SellBuy
Strong sellStrong buy
Strong sellSellNeutralBuyStrong buy
Displays a symbol's price movements over previous years to identify recurring trends.
P
PXD5026932
Pioneer Natural Resources Company 1.9% 15-AUG-2030Yield to maturity
—
Maturity date
Aug 15, 2030
P
PXD.GB
Pioneer Natural Resources Company 7.2% 15-JAN-2028Yield to maturity
—
Maturity date
Jan 15, 2028
P
PXD5112422
Pioneer Natural Resources Company 1.125% 15-JAN-2026Yield to maturity
—
Maturity date
Jan 15, 2026
See all XOMCL bonds
Curated watchlists where XOMCL is featured.

Big Oil: Integrated energy companies
10 No. of Symbols

Oil stocks: Liquid black gold
6 No. of Symbols

See all sparks
Frequently Asked Questions
The current price of XOMCL is 105,700 CLP — it hasn't changed in the past 24 hours. Watch Exxon Mobil Corporation stock price performance more closely on the chart.
Depending on the exchange, the stock ticker may vary. For instance, on BCS exchange Exxon Mobil Corporation stocks are traded under the ticker XOMCL.
We've gathered analysts' opinions on Exxon Mobil Corporation future price: according to them, XOMCL price has a max estimate of 138,623.33 CLP and a min estimate of 90,822.18 CLP. Watch XOMCL chart and read a more detailed Exxon Mobil Corporation stock forecast: see what analysts think of Exxon Mobil Corporation and suggest that you do with its stocks.
XOMCL reached its all-time high on Nov 13, 2024 with the price of 120,000 CLP, and its all-time low was 29,750 CLP and was reached on Jan 5, 2021. View more price dynamics on XOMCL chart.
See other stocks reaching their highest and lowest prices.
See other stocks reaching their highest and lowest prices.
XOMCL stock is 0.20% volatile and has beta coefficient of 0.44. Track Exxon Mobil Corporation stock price on the chart and check out the list of the most volatile stocks — is Exxon Mobil Corporation there?
Today Exxon Mobil Corporation has the market capitalization of 457.14 T, it has increased by 3.05% over the last week.
Yes, you can track Exxon Mobil Corporation financials in yearly and quarterly reports right on TradingView.
Exxon Mobil Corporation is going to release the next earnings report on Oct 24, 2025. Keep track of upcoming events with our Earnings Calendar.
XOMCL earnings for the last quarter are 1.53 K CLP per share, whereas the estimation was 1.47 K CLP resulting in a 4.60% surprise. The estimated earnings for the next quarter are 1.69 K CLP per share. See more details about Exxon Mobil Corporation earnings.
Exxon Mobil Corporation revenue for the last quarter amounts to 76.25 T CLP, despite the estimated figure of 75.49 T CLP. In the next quarter, revenue is expected to reach 81.84 T CLP.
XOMCL net income for the last quarter is 6.62 T CLP, while the quarter before that showed 7.35 T CLP of net income which accounts for −9.90% change. Track more Exxon Mobil Corporation financial stats to get the full picture.
Yes, XOMCL dividends are paid quarterly. The last dividend per share was 957.45 CLP. As of today, Dividend Yield (TTM)% is 3.53%. Tracking Exxon Mobil Corporation dividends might help you take more informed decisions.
Exxon Mobil Corporation dividend yield was 3.57% in 2024, and payout ratio reached 49.00%. The year before the numbers were 3.68% and 41.41% correspondingly. See high-dividend stocks and find more opportunities for your portfolio.
As of Sep 15, 2025, the company has 61 K employees. See our rating of the largest employees — is Exxon Mobil Corporation on this list?
EBITDA measures a company's operating performance, its growth signifies an improvement in the efficiency of a company. Exxon Mobil Corporation EBITDA is 57.47 T CLP, and current EBITDA margin is 18.76%. See more stats in Exxon Mobil Corporation financial statements.
Like other stocks, XOMCL shares are traded on stock exchanges, e.g. Nasdaq, Nyse, Euronext, and the easiest way to buy them is through an online stock broker. To do this, you need to open an account and follow a broker's procedures, then start trading. You can trade Exxon Mobil Corporation stock right from TradingView charts — choose your broker and connect to your account.
Investing in stocks requires a comprehensive research: you should carefully study all the available data, e.g. company's financials, related news, and its technical analysis. So Exxon Mobil Corporation technincal analysis shows the buy rating today, and its 1 week rating is buy. Since market conditions are prone to changes, it's worth looking a bit further into the future — according to the 1 month rating Exxon Mobil Corporation stock shows the buy signal. See more of Exxon Mobil Corporation technicals for a more comprehensive analysis.
If you're still not sure, try looking for inspiration in our curated watchlists.
If you're still not sure, try looking for inspiration in our curated watchlists.