SOLUSDT: Get Ready For 300 Mark, This Time Reversal BigSOLUSDT has the potential to reach the 300 price range once it falls to our buying zone, defined by two horizontal white lines. Upon reaching this area we can target the 300 price level. Please exercise accurate risk management when trading cryptocurrencies.
For further analysis please like and com
Related pairs

SOLUSDT: Liquidity Tightens – Every Pullback Drops Even Deeper!When talking about Solana right now, the clearest feeling is that the market is losing strength day by day . Recent news shows that SOL has dropped sharply in November, and large capital keeps exiting the market — turning every bounce into an excuse for holders to sell rather than a sign of rever

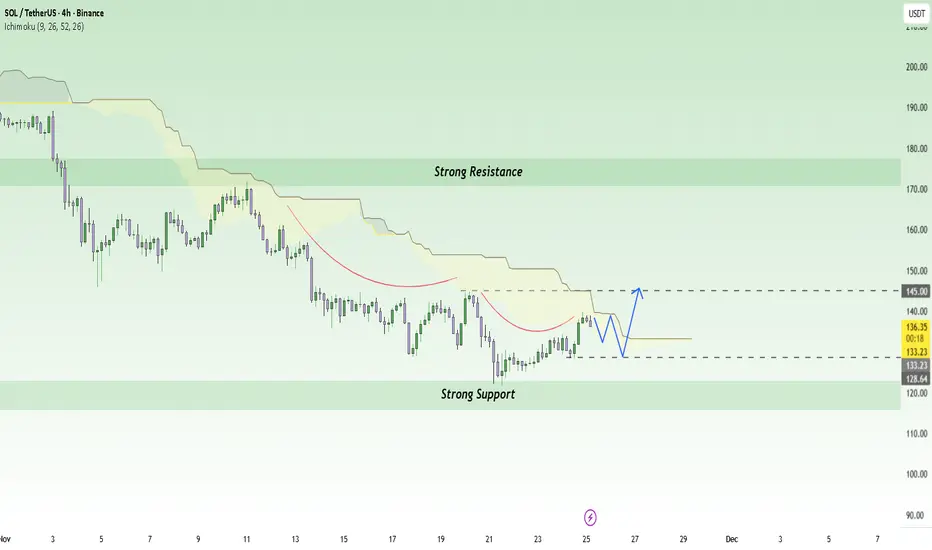
SOL: Bearish Pressure Extends with Targets at 136.50 and 134.00 Hello everyone, SOL is moving within a persistent downside structure — not necessarily dramatic, but consistent and difficult to counter. With the broader crypto market softening, and BTC and ETH entering corrective phases, SOL has very little support to stabilise its price. On top of that, the mar

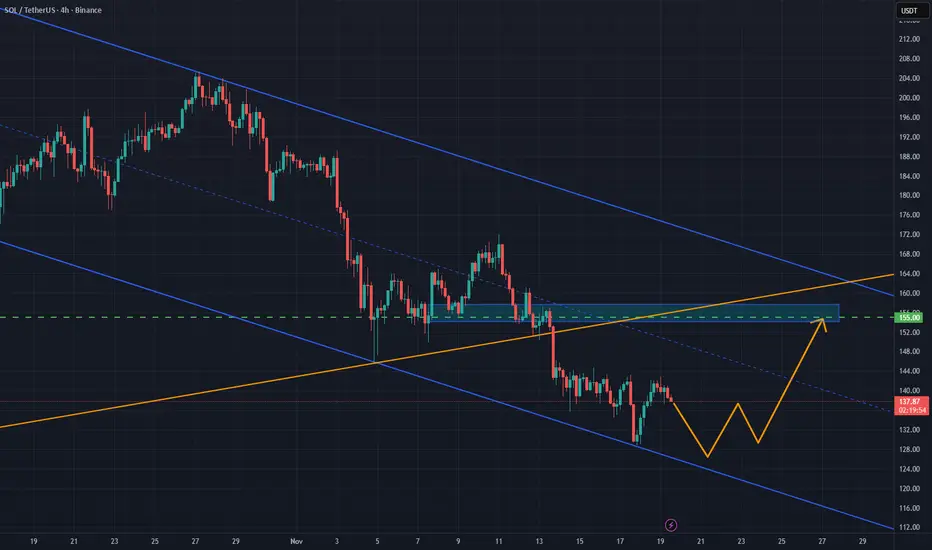
SOL/USDT: Relief Rally Builds After Rebound from Key SupportSOL/USDT bounced strongly from the 128–130 support zone, reacting off the lower boundary of its downward channel. While the broader trend remains bearish, this move signals early signs of accumulation. Holding above 130 could open a corrective rally toward 155, as oversold conditions unwind and shor
SOL — Deep Pullback Into Major SupportSOL has been in a steady freefall over the past weeks. On the higher timeframes the key support and resistance zones are very clearly defined. The $250 level acted as a big resistance area, with multiple rejections showing sellers were firmly in control up there.
On the downside, the $125 support z

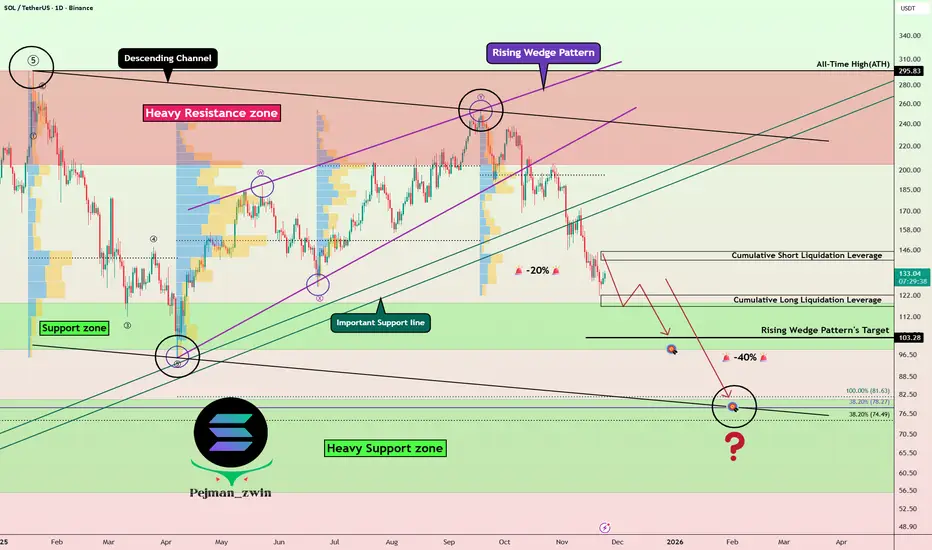
Solana Breakdown Roadmap—Is the Correction Just Getting Started?Today, I analyze the Solana( BINANCE:SOLUSDT ) project and explore its roadmap for the coming days and weeks, so stay tuned!
Solana, with the help of the Rising Wedge Pattern, has successfully broken through its important support lines and is currently moving near the Support zone($118-$98).
From
SOLI do not think we will go lower then this, the support is huge and the setup is too clean. This is one of the best accumulation zones you will ever get.

SOL/USDT: Growth Fueled by Inflows and Network ExpansionNews: The Solana spot ETF in the U.S. has seen a significant inflow of capital , with over $476 million USD coming in over 17 consecutive days. At the same time, the Solana network has reported strong revenue growth , reaching around $2.85 billion USD . These factors have bolstered investor co
Solana monthly head and shoulders pattern Solana is showing a clear head and shoulders on the higher timeframe. A break of the neckline around $125 would see an eventual target of $60. This would represent a 50% reduction in price.

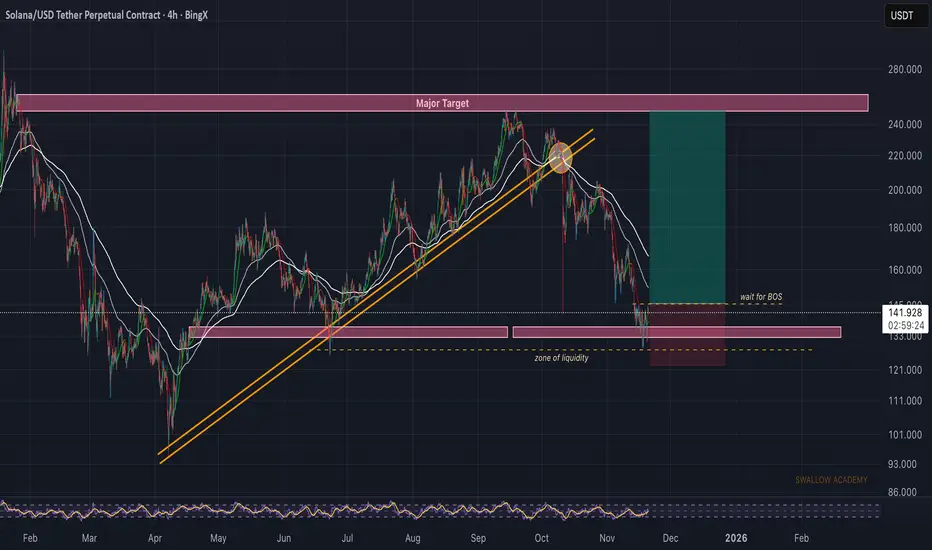
Solana (SOL): Looking For Proper Break of StructureSOL had a decent bounce from a liquidity zone, where buyers showed some reaction. For now we’re waiting for a clean BOS to confirm that buyers are actually stepping back in to fully overtake this area.
If we get that BOS, the plan is simple—look for a retrace entry and aim for the major target abov
See all ideas
Summarizing what the indicators are suggesting.
Oscillators
Neutral
SellBuy
Strong sellStrong buy
Strong sellSellNeutralBuyStrong buy
Oscillators
Neutral
SellBuy
Strong sellStrong buy
Strong sellSellNeutralBuyStrong buy
Summary
Neutral
SellBuy
Strong sellStrong buy
Strong sellSellNeutralBuyStrong buy
Summary
Neutral
SellBuy
Strong sellStrong buy
Strong sellSellNeutralBuyStrong buy
Summary
Neutral
SellBuy
Strong sellStrong buy
Strong sellSellNeutralBuyStrong buy
Moving Averages
Neutral
SellBuy
Strong sellStrong buy
Strong sellSellNeutralBuyStrong buy
Moving Averages
Neutral
SellBuy
Strong sellStrong buy
Strong sellSellNeutralBuyStrong buy
Displays a symbol's price movements over previous years to identify recurring trends.
Frequently Asked Questions
The current price of SOL / TetherUS (SOL) is 139.36 USDT — it has fallen −0.56% in the past 24 hours. Try placing this info into the context by checking out what coins are also gaining and losing at the moment and seeing SOL price chart.
SOL / TetherUS price has risen by 3.77% over the last week, its month performance shows a −28.42% decrease, and as for the last year, SOL / TetherUS has decreased by −42.40%. See more dynamics on SOL price chart.
Keep track of coins' changes with our Crypto Coins Heatmap.
Keep track of coins' changes with our Crypto Coins Heatmap.
SOL / TetherUS (SOL) reached its highest price on Jan 19, 2025 — it amounted to 295.83 USDT. Find more insights on the SOL price chart.
See the list of crypto gainers and choose what best fits your strategy.
See the list of crypto gainers and choose what best fits your strategy.
SOL / TetherUS (SOL) reached the lowest price of 1.03 USDT on Dec 23, 2020. View more SOL / TetherUS dynamics on the price chart.
See the list of crypto losers to find unexpected opportunities.
See the list of crypto losers to find unexpected opportunities.
The safest choice when buying SOL is to go to a well-known crypto exchange. Some of the popular names are Binance, Coinbase, Kraken. But you'll have to find a reliable broker and create an account first. You can trade SOL right from TradingView charts — just choose a broker and connect to your account.
Crypto markets are famous for their volatility, so one should study all the available stats before adding crypto assets to their portfolio. Very often it's technical analysis that comes in handy. We prepared technical ratings for SOL / TetherUS (SOL): today its technical analysis shows the sell signal, and according to the 1 week rating SOL shows the sell signal. And you'd better dig deeper and study 1 month rating too — it's sell. Find inspiration in SOL / TetherUS trading ideas and keep track of what's moving crypto markets with our crypto news feed.
SOL / TetherUS (SOL) is just as reliable as any other crypto asset — this corner of the world market is highly volatile. Today, for instance, SOL / TetherUS is estimated as 2.06% volatile. The only thing it means is that you must prepare and examine all available information before making a decision. And if you're not sure about SOL / TetherUS, you can find more inspiration in our curated watchlists.
You can discuss SOL / TetherUS (SOL) with other users in our public chats, Minds or in the comments to Ideas.