Gold with technical analysis and its key support and resistance Gold with technical analysis and its key support and resistance
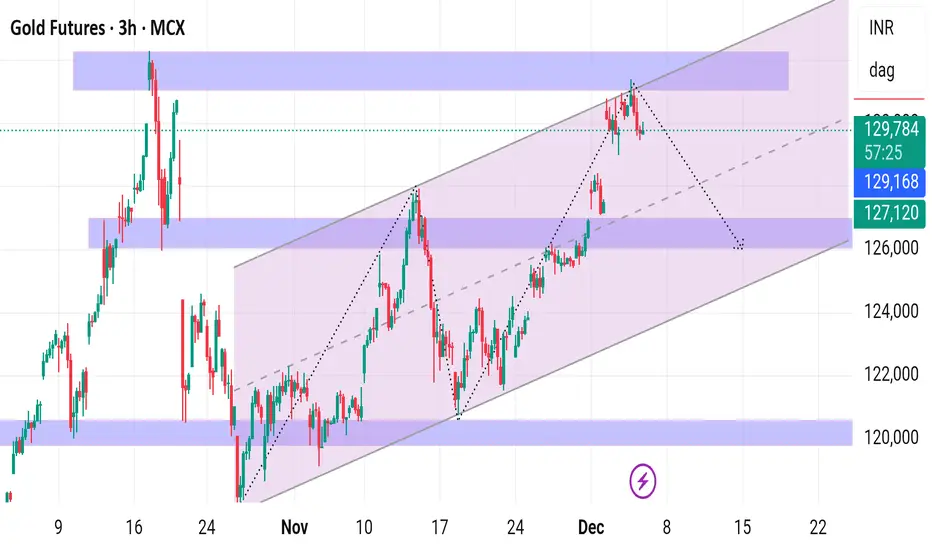
Gold is in a rising parallel channel on the 3‑hour chart, currently reacting lower from the upper boundary, so short‑term bias is for a pullback within an overall uptrend.
Key levels to watch are supports near 129,175–127,120 and resistance around 131,200–131,500 and the channel top.
## Trend structure
- Price has been respecting a well‑defined ascending channel since early November, with higher highs and higher lows confirming an uptrend on this timeframe.
- The latest swing has reached the upper band of this channel and shows rejection candles, indicating supply pressure and possible short‑term exhaustion of buyers.
## Support zones
- Immediate intraday support is near the mid‑channel and prior breakout area around 129,100–129,200; a hold here keeps the uptrend structure intact.
- Deeper support sits at 127,100–127,200, aligning with the channel lower boundary and previous demand zone; a sustained break below this area would signal a potential trend change or larger correction towards 125,000 and then 122,000.
## Resistance zones
- The first and most important resistance is the recent high and channel top region near 131,200–131,500, where repeated rejections suggest strong sellers.
- If price can close firmly above this band, the channel’s upper projection opens room for further upside, with next resistance coming from measured channel extension and recent technical levels around 133,000–133,500.
## Trading view
- As long as price stays inside the rising channel and above 127,100–127,200, the primary trend remains bullish and dips into support can be treated as buy‑on‑dip opportunities with tight risk control.
- A breakdown below the lower channel with volume would favor a shift to sell‑on‑rise, targeting the lower horizontal supports mentioned, while any fresh breakout above 131,500 would invalidate the short‑term bearish pullback idea and resume the up‑leg.
Gold TRY per gram Futures
No trades
Trade ideas
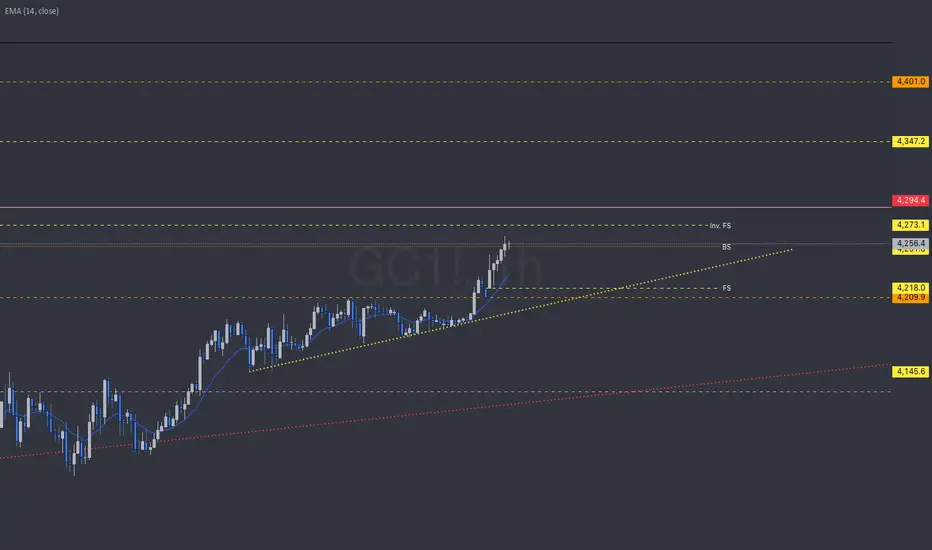
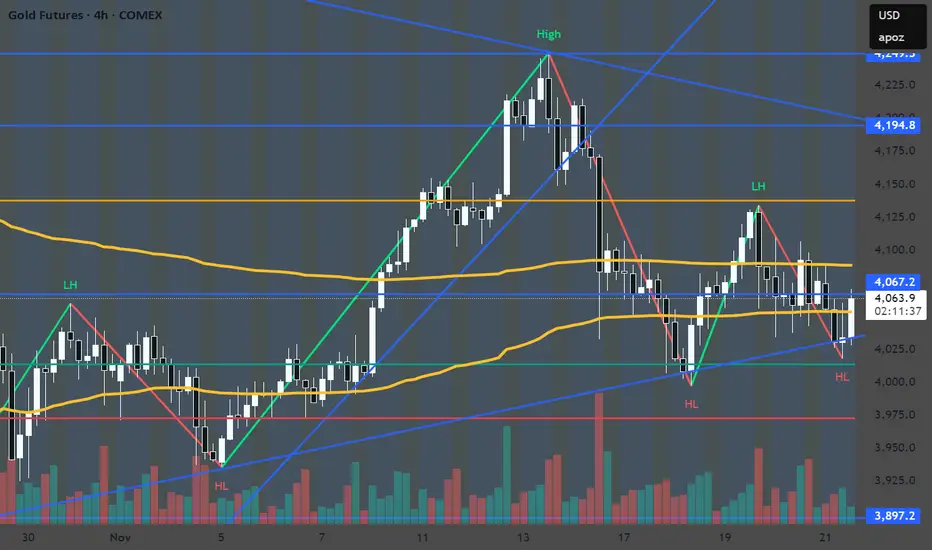
GC | Week 49 | 1hr chartT.A explained -
BackSide (BS)
FrontSide (FS)
Inverse BS (Inv.BS)
Inverse FS (Inv.FS)
BS & FS levels are expected support when dashed lines, tested when dotted and resistance when solid lines.
The inverse is true for the Inv. BS Inv. FS levels, they are resistance as dashed lines, tested as dotted and support as solid lines.
Monthly timeframe is color pink
weekly grey
daily is red
4hr is orange
1hr is yellow
15min is blue
5min is green if they are shown.
strength favors the higher timeframe.
2x dotted levels are origin levels where trends have or will originate. When trends break, price will target the origin of the trend. its math, when the trend breaks, the vertex breaks too so the higher timeframe level/trend that breaks, the more volatility there could be as strength in the orders flow in to fuel the move.
Gold MCX Future - Weekly Analysis - 1 to 5 Dec., 2025MCX:GOLD1!
Gold MCX Futures — Chart Pathik Weekly Levels for 01 to 05 Dec. 2025
(If these levels add value to your trades, a quick boost or comment goes a long way in supporting this free content and keeping our trading community thriving!)
Gold Futures are trading near 129,893, pulling back from early-week highs and hovering just below the Weekly Neutral Zone at 130,220, signalling a balanced tug-of-war between continuation bulls and mean-reversion bears. Price remains above key weekly long reference levels, keeping the broader structure constructive but vulnerable to deeper dips if supports fail.
Weekly Bullish Structure
Weekly long bias remains active as long as price holds above the W Long Entry zone at 128,641 and the W Add Long Position level at 128,126, where prior demand and breakout structure align.
Upside targets sit at 132,919 (W Long Target 1) and 134,587 (W Long Target 2), marking zones for positional booking if buyers regain control above the Neutral Zone.
Control: Positional longs can trail or define risk below the W Long Exit at 129,066 and more structurally below 128,126, where bullish weekly structure starts to weaken.
Weekly Bearish Structure
If price breaks and sustains below 128,126, focus shifts to the W Short Entry band around 127,610–127,518, where fresh selling pressure and failed retests of broken support can set up downside continuation.
Weekly downside targets lie at 127,521 (W Short Target 1) and 125,853 (W Short Target 2), providing zones for profit booking on swing shorts.
Control: Bears need to stay cautious on any sharp reclaim back above 129,066–130,220, where failed breakdowns can quickly flip back into a squeeze towards the weekly long targets.
Neutral & Trading Plan Context
130,220 acts as the Weekly Neutral pivot—while gold trades between roughly 129,066 and 130,220, expect range-bound swings suitable for tactical intraday/swing trades rather than aggressive weekly trend plays.
Every level is designed to give structure for both positional and intraday traders—plan entries around these zones, manage exits at targets, and let the chart work for you, not your emotions.
Boost or comment if these weekly levels support your preparation—help Chart Pathik keep delivering structured, high-quality analysis to more MCX traders!

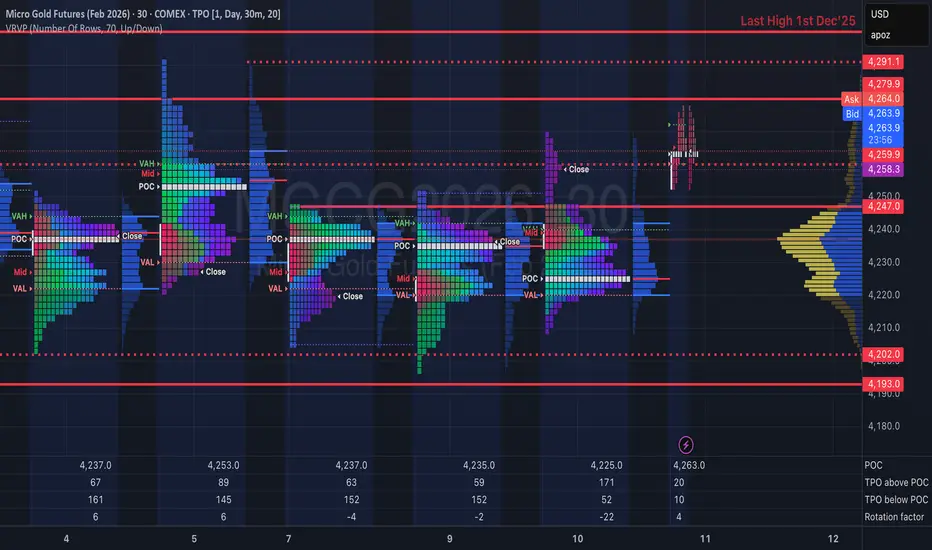
Gold on 01.12.2025Today’s move, right at the London open, pushed gold into the lower zone, where it can be observed that institutions were looking to sweep through the entire fair value area created the previous day. The peak of the move occurred during the cash session, after we reached the POC zone and the 0.6 Fibonacci levels. The rejection to the upside was quite aggressive.

Silver: A Sell Signal?COMEX: Micro Silver Futures ( COMEX_MINI:SIL1! )
What happened to the silver market? A previous all-time-high (ATH) record of $49.95 per ounce was set on January 17, 1980, and stood for 45 years until silver broke $50 in October 2025. Since then, silver prices kept climbing nonstop and setting new ATH records almost daily. Last Friday, November 28th, silver reached $56.86.
COMEX Silver Futures ( AMEX:SIL ) locked in an impressive 98% return year-to-date, which makes silver the top performer across all major asset classes year to date.
The strength of silver is supported by a confluence of factors including inflows into bullion-backed ETFs and expectations of a potential Federal Reserve interest rate cut. Investors rotated assets out of stock amid recent market weaknesses, benefiting the safe-haven assets gold and silver. In addition, gold purchases have slowed in recent months due to the record high prices. Some investors may choose silver as an alternative hedging asset.
However, a key metric suggests that the tide is about to change.
A Refresher:
In my writing published on April 28th, I introduced the Gold-Silver Ratio, a financial term that measures the relative value of gold to silver. The Gold-Silver Ratio may be used as a buying or selling signal.
When to Buy Silver : A high Ratio, typically above the 95:1 mark, suggests that silver is undervalued relative to gold. This is often interpreted as a buying signal for silver.
• Recalling that in the April 28th writing, we explored the idea of buying silver at $33 when the Ratio stood at 100. Silver prices went up 72% since then.
When to Sell Silver : When the Ratio is low, say around 80:1, it indicates that silver is relatively expensive. Investors might consider selling silver and buying gold.
• As silver caught up with gold with its recent rally, the Ratio is declining all the way down to 74. This is a level indicating silver is very expensive relative to gold. From a mean-reversing point of view, the Ratio may rebound back to the 80-90 range soon.
In my opinion, gold could show more strength compared to silver in the new year.
• Global central banks have slowed gold purchases recently. Gold getting expensive did not cause the pause. Annual budget depleting may be a more plausible reason. A new year comes with new budget, and I expect central bank buying to resume in 2026.
• Silver is part precious metal and part industrial metal. Global GDP in 2026 is projected to slow to 2.9% to 3.1%, with downside risks from geopolitical tensions and trade policy uncertainty, according to the IMF. Industrial use of silver could slow as well.
• Expectations of Fed rate cuts are rising. The stock market could rally again, causing investors to rotate money out of safe-haven assets. In my opinion, gold could stand its ground better than silver, with central bank purchases serving as a key support. In this scenario, the Ratio rises because silver falling faster than gold.
Trade Setup with Micro Silver
Traders could apply the insights from the Gold-Silver Ratio with trading strategies using COMEX Micro Silver Futures ( AMEX:SIL ). There are a number of reasons why shorting silver makes sense:
• Traders expect mean-reversion of the Gold-Silver Ratio will occur soon.
• Investors expect Fed rate cuts to be bullish for stocks and bearish for precious metals.
• Traders with portfolio of spot silver or silver ETF want to hedge their positions.
The big advantages of using futures contracts are capital efficiency and leverage. Micro Silver contracts have a notional value of 1,000 troy ounces of silver. With Friday settlement price of $57.455, each January contract (SILF6) has a notional value of $57,455. Buying or selling one contract requires an initial margin of $4,000 at the time of writing. This suggests a built-in leverage of 14.4 (= 57455/4000) for futures contracts.
By putting a deposit equivalent to 70 ounces, traders could gain the full exposure of 1,000 ounces of silver. If silver prices move down by 10%, a short position in Micro Silver futures would gain 144% (= (57455*0.1) / 4000).
Micro silver futures (SIL, 1000 oz) and standard-size silver futures contracts (SI, 5000 oz) contracts together form a deep liquidity pool. On November 28th, SI had trade volume of 109,967 contracts and an open interest (OI) of 155,222 contracts. SIL had volume and OI of 79,015 and 14,900 contracts, respectively, according to data from CME Group.
To hedge the risk of rising silver prices, a trader could set a stoploss on his short-silver order. For illustration, a short order is executed at 57.455 with a stoploss at 59.0. If silver goes up 10% to $63.2, the maximum loss will be $1,545 (= (59-57.455)*1000), well within the margin account balance of $4,000.
Happy Trading.
Disclaimers
*Trade ideas cited above are for illustration only, as an integral part of a case study to demonstrate the fundamental concepts in risk management under the market scenarios being discussed. They shall not be construed as investment recommendations or advice. Nor are they used to promote any specific products, or services.
CME Real-time Market Data help identify trading set-ups and express my market views. If you have futures in your trading portfolio, you can check out on CME Group data plans available that suit your trading needs www.tradingview.com

GOLD (XAU-GC) BUY PLAN📊 Market Sentiment
Market sentiment for GOLD remains strongly bullish. One of the key drivers is the aggressive accumulation by global central banks. Recession concerns and persistent inflation fears continue to position gold as one of the most attractive safe-haven assets.
📈 Technical Analysis
Price has completed the expected accumulation phase and broke out strongly from the accumulation range. This former range has now turned into a clear demand zone. Price has pulled back into this zone again and is currently testing the $4060 level.
📌 Game Plan
The $4060–$3900 zone is my primary buy zone. I will continue accumulating within this range.
My first target is $4250, followed by $4400, which aligns with new all-time-high expectations.
If price closes below $3900 on the daily, this idea becomes invalid. Therefore, my stop is a daily close under $3900.
💬 If this breakdown aligns with your outlook, like and comment below.
For deeper sentiment and strategy insights, subscribe to my Substack free access available.
⚠️ This analysis is for educational purposes only and does not constitute financial advice. Always conduct your own research before trading or investing.

Gold Update 02DEC2025: Multiple Options Are PossibleThe price has been stuck in the range as expected for wave 4
Let’s navigate this chaos and build viable paths on the chart
Option 1: Ending Diagonal wave 5 — pink marks
This option is based on the idea that wave 4 looks disproportionately large compared to wave 2
It could already be over after the first large move down to the $3,900 area
The current ascending zigzag may be shaping an Ending Diagonal in wave 5 to retest the former top around $4,400
Option 2: Triangle — orange marks
I left this path on the chart last time for visualization and it still could play out
Waves A and B could be completed with waves C, D, E ahead
Option 3: Large sideways consolidation (range, box) — white marks
This scenario implies a flat correction within the established $4,400–$3,900 range
Which path do you think the price will take?
Share your thoughts in the comments below

Gold Feb Fut. MCX Intraday Technical Analysis - 2nd Dec., 25MCX:GOLD2!
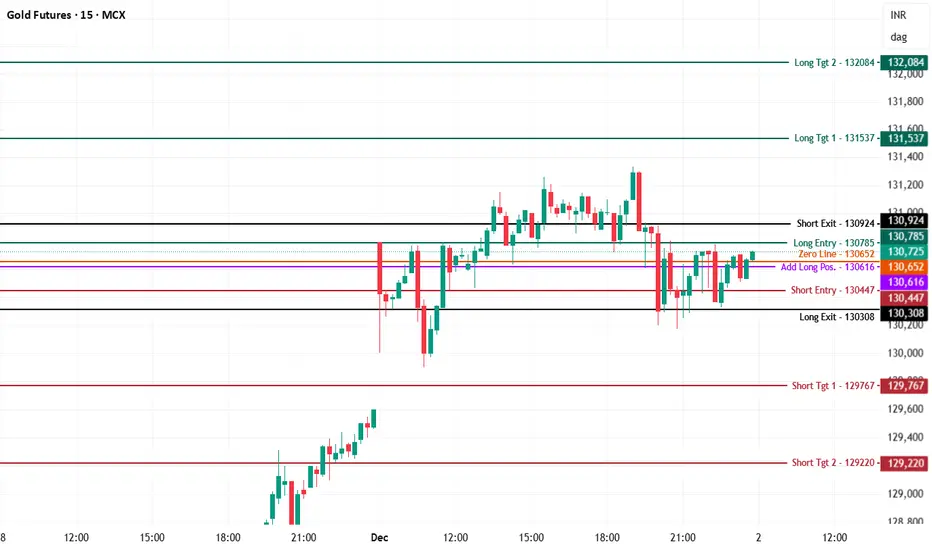
Gold MCX Futures — Chart Pathik Intraday Levels for 02-Dec-2025
(If these levels add value to your trades, a quick boost or comment goes a long way in supporting this free content and keeping our trading community thriving!)
Gold Futures are trading near 130,725, pushing just above the zero line at 130,652 and testing the Long Entry band at 130,785 after recovering from a sharp intraday dip, signalling an emerging bullish attempt against prior supply. Each comment or share builds the momentum for disciplined, structured analysis across our trading community!
Bullish Structure
Longs activate above the Long Entry level at 130,785, with stronger conviction if price sustains above the zero line at 130,652 and holds the Add Long Position level at 130,616 as support on intraday pullbacks.
Targets: 131,537 (Long Target 1 / primary booking zone) and 132,084 (Long Target 2 / extended upside leg on strong breakout).
Control: Place stop or trail near 130,447–130,308 (Short Entry and Long Exit band) to keep risk defined while bullish structure remains active.
Bearish Structure
Shorts open below the Short Entry level at 130,447 or on clear rejection between 130,785 and the Short Exit supply zone at 130,924 after failed upside attempts.
Targets: 129,767 (Short Target 1 / partial or scalp booking) and 129,220 (Short Target 2 / extended downside if breakdown sustains).
Control: Fast short covers are required back above 130,785–130,924 where bearish structure weakens and trapped shorts risk a squeeze.
Neutral Zone
130,652 is today’s inflection and zero line—expect sideways, noisy moves while gold oscillates between roughly 130,447 and 130,785 without decisive 5-minute closes outside this band.
Every setup is designed for structure, plan, and logic—let the chart work for you, not your emotions.
Boost or comment if these levels help your preparation—help Chart Pathik keep delivering quality analysis to more intraday traders!
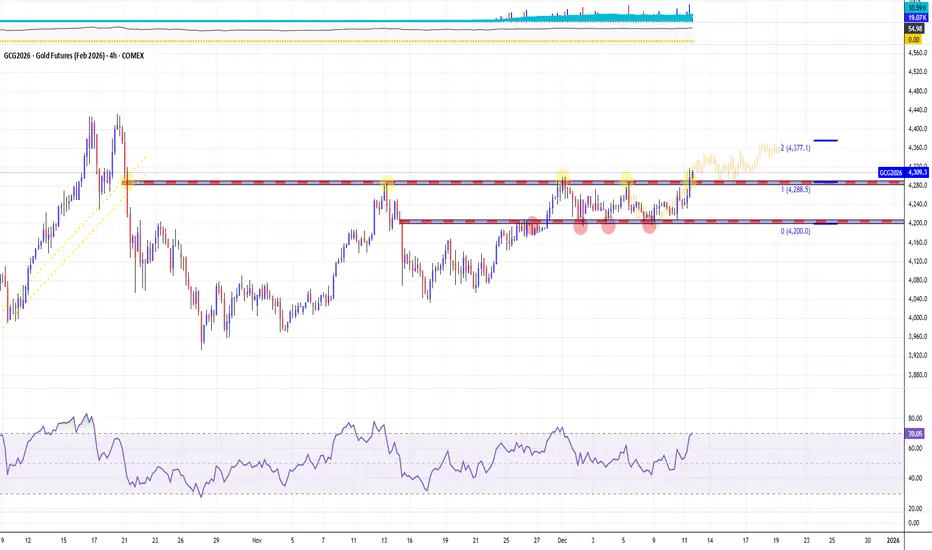
Triple Top - Double Bottom. Go Next Golden Shift4125 for a potential reload (supply area). 4275 - to make it all back.

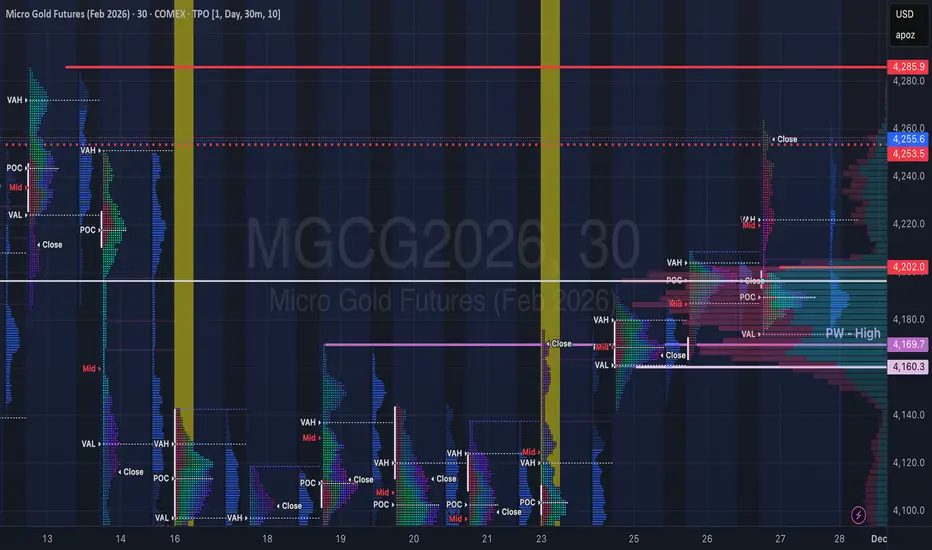
Gold Context: December Open & Holiday Inventory CheckCOMEX_MINI:MGCG2026 COMEX:GC1!
Traders. Here is the context update as we transition into the new month.
Market Context (Holiday Drift): The auction drifted higher on thin volume during the Thanksgiving and Black Friday shortened sessions. This extension was largely driven by a lack of sellers rather than aggressive buying, leaving us with a "thin" structure.
Structure & Inventory: We have significant inventory resting back at 4200 – 4170, sitting just above the Previous Week High (PWH).
Current Action: Price is holding the holiday extension.
The Problem: The move up lacks heavy volume support. We have "unfinished business" below at the breakout zone.
Plan & Execution: Monday marks the start of fresh December flows. I am not interested in chasing this extension at these highs.
Stance: Flat / Patient.
The Test: I want to see Gold rotate back to test the inventory at 4200 – 4170 first.
Decision: We need to verify if buyers will defend this zone (turning old resistance into support) before committing to a new directional bias.
Talk to you for the next update.
GC UpdateSilver looks topped out, and gold moving down as well. I think I'll wait for indicators this time, lol.
I exited out of the trade a bit early last week because ES1! had an open gap that I knew would fill, and I wasn't sure if gold would go down with the stock market.
With silver going parabolic, and gold following the same direction, I think this might be a difficult trade to track, but I'll give it a go, lol.

Gold holding trendline push towards 4194 possibleA Long position towards 4194 is likely as we see that this trendline holds firm.
Multi Top - Multi Bottom. Go Next Your Golden Shift4300 to brace a bag (supply area). 4375 extension - to make it back.
Gold Short-Term Correction vs. Long-Term Bullish Thesis
Key Structural Analysis
The "Big Triangle" (or Consolidation): Price has been consolidating for a long period, forming a large symmetrical or ascending triangle pattern. This pattern represents a period of quiet accumulation and decreasing volatility—the "calm before the storm."
The Final Correction: The recent price action (the Double Top/Neckline break on your 1H chart) is the final, sharp correction that occurred above the triangle's key support trendline. This move is designed to:
the Breakout Level: Re-test the top boundary of the previous triangle/consolidation range, turning old resistance into new, strong support.
Shake Out Weak Buyers: Force short-term traders out of their long positions before the major move.
Breakout Imminent: With the correction completed (or nearing its completion), the price is now coiled and positioned for the final bullish breakout above the most recent peak.
Trade Thesis: Patience for the Big Move
Risk Area: The current weakness is simply the market testing the patience of traders. Shorts are capitalizing on the Double Top, but their upside is structurally limited by the Big Triangle's support.
The Target : Once the price confirms the breakout from the current correction's high, the measured move will be based on the height of the entire Big Triangle, projecting a massive, long-term target in line with the major bullish fundamentals (rate cuts).


Post-FOMC Context: Policy Divergence & Inventory AdjustmentCOMEX:GC1! FOREXCOM:XAUUSD COMEX_MINI:MGCG2026
Analysis
1. Macro Context (The Currency Auction)
The structural bid for the USD remains valid due to clear Policy Divergence .
* The Fed: The "Hawkish Cut" (25bps) coupled with the signal for a "slower pace" (only one cut projected for 2026) confirms a pivot to a "pause" to verify data.
* The ECB: Conversely, Europe is cutting into economic weakness.
* Implication: This widening rate spread creates a fundamental floor. The recent drop in DXY displays the characteristics of a Liquidation Break (inventory adjustment) rather than a structural reversal. The market flushed weak, crowded longs, but value has not migrated lower.
2. Gold Auction Analysis (Emotional Structure)
The post-FOMC rally in Gold displays the hallmarks of an Emotional Trade .
* Structure: The vertical move has left behind Low Volume Nodes (LVNs) and single prints. This indicates the auction was driven by mechanical short covering rather than initiative buying, leaving a "poor" or "thin" structure.
* The Test: We are trading into Higher Time Frame (HTF) resistance.
* Scenario A: For a credible attempt at ATH, we require New Money (OTF) to step in and backfill these LVNs—converting the thin structure into accepted value.
* Scenario B: Without sustained OTF participation, the probability favors a rotation back to value to repair the poor structure. Emotional rallies often fade once the short covering inventory is depleted.
3. ES Context (Liquidity Window)
The "Hawkish" pause signal removes the "easy money" narrative for 2026. If 10Y yields break higher, the ES auction is vulnerable to its own liquidation break as participants adjust to the new rate path.
Plan & Execution
* Gold: Caution on the long side at these highs. The structure is fragile. Monitoring for a fade back to value versus genuine acceptance.
* DXY: Expect two-way trade as the liquidation stabilizes and inventory balances.
Talk to you for the next update.
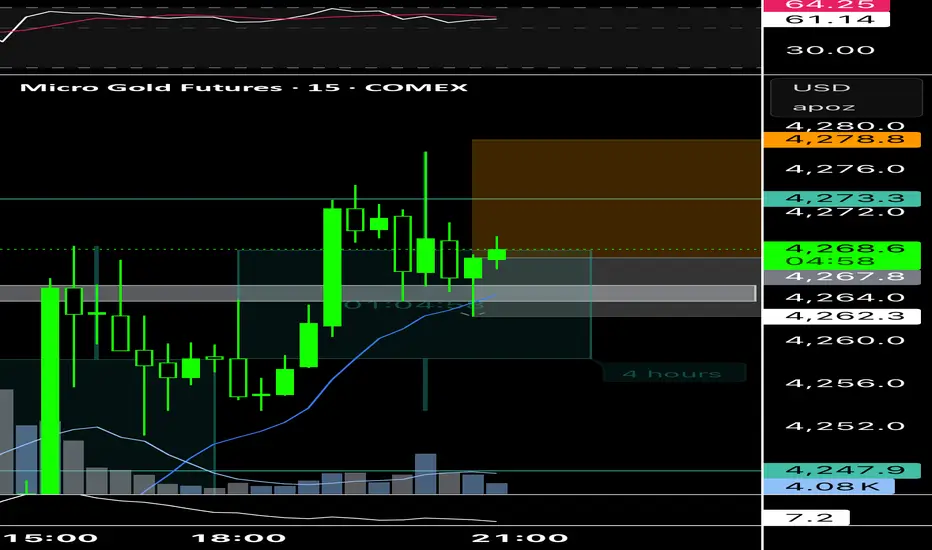
Buy GCGC tested my level of interest according my morning analysis. Buying gold based on 15M engulfing candle

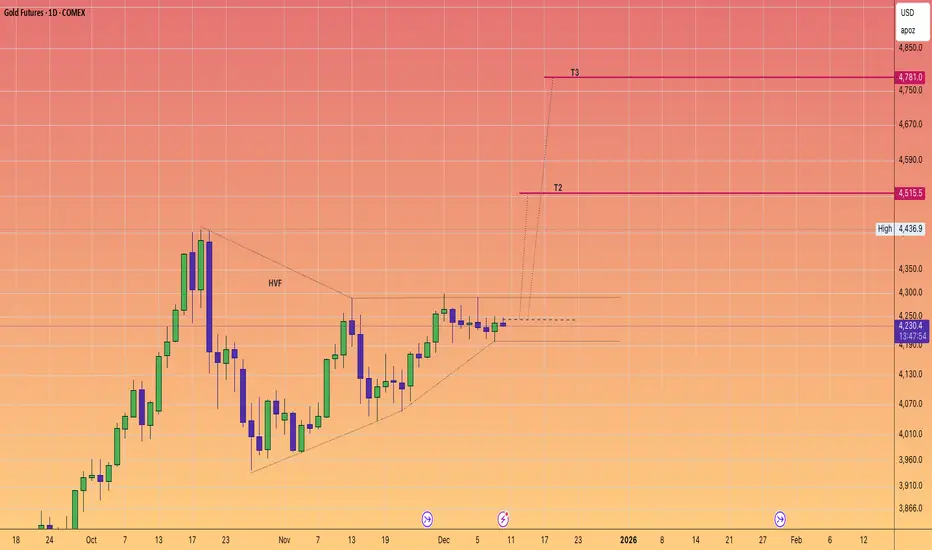
GOLD in a windup. Targets $4800AS we progress ever closer to the quite historic level of $5k for #GOLD
We note that Gold has been quite predictable and routinely has delivered +20% powerful moves since 2024.
The price action currently suggests we are about have another pop very soon.
Will it be enough to tag the $5K level
odds suggest that it definitely on the table.
The #HVF pattern points to $4800 and with some over performance we are right on that doorstep.
Selling GCBased on my morning analysis selling GC from Daily range high to the middle of the range. Going for 1:2 RR
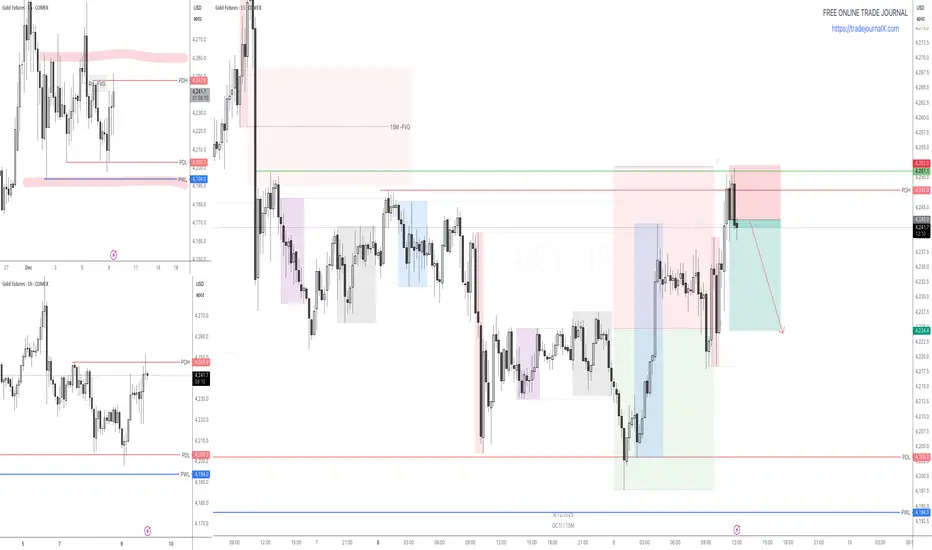
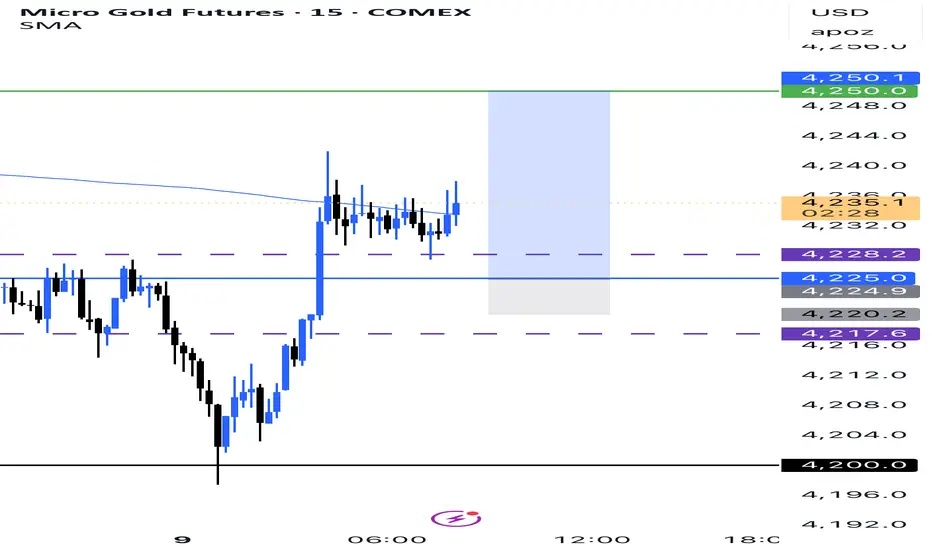
Gold Context: Reclaiming 4227 & Follow-Through FlowsFOREXCOM:XAUUSD COMEX_MINI:MGCG2026 COMEX:GC1!
Traders. Pre-US Open update on the developing structure.
Market Context (Reclaiming Value):
Gold has successfully rotated back above 4227, reclaiming Friday's trading range.
• The Flow: We observed initial short covering that found genuine follow-through. This indicates that the market is not just covering shorts but finding acceptance at these higher prices.
• Structural Shift: By trading back inside Friday's range, the auction has negated the immediate bearish pressure seen at the lows.
Structure & Outlook:
• The Pivot (4227): This level is now our key reference. As long as Gold facilitates trade above 4227, the bias remains constructive (Long).
• The Target: The immediate destination for this rotation is 4250.
• Condition: We need to see the US Open maintain this bid and not fall back below the 4227 shelf.
Plan & Execution:
• Bias: Long / Constructive.
• Invalidation: A failure to hold 4227 would put the auction back into a weak position.
Talk to you for the next update.
