DOLLAR INDEX (DXY): Confirmed Bullish ContinuationThe DOLLAR INDEX appears to be showing bullish tendencies from both daily and intraday perspectives.
From a daily timeframe, I observe a confirmed breakout of a resistance line within a symmetrical triangle pattern, indicating a trend violation and continuation.
On an hourly timeframe, we see a breakout of a resistance line of a bullish flag pattern, followed by a strong bullish movement.
I anticipate that the market will continue to grow.
The next resistance level is identified at 99.53.
Trade ideas

DXY Approaching 98.900 — Weak Labor Market Could Push Fed DovishHey Traders, in today’s trading session we’re monitoring DXY for a potential selling opportunity around the 98.900 zone.
The index continues to trade within a descending channel and is currently in a correction phase, approaching the upper boundary near 98.900, which aligns with channel resistance.
Fundamentals: Recent data continues to show signs of a weakening U.S. labor market, with job growth slowing and unemployment ticking higher. This softening backdrop increases pressure on the Federal Reserve to adopt a more dovish stance in upcoming meetings, potentially weighing further on the dollar.
Next move: Watching for bearish confirmations around the 98.900 zone — rejection here could resume the broader downtrend.
💬 What’s your outlook on the Fed’s next move? Drop your thoughts in the comments!

DXY - will we see a bullish divergence?Hello, dear traders. We can observe an interesting situation on the Dollar Index.
What we see:
1. An uptrend on the weekly timeframe.
2. The price is at the support level.
3. Over the 18 years of this trend, all impulses from the support level originated after MACD divergence. For divergence, we need at least two troughs, but now we are seeing only one.
Therefore, I expect another decline in the Dollar Index with an update of the low on closed weekly candles. After that, for a reversal according to my author's FRL concept, it is necessary to form a multi-day reversal pattern. At the moment, the neck level is at 100.200, as this is where the last impulse of the last downtrend originated. If the price does indeed update the low and form a divergence, the neck level will be at 99.500.
How do you rate this idea and what are your thoughts on it?

Forex Traders Focus on Central Bank DecisionsForex Traders Focus on Central Bank Decisions
As expected, the Federal Reserve yesterday cut the Federal Funds Rate from 4.25% to 4.00%, while Jerome Powell’s remarks reduced the likelihood of further rate cuts. Meanwhile, decisions by other key central banks are also influencing the currency markets, according to Forex Factory:
→ The Bank of Canada lowered its policy rate from 2.50% to 2.25%, in line with market expectations. Its official statement highlighted risks of slower GDP growth, “continued weakness in the economy”, and concerns over U.S. trade relations and tariffs.
→ The Bank of Japan (BoJ) kept interest rates unchanged but signalled readiness to raise borrowing costs if economic conditions allow. This has shifted traders’ focus towards a possible rate hike as early as December.
→ The European Central Bank (ECB) is expected to leave its key rate steady, with the decision due at 16:15 GMT+3 today.
→ Next week, both the Reserve Bank of Australia and the Bank of England are scheduled to announce their policy decisions.
Against this backdrop, attention is increasingly turning to the Dollar Index (DXY) chart today.
Technical Analysis of the DXY Chart
On 19 September, we conducted a key analysis of the DXY chart, noting that:
→ The long-term downward channel (shown in red) remains relevant, divided into quarters by the intermediate QL and QH lines.
→ The index had rebounded from the QL line (marked by an arrow).
→ A bullish scenario was emerging.
Following that rebound, the price began to form an upward trajectory, reaching the upper boundary of the channel by 10 October — which, as anticipated, acted as strong resistance.
Currently, the DXY chart displays a narrowing triangle pattern, where:
→ The resistance is defined by the upper edge of the long-term descending channel that has contained the index’s 2025 movements.
→ The short-term upward channel from the September low remains intact.
This formation may reflect both the current balance of the U.S. dollar against a basket of major currencies and the uncertainty among analysts about its future direction.
Given the combination of central bank decisions, the U.S. government shutdown, geopolitical risks, and trade tensions, a breakout from this triangle could mark the start of a major trend lasting several weeks or even months.
Yesterday’s Fed decision strengthened the dollar, breaking through a local Bullish Flag pattern (shown in blue) and increasing the likelihood of further upward momentum.
This article represents the opinion of the Companies operating under the FXOpen brand only. It is not to be construed as an offer, solicitation, or recommendation with respect to products and services provided by the Companies operating under the FXOpen brand, nor is it to be considered financial advice.

US Dollar: Bullish-Neutral. Buys Are Valid As +FVG Holds!Welcome back to the Weekly Forex Forecast for the week of Oct 27 - 31st.
In this video, we will analyze the following FX market: USD Dollar
The USD didn't move a lot last week, but it did move higher with Monday and Tuesday moves. The rest of the week was sideways, but it held above the +FVG. As long as the +FVG holds, prices should continue higher.
A candle body close below the +FVG will be a bearish indication.
Mindful that FOMC is Wednesday. That is decision day for the markets. Don't jump into long term moves until after the announcements for Wednesday.
Enjoy!
May profits be upon you.
Leave any questions or comments in the comment section.
I appreciate any feedback from my viewers!
Disclaimer:
I do not provide personal investment advice and I am not a qualified licensed investment advisor.
All information found here, including any ideas, opinions, views, predictions, forecasts, commentaries, suggestions, expressed or implied herein, are for informational, entertainment or educational purposes only and should not be construed as personal investment advice. While the information provided is believed to be accurate, it may include errors or inaccuracies.
I will not and cannot be held liable for any actions you take as a result of anything you read here.
Conduct your own due diligence, or consult a licensed financial advisor or broker before making any and all investment decisions. Any investments, trades, speculations, or decisions made on the basis of any information found on this channel, expressed or implied herein, are committed at your own risk, financial or otherwise.

DXY: Absolute Price Collapse Ahead! Short!
My dear friends,
Today we will analyse DXY together☺️
The recent price action suggests a shift in mid-term momentum. A break below the current local range around 98.412 will confirm the new direction downwards with the target being the next key level of 98.328 and a reconvened placement of a stop-loss beyond the range.
❤️Sending you lots of Love and Hugs❤️

DXY Bullish outlookdxy h4 making higher highs and higher lows .
Price traded into and respected the daily bullish OB + FVG + IFVG
Targeting big figure 100.000

check the trendIt is expected that the upward trend will advance to the resistance trend line and also the 78.6% level. Then there will be a possibility of a trend change.

DXY has started a new long-term Bullish Leg to 103.500.Four months ago (June 26, see chart below) we gave a strong Buy Signal on the U.S. Dollar Index (DXY), which in a month's time it hit our 100.000 Target:
Now we see the 3-year Channel Down starting the next Bullish Leg having priced its bottom (Lower Low) on September 17. As you can see this is almost the exact same triple Lower Lows bottoming process as in 2023, using also the same Fibonacci retracement levels as Targets. We have the huge 1W RSI Bullish Divergence to also confirm this.
Based on this symmetry, we have started a Bullish Leg similar to July's 2023. That peaked marginally below the 0.5 Fibonacci level. As a result, we expect DXY to target at least 103.500 by early 2026.
-------------------------------------------------------------------------------
** Please LIKE 👍, FOLLOW ✅, SHARE 🙌 and COMMENT ✍ if you enjoy this idea! Also share your ideas and charts in the comments section below! This is best way to keep it relevant, support us, keep the content here free and allow the idea to reach as many people as possible. **
-------------------------------------------------------------------------------
💸💸💸💸💸💸
👇 👇 👇 👇 👇 👇

DXY — The Dollar Game That Moves Everything...Hello Traders 🐺
Most traders keep watching Bitcoin, Gold, and the stock market...
but everything starts with the Dollar — the DXY.
DXY measures the strength of the US Dollar against major currencies (mostly the Euro, Yen, and Pound).
When DXY goes up, the Dollar is stronger.
When it goes down, the Dollar weakens.
Now here’s the fun part 👇
| Asset | When DXY goes UP | When DXY goes DOWN
| 🪙 Gold | Usually drops (USD stronger) | Usually rises
| 💰 Bitcoin | Liquidity dries up → often drops | Liquidity returns → often rallies
| 📈 Stocks | Exporters get hurt | Risk-on mood, often bullish
| 🛢 Oil | Demand cools | Prices rise with weaker USD
So yeah — DXY isn’t “just another chart.”
It’s the heartbeat of global liquidity.
⚙️ What’s happening right now
Gold is at record highs.
Bitcoin’s flying near extreme levels.
Stocks are still holding up.
Meanwhile, DXY is sitting right on a major monthly trendline support —
a level that’s held multiple times in the past.
Most traders expect the Dollar to keep weakening
after the Fed’s recent 0.25% rate cut...
but history often plays a different game.
📉 The pattern nobody talks about
Every time the US entered a recession,
the Dollar actually got stronger, even while the Fed was cutting rates.
Why? Because when fear hits, everyone runs to cash and US Treasuries.
The Dollar becomes the world’s safe haven.
So lower rates don’t always mean a weak dollar —
sometimes they’re the first warning that the system’s under stress,
and that’s exactly when DXY makes its comeback.
🇺🇸 Politics, China, and the bigger picture
Trump’s talking about another trade war with China.
China’s still trying to strengthen the Yuan and reduce its dependence on USD.
But the US can’t really afford a weak dollar right now —
because a weaker USD means more imported inflation,
and with America’s massive debt and deficits,
they need global demand for US Treasuries.
That only happens if the Dollar stays relatively strong.
🧭 My personal take
The market’s way too confident that “the Dollar is done.”
But both the chart and the history say otherwise.
DXY is testing a massive monthly trendline support while risk assets are near all-time highs.
That’s a setup I don’t want to ignore.
If DXY bounces from here,
we could see a wave of correction across Gold, Bitcoin, and even stocks.
💡 Everyone’s positioned for a weak Dollar.
History and the chart both say — it might surprise them again.
Also don't forgot our golden rule :
🐺 Discipline is rarely enjoyable , but almost always profitable. 🐺
🐺 KIU_COIN 🐺

DOLLAR INDEX (DXY): More Growth Ahead
A quick follow-up for the yesterday's idea for Dollar Index.
The market successfully violated a resistance line of a symmetrical triangle
pattern on a daily time frame.
We see its retest this morning.
A confirmed bullish CHoCH on an hourly time frame gives us a strong
intraday bullish confirmation.
There is a high chance that the Index will continue rising.
Goal - 99.35
❤️Please, support my work with like, thank you!❤️
I am part of Trade Nation's Influencer program and receive a monthly fee for using their TradingView charts in my analysis.

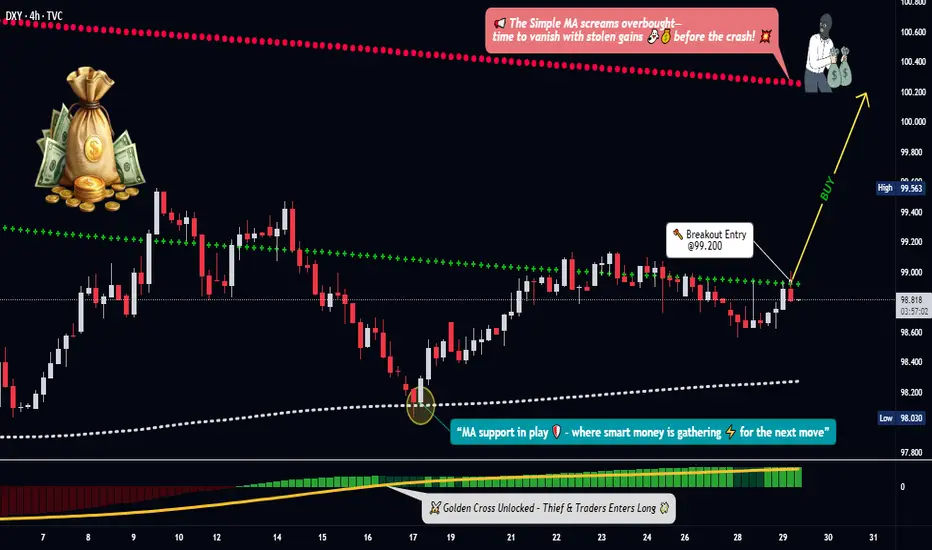
DXY Breakout Map — Is the Dollar Index Ready for a Power Move?🎯 DXY BULLISH BREAKOUT: The "Limit Order Layup" Strategy 🚀
Hey Thief OGs! 👋 The King Dollar 👑 is getting ready for a potential rally, and we've got the map 🗺️ to navigate it. This is a swing/day trade plan focusing on a classic technical setup with a tactical entry twist.
📈 The Overall Plan (Bias): BULLISH 🐂
The strategy waits for a bullish confirmation using a Simple Moving Average (SMA) pullback 🔙 followed by a MACD golden cross ✨. We're buying the dip, expecting a continuation upward 📊.
⚡ The Thief's Entry Tactic (The "Layering Method") 🎁
The key is patience and precision. We don't chase the price.
✅ Wait for the Trigger: Confirm a daily close ABOVE 99.200.
🎯 Deploy Limit Orders: After the breakout, set multiple buy limit orders at key support levels to get a good average entry price.
Suggested Layers: 🟢 98.400, 🟢 98.600, 🟢 98.800, 🟢 99.000
💡 Pro Tip: You can adjust the number of layers and levels based on your own risk appetite!
🛡️ Risk Management (The Escape Plan) 🚨
Stop Loss (SL): A hard stop is placed at 98.200. This level is the line in the sand – if price breaks below here, our thesis is likely invalid ❌.
⚠️ Note: Dear Ladies & Gentleman (Thief OGs), I do not recommend you set only my SL. It is your own choice. You can make money, then take money at your own risk.
🎯 Profit Targets (The Getaway) 💰
Take Profit (TP): We are targeting 100.200. This zone aligns with where the Moving Average may act as strong resistance, and the market could become overbought. When the trap is set, we escape with profits! 🏃♂️💨
⚠️ Note: Dear Ladies & Gentleman (Thief OGs), I am not recommending you set only my TP. It is your own choice. You can make money, then take money at your own risk.
🔍 Related Pairs to Watch & Key Correlations 🌐
The DXY doesn't move in a vacuum. Keep an eye on these:
EUR/USD ( FX:EURUSD ): 👑 The inverse king. A rising DXY typically means a falling EUR/USD 📉.
GBP/USD ( FX:GBPUSD ): Similar to the Euro, a strong dollar often pressures Cable downward 📉.
Gold ( OANDA:XAUUSD ): 🪙 Gold is priced in USD. A stronger dollar can make gold more expensive for other currencies, often putting downward pressure on it 📉.
USD/JPY ( FX:USDJPY ): A strong dollar trend usually powers USD/JPY higher 📈.
Key Point: If our DXY bullish idea is correct, you should generally see EUR/USD and GBP/USD weakening 📉, and USD/JPY strengthening 📈.
✨ “If you find value in my analysis, a 👍 and 🚀 boost is much appreciated — it helps me share more setups with the community!”
#DXY #TradingSetup #SwingTrading #Forex #DollarIndex #TradingStrategy #MACD #TechnicalAnalysis #LimitOrder
DXY Turning Bullish TVC:DXY Hammer candle through the bullish 0.382 combined with a macro demand line suggests this area will be moving on up soon. A shot to retest upper resistance is most likely underway. With the slightly lower low (Secondary Test) that printed in September, this area looks like accumulation and adds further bullish impetus (signaling risk-off behavior). High potential for a change in momentum for the U.S.$ and consequently capital in the market in the weeks/months to come.
-Not Financial Advice-

U.S Dollar IndexDXY
- Bearish Channel as an corrective pattern in Short Time Frame
- RSI - Divergence
- Order Block
- Demand Zone
- Change of Characteristics

DXY WEEKLY FRGNT FORECAST - Q4 | W44 Y25 |📅 Q4 | W44 Y25 |
📊 DXY WEEKLY FRGNT FORECAST
🔍 Analysis Approach:
I’m applying Smart Money Concepts, focusing on:
Identifying Points of Interest on the Higher Time Frames (HTFs) 🕰️
Using those POIs to define a clear trading range 📐
Refining those zones on Lower Time Frames (LTFs) 🔎
Waiting for a Break of Structure (BoS) for confirmation ✅
This method allows me to stay precise, disciplined, and aligned with the market narrative, rather than chasing price.
💡 My Motto:
"Capital management, discipline, and consistency in your trading edge."
A positive risk-to-reward ratio, paired with a high win rate, is the backbone of any solid trading plan 📈🔐
⚠️ Losses?
They’re part of the mathematical game of trading 🎲
They don’t define you — they’re necessary, they happen, and we move forward 📊➡️
🙏 I appreciate you taking the time to review my Daily Forecast.
Stay sharp, stay consistent, and protect your capital
— FRNGT 🚀
TVC:DXY

Dxy Analysis Pre-FOMC 29-Oct-25The Dxy has been rejecting the 99 level since last week.
With the lack of economic data due to US Government Shutdown, the markets main focus now is on todays FOMC meeting.
25Bps is already priced in, so what will be more important is the tone and forward guidance we could get from Jerome Powell.
* If we see a surprising 50Bps cut, or the 25 bps cut with dovish tone: this could lead dollar index to break below 98.3 & test the 97.3 level. Even with potential to break lower into the 96 price level once again.
* 25bps with neutral tone: Since already priced in, and nothing new will be given to the markets, Dxy could be testing the 99 level, and keep trading in a consolidation range between the 98 and 99.
* No cut, or 25bps with hawkish tone: Dxy could break above the 99 price level, with next area of interest to test which is the 100 level.
Disclaimer: easyMarkets Account on TradingView allows you to combine easyMarkets industry leading conditions, regulated trading and tight fixed spreads with TradingView's powerful social network for traders, advanced charting and analytics. Access no slippage on limit orders, tight fixed spreads, negative balance protection, no hidden fees or commission, and seamless integration.
Any opinions, news, research, analyses, prices, other information, or links to third-party sites contained on this website are provided on an "as-is" basis, are intended only to be informative, is not an advice nor a recommendation, nor research, or a record of our trading prices, or an offer of, or solicitation for a transaction in any financial instrument and thus should not be treated as such. The information provided does not involve any specific investment objectives, financial situation and needs of any specific person who may receive it. Please be aware, that past performance is not a reliable indicator of future performance and/or results. Past Performance or Forward-looking scenarios based upon the reasonable beliefs of the third-party provider are not a guarantee of future performance. Actual results may differ materially from those anticipated in forward-looking or past performance statements. easyMarkets makes no representation or warranty and assumes no liability as to the accuracy or completeness of the information provided, nor any loss arising from any investment based on a recommendation, forecast or any information supplied by any third-party.
Risk Warning: 74% of retail investor accounts lose money when trading CFDs with this provider. You should consider whether you can afford to take the high risk of losing your money. Please refer to our full risk disclaimer on our website.

DXY and EURUSD Consolidate Near Key Breakout LevelsOn the 4-hour chart, both DXY and EURUSD are consolidating near key levels, with DXY leaning bullish and EURUSD leaning bearish.
DXY Outlook
A breakout above 99.15 could redirect gains toward 99.50, setting up another test before confirming a move higher toward 100.20 (July 2023-September 2024 resistance), then 101 and 103.
On the downside, a hold below 98.80 could extend the consolidation between 98.60 and 98.40.
EURUSD Outlook
A breakout below 1.1600–1.1560 could extend the decline toward 1.1520, with deeper losses possible toward 1.1480 and 1.1380.
From the upside, holding above 1.1620 may allow a rebound toward 1.1680 and 1.1730, before targeting yearly highs if momentum builds further.
Razan Hilal, CMT

Bearish reversal?The US Dollar Index (DXY) is reacting off the pivot which is a pullback resistance and could drop to the 1st support.
Pivot: 98.93
1st support: 98.09
1st Resistance: 99.54
Disclaimer:
The above opinions given constitute general market commentary, and do not constitute the opinion or advice of IC Markets or any form of personal or investment advice.
Any opinions, news, research, analyses, prices, other information, or links to third-party sites contained on this website are provided on an "as-is" basis, are intended only to be informative, is not an advice nor a recommendation, nor research, or a record of our trading prices, or an offer of, or solicitation for a transaction in any financial instrument and thus should not be treated as such. The information provided does not involve any specific investment objectives, financial situation and needs of any specific person who may receive it. Please be aware, that past performance is not a reliable indicator of future performance and/or results. Past Performance or Forward-looking scenarios based upon the reasonable beliefs of the third-party provider are not a guarantee of future performance. Actual results may differ materially from those anticipated in forward-looking or past performance statements. IC Markets makes no representation or warranty and assumes no liability as to the accuracy or completeness of the information provided, nor any loss arising from any investment based on a recommendation, forecast or any information supplied by any third-party.

DXYDXY can have one more up and without breaking the top it can breakdown one more time.
Disclosure: We are part of Trade Nation's Influencer program and receive a monthly fee for using their TradingView charts in our analysis.

DXY FRGNT Daily Forecast -Q4 | W44 | D29| Y25 |📅 Q4 | W44 | D29| Y25 |
📊 DXY FRGNT Daily Forecast
🔍 Analysis Approach:
I’m applying Smart Money Concepts, focusing on:
Identifying Points of Interest on the Higher Time Frames (HTFs) 🕰️
Using those POIs to define a clear trading range 📐
Refining those zones on Lower Time Frames (LTFs) 🔎
Waiting for a Break of Structure (BoS) for confirmation ✅
This method allows me to stay precise, disciplined, and aligned with the market narrative, rather than chasing price.
💡 My Motto:
"Capital management, discipline, and consistency in your trading edge."
A positive risk-to-reward ratio, paired with a high win rate, is the backbone of any solid trading plan 📈🔐
⚠️ Losses?
They’re part of the mathematical game of trading 🎲
They don’t define you — they’re necessary, they happen, and we move forward 📊➡️
🙏 I appreciate you taking the time to review my Daily Forecast.
Stay sharp, stay consistent, and protect your capital
— FRNGT 🚀
TVC:DXY

DXY Double Top Rejection Still At PlayThe M formation I spoke about a week ago is still at play, and the gap I anticipated will get filled is still wide open.
I am bearish on DXY until confirmations to go bullish contradict my bias.

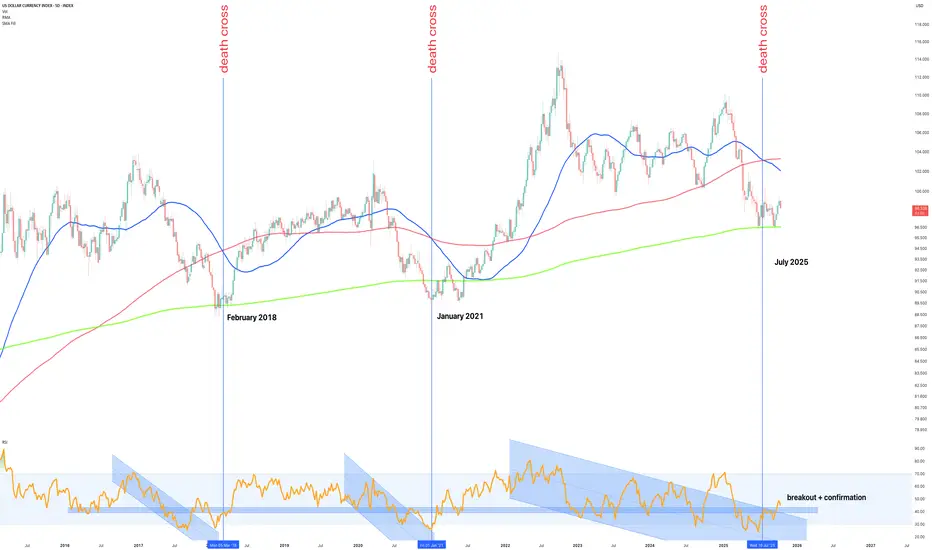
The Dollar Death Cross that marks the beginning – October 2025The term death cross often sends shivers through markets, but in the case of the US Dollar Index (DXY), it’s proven to be quite the opposite.
History tells us that every major death cross on the 5-day chart where the short-term 50 day simple moving average (SMA) crosses below the 200 day long term simple moving average (SMA), has in fact marked the end of a dollar downtrend, not the start of one. This is especially true after a test of the annual Rolling Moving Average (green line), as has just confirmed.
Look left:
February 2018, Death cross printed at the macro low. The dollar rallied for nearly two years.
January 2021, Death cross printed again, just before the dollar began its next sustained advance.
July 2025, Another death cross appears, once again coinciding with price touching the RMA, the same long-term structural support that has historically defined the beginning of each dollar bull cycle.
We can keep looking left if those last three dates do not satisfy, the story does not change, there is no “this time is different” while the DXY is in a macro uptrend.
Now, in October 2025, the RSI confirms a breakout from its multi-year descending channel, adding technical weight to what the moving averages are already signalling: the bear phase is likely over, and the next dollar bull market is quietly beginning. The 50 line is marked out, once it climbs above the rest is history.
What’s Next
Each of the prior bullish reversals began the same way:
1. Death cross, triggering capitulation sentiment.
2. Support test of the annual rolling moving average
3. RSI breakout and confirmation of trend reversal
That structure is now repeating almost perfectly.
If momentum follows prior cycles, the next 6–18 months could see the DXY recover toward the 105–110 zone, with potential for extension beyond 115 over the full bull phase.
A break and hold above 104 would confirm trend strength, while a close below the annual average around 96 would invalidate the structure and delay the signal.
This setup isn’t about calling tops or bottoms, it’s about recognising that death crosses on this timeframe have repeatedly marked strong uptrends for the dollar, not endings as the gold folks would have us believe.
Conclusions
The data is clear: every major death cross in recent DXY history has aligned with the start of a new bullish cycle. The 5-day structure, RSI breakout, and confirmation from the rolling annual average all point toward a macro reversal is underway.
The irony of the name death cross is not lost here, for the dollar, it often signals the exact opposite. If history rhymes once again, October 2025 will be remembered as the quiet beginning of the next US Dollar bull market.
Ww
==============================
Disclaimer
This post is for educational and informational purposes only and represents personal market analysis, not financial advice.
Currency markets are inherently volatile and influenced by complex macroeconomic factors. Always perform your own research, manage risk responsibly, and rely on confirmation, not emotion, when making trading or investment decisions.
Patience, data, and confirmation, the real currency of trading.
DXY FRGNT Daily Forecast - Q4 | W44 | D30| Y25 |📅 Q4 | W44 | D30| Y25 |
📊 DXY FRGNT Daily Forecast
🔍 Analysis Approach:
I’m applying Smart Money Concepts, focusing on:
Identifying Points of Interest on the Higher Time Frames (HTFs) 🕰️
Using those POIs to define a clear trading range 📐
Refining those zones on Lower Time Frames (LTFs) 🔎
Waiting for a Break of Structure (BoS) for confirmation ✅
This method allows me to stay precise, disciplined, and aligned with the market narrative, rather than chasing price.
💡 My Motto:
"Capital management, discipline, and consistency in your trading edge."
A positive risk-to-reward ratio, paired with a high win rate, is the backbone of any solid trading plan 📈🔐
⚠️ Losses?
They’re part of the mathematical game of trading 🎲
They don’t define you — they’re necessary, they happen, and we move forward 📊➡️
🙏 I appreciate you taking the time to review my Daily Forecast.
Stay sharp, stay consistent, and protect your capital
— FRNGT 🚀
TVC:DXY
