Nasdaq 100 Ahead of the HolidaysNasdaq 100 Ahead of the Holidays
As the chart shows, the Nasdaq 100 has rebounded from its roughly 2.5-month low recorded on 21 November. At that point, bearish sentiment was driven by fears of an “AI bubble”, expectations of higher interest rates, and other news-related pressures.
The recovery from that level was strong — in less than a week the index gained around 5.3%, signalling robust demand. This not only offsets last week’s concerns but also injects optimism into the near-term outlook.
Technical Analysis of the Nasdaq 100 Chart
Examining recent price action in the Nasdaq 100, we can outline an ascending channel in which:
→ the median line acted as support until mid-November;
→ support at the lower boundary helped form the 21 November low.
From the perspective of buying pressure:
→ The November dip appears to be an intermediate correction within a broader emerging uptrend.
→ The brief move below the psychological 24k level (where the notable September and October lows lie) resembles a Liquidity Grab pattern, suggesting so-called Smart Money may have used sellers’ liquidity to build long positions — a sign of bullish intent.
From the perspective of selling pressure:
→ the market remains within a corrective structure (highlighted in red);
→ today, the Nasdaq 100 is trading near 25,265, a level that acted as resistance on 17–20 November.
It is possible that trading near the channel’s median line will encourage a balance between buying and selling forces — just as market participants head off to celebrate Thanksgiving.
This article represents the opinion of the Companies operating under the FXOpen brand only. It is not to be construed as an offer, solicitation, or recommendation with respect to products and services provided by the Companies operating under the FXOpen brand, nor is it to be considered financial advice.
Trade ideas

NASDAQDO YOU KNOW WHATS BEHIND THIS OR OTHER IDEAS?? in bio.
Preferably suitable for scalping and accurate as long as you watch carefully the price action with the drawn areas.
With your likes and comments, you give me enough energy to provide the best analysis on an ongoing basis.
And if you needed any analysis that was not on the page, you can ask me with a comment or a personal message.
Enjoy Trading ;)


NASDAQ 100 BUYmy view on NASDAQ 100 is a buy, what i'm seeing is a pin bar on the 4hr timeframe and the market is trading above the minor zone on the daily timeframe. let the market play out

NASDAQ (US Tech 100) Price swept liquidity below a weak low, tapped into demand, and printed a bullish CHoCH, suggesting buyers are stepping in.
🟢 BUY Bias
Price is reacting from a discount zone + demand after a liquidity sweep. As long as we stay above the demand area, bullish targets remain valid.
🎯 Targets
TP1: 25,300
TP2: 25,600
TP3: 25,700+ (Liquidity at Strong High)
🔐 Stop-Loss: below 24,080 (beneath demand & sweep)

NASDAQ100 Breakout Watch — Is a New Upside Leg Starting Now?📈 NASDAQ100 Swing Trade Opportunity — Bullish Breakout Play
🟩 Asset: NASDAQ100 (Index CFD)
⚡ Trade Type: Swing Trade — Bullish Plan Confirmed
🧭 Trade Thesis
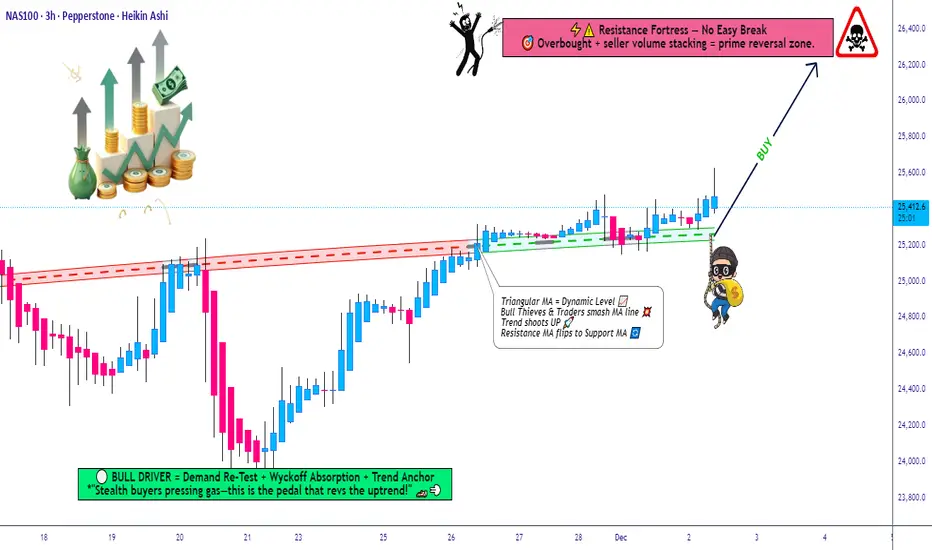
The index has confirmed a bullish setup following a Triangle + Moving Average breakout, strengthening upward momentum and favoring dip-buying behavior.
To reflect the Thief layering method, this plan uses multiple staggered limit orders to accumulate positions efficiently across volatility pockets.
📌 Entry Plan (Thief Layering Method)
💰 Entry Style: “Any price level allowed — Thief uses layers”
Buy Limit Layers:
24,900
25,000
25,100
25,200
(Feel free to increase or customize layers to fit your personal risk and liquidity preference.)
🛑 Stop-Loss (SL)
🔻 Thief SL: 24,500
Dear Ladies & Gentlemen (Thief OG’s), adjust SL based on your personal risk and strategy.
This is not a fixed recommendation, only a reference zone.
🎯 Target (TP)
⚡ The High-Voltage Electric Gate Zone around 26,200 acts as major resistance because of:
Overbought readings
High-liquidity trap behavior
Historical reversal probability
Exit with profits before heavy sellers activate.
Again — you decide your own TP based on your risk tolerance, not mine.
📊 Market Logic Behind the Move
Breakout structure confirmed
Trend continuation supported by triangle compression
Index ETF flows show short-covering + rotation back into tech
Momentum accelerates above 25,200 zones
Cleaner upside path until liquidity wall at 26,200
🔎 Related Pairs to Watch (Correlation Insight)
1️⃣ NASDAQ:NDX / NASDAQ:QQQ
Direct ETF mirror of NASDAQ100
Useful for checking volume, market depth, and real-time breakout confirmation
2️⃣ SP:SPX / NYSE:ES (S&P 500)
High correlation (approx. 0.85+)
A strong SPX supports tech continuation; weakness warns of index-wide pullback
3️⃣ TVC:VIX (Volatility Index)
Inverse correlation
If VIX stays below key volatility thresholds, bullish NASDAQ continuation is more reliable
4️⃣ FX:USDOLLAR / DXY
Tech usually performs better when the Dollar weakens
A rising Dollar can slow or cap NASDAQ bullish momentum
5️⃣ TVC:US10Y / Yields
NASDAQ moves inversely with yields
If yields drop, NASDAQ accelerates
If yields spike, prepare for turbulence or failed breakouts
📘 Summary
Bullish plan confirmed via Triangle + MA Breakout
Thief layering entries positioned smartly into volatility
SL/TP guidance flexible for trader customization
Strong correlation checks available across SP:SPX , TVC:VIX , TVC:DXY & yields
US100 Free Signal! Buy!
Hello,Traders!
US100 shows price reacting inside a horizontal demand zone, with a clean liquidity sweep beneath recent lows. Structure suggests a retest of demand before expansion, aiming toward the next intraday target above.
--------------------
Stop Loss: 25,115
Take Profit: 25,601
Entry: 25,309
Time Frame: 5H
--------------------
Buy!
Comment and subscribe to help us grow!
Check out other forecasts below too!
Disclosure: I am part of Trade Nation's Influencer program and receive a monthly fee for using their TradingView charts in my analysis.

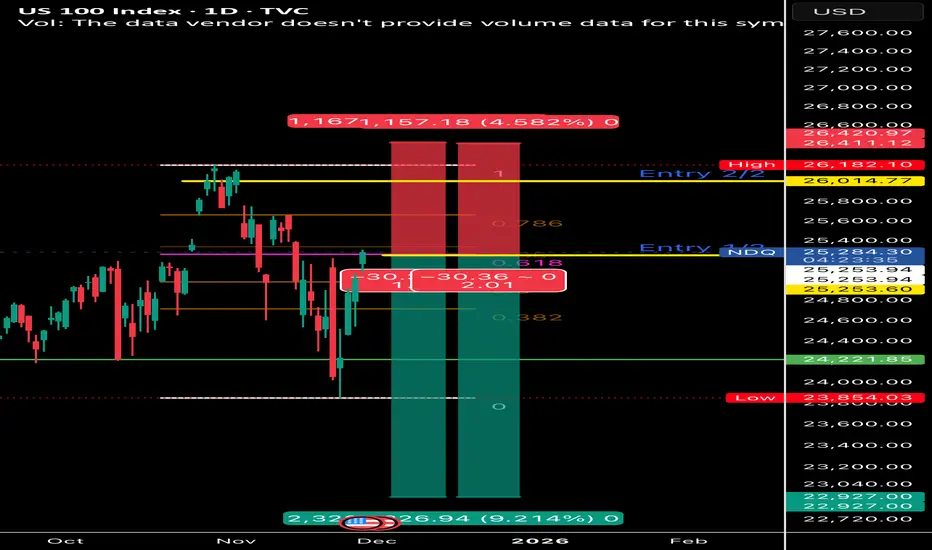
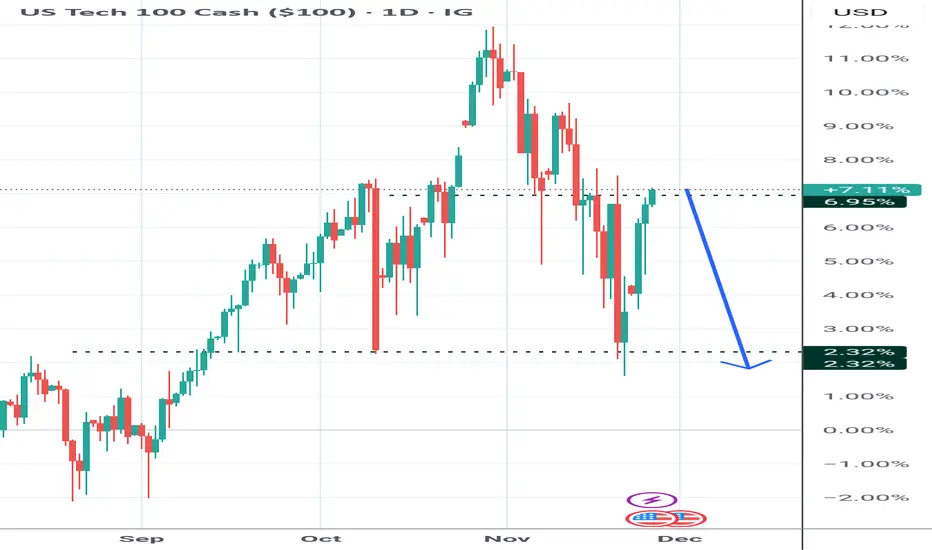
Short **Hedge** Predicting the double top on NDQ.Predicting the double top on NDQ.
I have longed a couple of assets i have been eying for a while during the correction at a good price, so this short is part of a hedging strategy I am taking.
2 entries, first (1/2) at fib 0.618 (reversed) the second (2/2) aiming for a double top.
My thought logic is like that:
If I fail to predict the double top on NDQ than my longs will most likely be much more profitable than my short.
US NAS 100DO YOU KNOW WHATS BEHIND THIS OR OTHER IDEAS?? in bio..
Preferably suitable for scalping and accurate as long as you watch carefully the price action with the drawn areas.
With your likes and comments, you give me enough energy to provide the best analysis on an ongoing basis.
And if you needed any analysis that was not on the page, you can ask me with a comment or a personal message.
Enjoy Trading ;)

NAS100How to become successful in forex and stock trading: 1.Master fundamentals and technical analysis. 2,Build and follow a solid trading plan. 3.Apply strict risk management (1–2% rule). 4.Stay disciplined—control fear and greed. 5.Record and analyze every trade. 6.Focus on high-quality setups only. 7.Diversify across assets and markets. 8.Keep evolving—study, adapt, and grow daily.
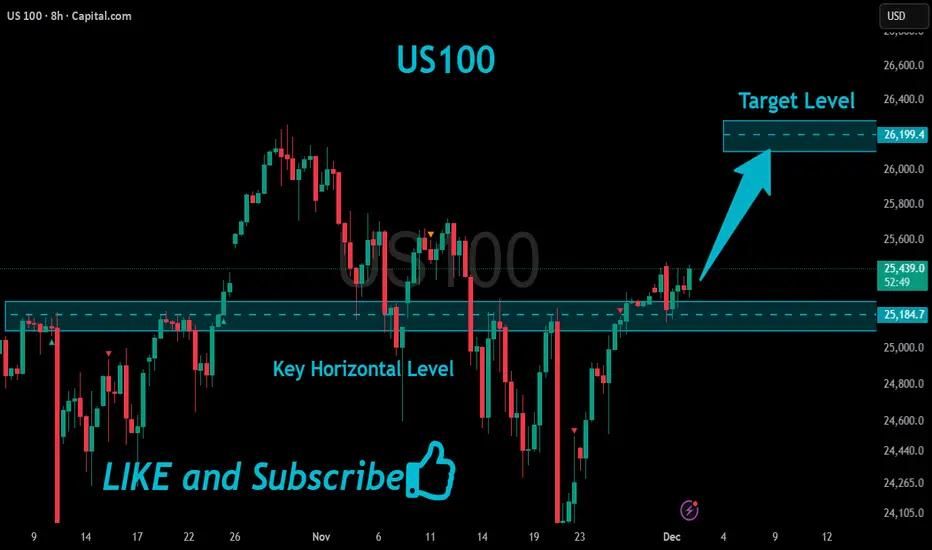
US100 Bullish Breakout!
HI,Traders !
#US100 is going up now
And made a bullish
Breakout of the key horizontal
Level of 25184.7 and the breakout
Is confirmed so we are bullish
Biased and we will be
Expecting a further
Bullish move up !
Comment and subscribe to help us grow !
Has the Nasdaq’s Downtrend Ended?Recently, U.S. indices witnessed declines exceeding 5%, driven by reduced expectations of an interest rate cut in the Federal Reserve’s December meeting, the key catalyst influencing market sentiment and the movement of U.S. indices.
However, the Nasdaq rebounded this week, breaking above the 25,221 level and forming a higher high, indicating a shift in trend from bearish to bullish.
The latest gains are supported by renewed expectations of a December rate cut with an 80% probability, in addition to investors buying the dip as part of their long-term investment strategies in the artificial intelligence sector.
On the technical side, if the price pulls back for a correction, it may rebound again from the 24,148 level to target 24,962 as a first medium-term target.
However, a decline below 23,830, along with forming a lower low on the 4-hour timeframe, would invalidate the bullish scenario and signal a return to a downward trend for the Nasdaq.

BUY ZONE NAS100All timeframes are bullish
On 4 hr there is a CHoC - buyers took control
The CHoC comes from the OB that is imbalanced (30 min OB - IMB)
Inside the OB imbalanced 30 min fair value gap making zone a POI (point of interest)
Looking to take buys from 30 min OB - IMB
Before taking buys, will drop to lower time frame for execution
Consider the liquidity zone when taking an entry
TRADE WHAT YOU SEE & NOT WHAT YOU FEEL - GOOD LUCK

NASDAQDO YOU KNOW WHATS BEHIND THIS OR OTHER IDEAS?? in bio..
Preferably suitable for scalping and accurate as long as you watch carefully the price action with the drawn areas.
With your likes and comments, you give me enough energy to provide the best analysis on an ongoing basis.
And if you needed any analysis that was not on the page, you can ask me with a comment or a personal message.
Enjoy Trading ;)

NOV.30,2025 ANALYSIS ON SPX500 & NAS100 INDICES The monthly charts have printed hanging man candles and hence if the closing of next month candle is below the body of the candle, it will confirm that the rally is over and the next months have a bearish setup. Indicators also support the rally is over based on the weekly and daily charts on both indices.
The weekly candle looks bullish but since the volume is low it does not confirm the rally and is a market maker manipulation setup for retail traders. For shorts bias use tight stop loss, price should not exceed the invalidation levels noted in the video.
The daily charts also show a hidden bearish divergence on MACD Histogram bars, Stochastic cycle & Momentum at fib resistance of 0.786 retrace and Oct, 2023 fib extension of 1) for the SPX500 and fib 0.618 retrace for the NAS100. Daily Stoch cycles support shorts more than long. Price uprise since Wed, Nov 26th, has been on declining momentum, see MACD histogram on 4H. RSI is overbought on 4H with a hidden bearish divergence too.
So, I see more bearish signal on the indices than bullish continuation.
Thank you again for supporting my publications and consider giving my publication a boost and comment with your own insights too. Iron sharpens Iron, let conquer the market together. Cheers !!

NAS100: Momentum Weakening — Watching for a Short Into Recent LoNASDAQ is showing signs of short-term exhaustion, with momentum favouring another attempt lower. A deeper pullback into the trendline is possible but uncertain.

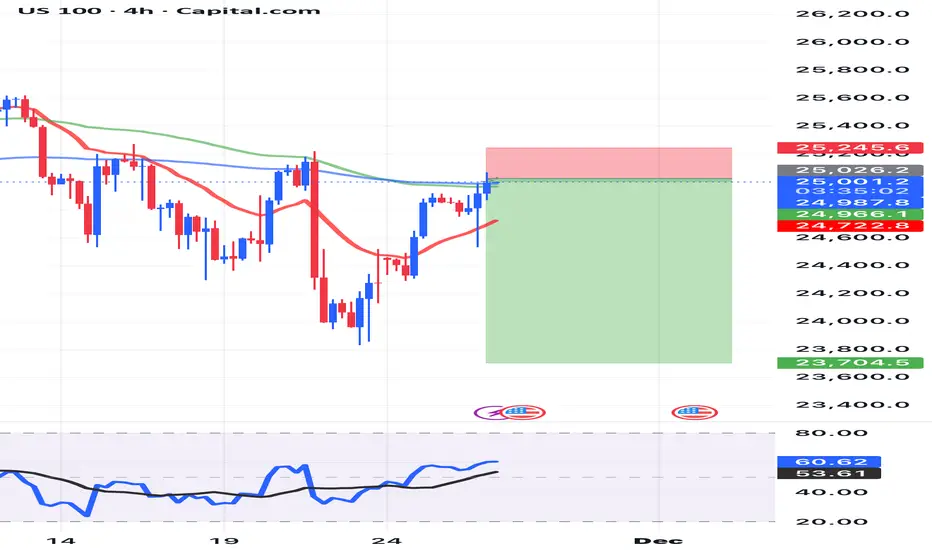
US100 Free Signal! Sell!
Hello,Traders!
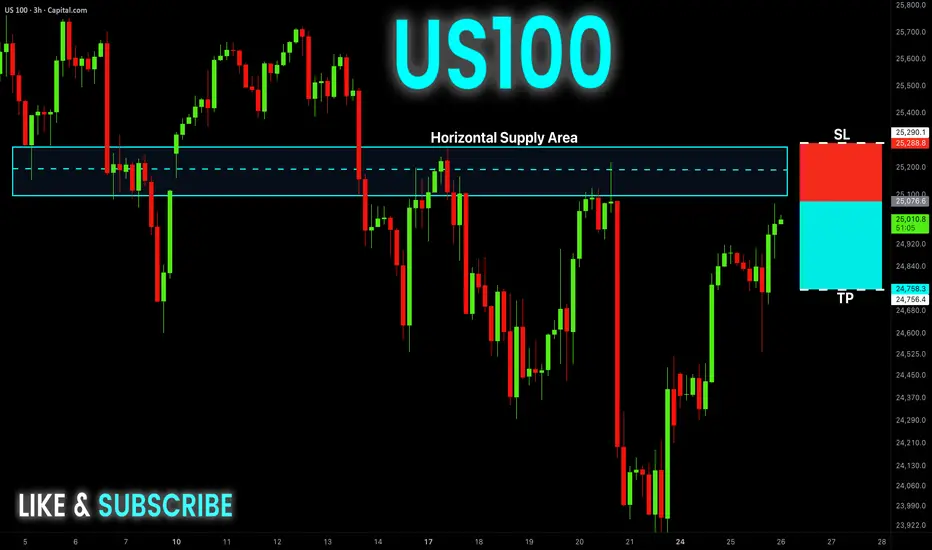
US100 has swept internal liquidity and is now approaching the horizontal supply but hasn’t retested it yet. If the retest confirms distribution, SMC flow favors a drop toward the next sell-side liquidity zone.
--------------------
Stop Loss: 25,288
Take Profit: 24,756
Entry: 25,076
Time Frame: 3H
--------------------
Sell!
Comment and subscribe to help us grow!
Check out other forecasts below too!
Disclosure: I am part of Trade Nation's Influencer program and receive a monthly fee for using their TradingView charts in my analysis.
Potential bullish bounce?NAS100 is reacting off the support level which is a pullback support and could could bounce from this level to our take profit.
Entry: 24,743.72
Why we like it:
There is a pullback support level.
Stop loss: 24,332.99
Why we like it:
There is a pullback support level.
Take profit: 25,790.42
Why we like it:
There is a pullback resistance that aligns with the 78.6% Fibonacci retracement.
Enjoying your TradingView experience? Review us!
Please be advised that the information presented on TradingView is provided to Vantage (‘Vantage Global Limited’, ‘we’) by a third-party provider (‘Everest Fortune Group’). Please be reminded that you are solely responsible for the trading decisions on your account. There is a very high degree of risk involved in trading. Any information and/or content is intended entirely for research, educational and informational purposes only and does not constitute investment or consultation advice or investment strategy. The information is not tailored to the investment needs of any specific person and therefore does not involve a consideration of any of the investment objectives, financial situation or needs of any viewer that may receive it. Kindly also note that past performance is not a reliable indicator of future results. Actual results may differ materially from those anticipated in forward-looking or past performance statements. We assume no liability as to the accuracy or completeness of any of the information and/or content provided herein and the Company cannot be held responsible for any omission, mistake nor for any loss or damage including without limitation to any loss of profit which may arise from reliance on any information supplied by Everest Fortune Group.

Price action Price currently testing an order block that was pervious rejected looking to go to the downside managed to fix my chart this is a clear sell
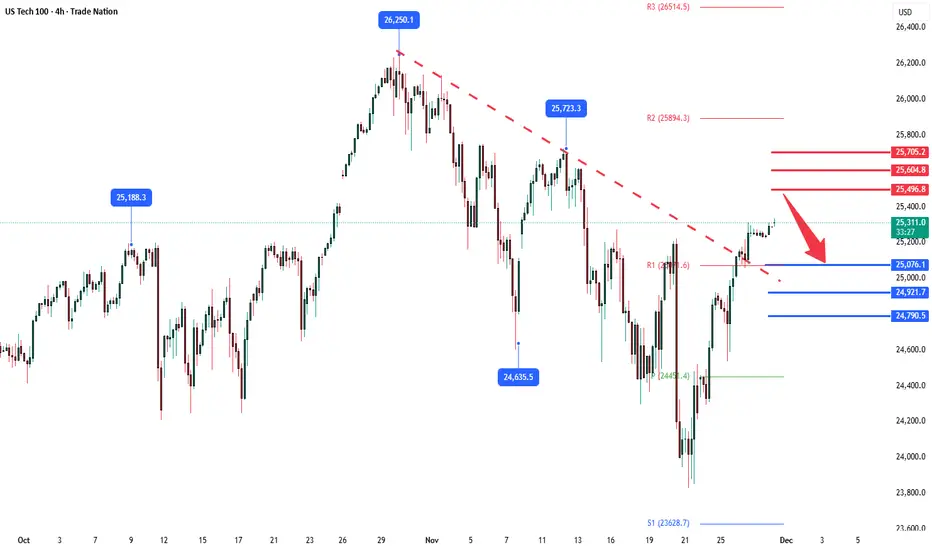
NSDQ100 head into Thanksgiving on a strong noteUS markets head into Thanksgiving on a strong note, with the S&P 500 rising for a fourth straight session (+0.69%) and now sitting just over 1% below its record high. The index has delivered its biggest four-day rally (+4.19%) since the US-China trade truce in May, driven by growing expectations of another Fed rate cut in two weeks and supported by resilient US data.
Trading was disrupted after a technical failure caused a major outage at the Chicago Mercantile Exchange, halting futures and options activity—including Treasuries and S&P 500 futures—and affecting other platforms such as EBS in FX.
Elsewhere, oil is on track for its worst monthly performance since 2023, and equity momentum faded into month-end as markets contended with volatility and concerns around Fed policy and a potential AI-driven bubble.
On the political front, President Trump escalated rhetoric on immigration following the fatal shooting of a National Guard member, proposing drastic restrictions including a pause on admissions from “third world” countries and revoking some naturalized citizenships. He also increased tensions with South Africa, saying he would bar the country from next year’s G20 summit in Miami—a move that breaks established protocol.
With limited news expected on Friday, markets head into the final stretch of November after a turbulent month for global equities.
Key Support and Resistance Levels
Resistance Level 1: 25496
Resistance Level 2: 25600
Resistance Level 3: 25700
Support Level 1: 25076
Support Level 2: 25920
Support Level 3: 25790
This communication is for informational purposes only and should not be viewed as any form of recommendation as to a particular course of action or as investment advice. It is not intended as an offer or solicitation for the purchase or sale of any financial instrument or as an official confirmation of any transaction. Opinions, estimates and assumptions expressed herein are made as of the date of this communication and are subject to change without notice. This communication has been prepared based upon information, including market prices, data and other information, believed to be reliable; however, Trade Nation does not warrant its completeness or accuracy. All market prices and market data contained in or attached to this communication are indicative and subject to change without notice.
NSDQ100 oversold rally reaching resistance at 25285Equities:
Risk appetite improved again, with the S&P 500 +0.91% marking a third straight gain, and futures pointing higher this morning (+0.31%). The move was reinforced by a drop in yields, with the 10yr Treasury down to 4.00%, a four-week low.
Drivers of the Rally:
Dovish Fed momentum: Markets leaned further into December rate-cut expectations after softer US data. Bloomberg headlines that Kevin Hassett is now the frontrunner for Fed Chair added to the dovish tilt.
Geopolitics: European equities tracked higher (STOXX 600 +0.91%), supported by reports of progress in Ukraine peace talks.
US Data – All Dovish:
Consumer Confidence (Nov): 88.7, below every estimate and the lowest since April’s turmoil.
ADP private payroll proxy: Averaged –13.5k over the latest four weeks, signalling labour softness.
September revisions:
Retail Sales +0.2% (vs +0.4% expected).
PPI +0.3% (in line), but still consistent with cooling demand.
Stocks in Focus:
Nvidia –2.59% underperformed as Google’s Gemini 3 launch signalled intensifying AI competition.
Geopolitics:
Bloomberg reported the US sent negotiators to meet Putin in Moscow next week to discuss a Ukraine peace proposal, adding to the constructive tone in Europe.
Trading Takeaway
Rates: Further downside bias in yields if today’s data stays soft; the 4.00% level on the 10yr is key support.
Equities: Momentum remains positive, but tech leadership is wobbling—watch for rotation into cyclicals, financials, and Europe.
FX: Dovish Fed expectations should pressure USD on the margins.
Geopolitics: Peace-talk headlines may continue to support European assets and risk sentiment.
Key Support and Resistance Levels
Resistance Level 1: 25285
Resistance Level 2: 25466
Resistance Level 3: 25390
Support Level 1: 24750
Support Level 2: 24600
Support Level 3: 24450
This communication is for informational purposes only and should not be viewed as any form of recommendation as to a particular course of action or as investment advice. It is not intended as an offer or solicitation for the purchase or sale of any financial instrument or as an official confirmation of any transaction. Opinions, estimates and assumptions expressed herein are made as of the date of this communication and are subject to change without notice. This communication has been prepared based upon information, including market prices, data and other information, believed to be reliable; however, Trade Nation does not warrant its completeness or accuracy. All market prices and market data contained in or attached to this communication are indicative and subject to change without notice.

NAS100 Trade Set Up Dec 1 2025Price is overall bullish and reacting off a daily FVG but if price comes to sweep BSL/London high and respects the 1h FVG i will look for internal sells to take to SSL and the lower daily FVG before the bullish trend continues

NAS100 — Bearish Below 25,333 with Target at 25,054Price remains capped below the 25,333 key level, keeping the market in a clear bearish structure. As long as price trades under this zone, bullish attempts are likely to fail, and any rebounds should be viewed as corrective only. A sustained move below the intermediate supports at 25,181 and 25,166 strengthens the downside momentum and confirms continuation toward the primary bearish target at 25,054. Momentum and structure remain aligned to the downside while the key level holds.
