USS30 BUY WITH LIMIT ORDER!!!!!!US30 Created new highs as my structure highs am looking forward to see price made a minor pull back into my 50% zone and also take out my inducement to my order block zone(47,160 limit order) for a buy.....
Trade ideas

US30 - Entry Setups (1H Confirmation for Precision)Entry Setups (1H Confirmation for Precision)
Focus on price-action triggers at key levels. Use 1H for entries, 4H for context. All based on structure—no indicators.
Setup 1: Bullish – Buy the Support Bounce (Preferred, High Probability)
Rationale: Aligns with overall bull trend; 47,346.8 has held multiple times on 4H.
Entry Trigger: 1H bullish reversal candle (e.g., hammer or engulfing) at 47,346.8 (±20 points).
Entry Price: 47,350–47,370 (market or limit).
Stop Loss: 47,280 (below level + buffer; risk ~70 points).
Take Profits:
TP1: 47,523.2 (current 1H close) → +173 points.
TP2: 47,624.7 (prior 4H close) → +274 points.
TP3: 48,000 → +650 points.
Risk:Reward: 1:2.5–1:9.
Confluence: Strong volume on bounce; no 1H close below level.
Invalidation: 1H close <47,346.8 → switch to bearish setup.
Setup 2: Bearish – Short the Breakdown (If Triggered)
Rationale: Confirms short-term weakness if 1H/4H breaks support.
Entry Trigger: 1H close below 47,346.8, followed by retest from below (now resistance).
Entry Price: 47,330–47,340 (on retest rejection).
Stop Loss: 47,420 (above retest high; risk ~80 points).
Take Profits:
TP1: 47,000 → +340 points.
TP2: 46,987.3 → +353 points.
TP3: 46,527.3 → +813 points.
Risk:Reward: 1:4+.
Confluence: Increasing volume on drop; bearish 1H candles (e.g., marubozu).
Invalidation: Price reclaims >47,420 with bullish close → exit and flip long.
Follow me for more updates

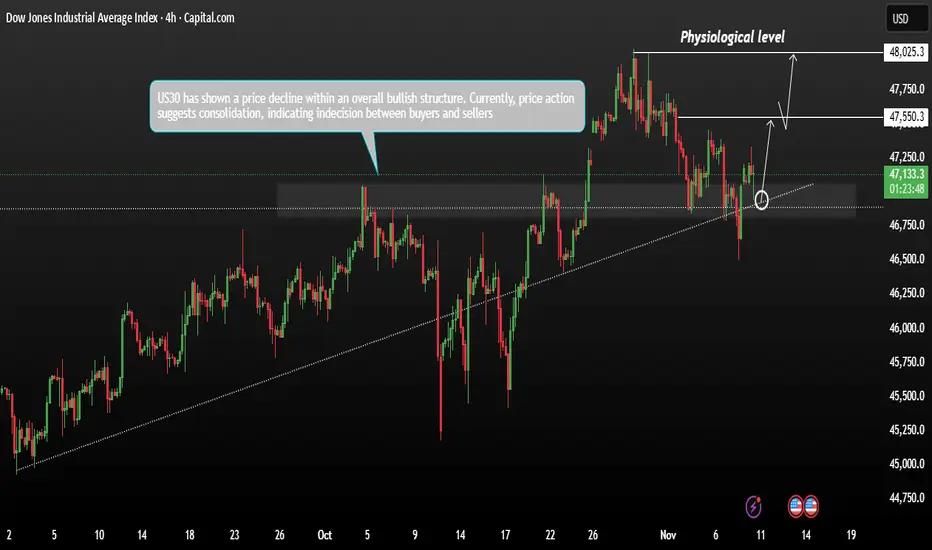
US30 Price decline within an overall bullish structureUS30 has shown a price decline within an overall bullish structure. Currently, price action suggests consolidation, indicating indecision between buyers and sellers. the index has pulled back but remains above key support zones, suggesting the potential for a rebound toward recent swing-high resistance levels.
If bulls maintain control, a continuation of the uptrend could follow after this consolidation phase. However, if momentum weakens, a deeper retracement could occur before any sustainable upside move resumes then Next expected target would be 47,550 to 48,025 lets see and how does price should react.
You may find more details in the chart,
Trade wisely best of Luck Buddies.
Ps; Support with like and comments for better analysis Thanks for Supporting.
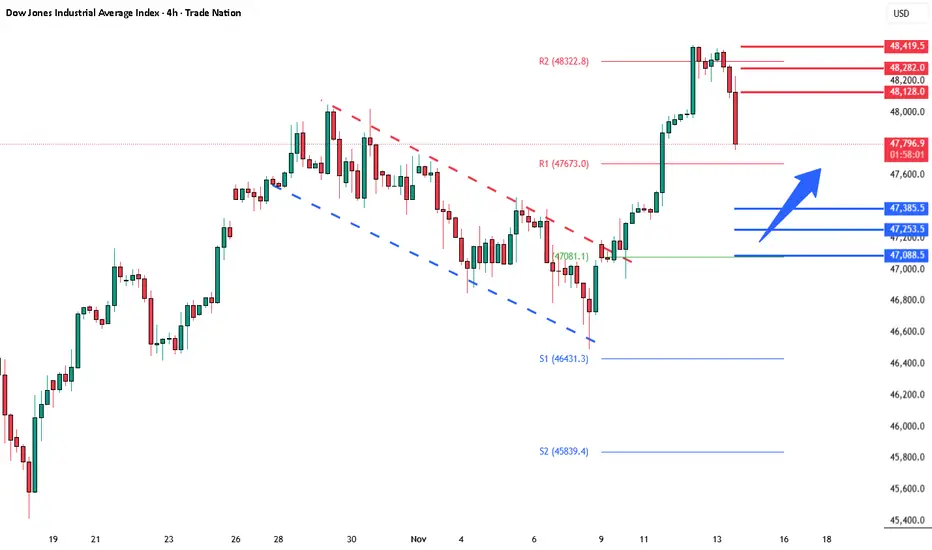
DowJones Key Trading LevelsKey Support and Resistance Levels
Resistance Level 1: 48128
Resistance Level 2: 48280
Resistance Level 3: 48420
Support Level 1: 47385
Support Level 2: 47253
Support Level 3: 47090
This communication is for informational purposes only and should not be viewed as any form of recommendation as to a particular course of action or as investment advice. It is not intended as an offer or solicitation for the purchase or sale of any financial instrument or as an official confirmation of any transaction. Opinions, estimates and assumptions expressed herein are made as of the date of this communication and are subject to change without notice. This communication has been prepared based upon information, including market prices, data and other information, believed to be reliable; however, Trade Nation does not warrant its completeness or accuracy. All market prices and market data contained in or attached to this communication are indicative and subject to change without notice.
US30 Trade Secured 1500 PipsPrice inverted a 1h FVG in London session then broke structure to the downside on the 15m, came up to sweep BSL to then target PDL

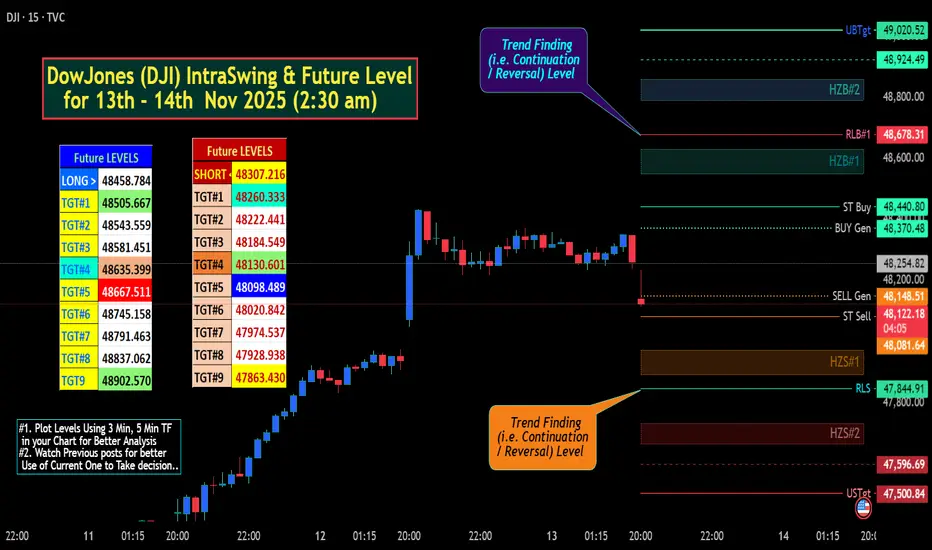
DowJones (DJI) IntraSwing & Future Level for 13th - 14th Nov 25✍🏼️ "Future IntraSwing Levels" mentioned in BOX format.
Useful to Tally / Recognize for Next day Trade Plan.
Useful to Tally / Recognize or sometime DETECT abnormal Movement of NIFTY for Next day Trade Plan.
Level description:
L#1: If the candle crossed & stays above the “Buy Gen”, it is treated / considered as Bullish bias.
L#2: Possibility / Probability of REVERSAL near RLB#1 & UBTgt
L#3: If the candle stays above “Sell Gen” but below “Buy Gen”, it is treated / considered as Sidewise. Aggressive Traders can take Long position near “Sell Gen” either retesting or crossed from Below & vice-versa i.e. can take Short position near “Buy Gen” either retesting or crossed downward from Above.
L#4: If the candle crossed & stays below the “Sell Gen”, it is treated / considered a Bearish bias.
L#5: Possibility / Probability of REVERSAL near RLS#1 & USTgt
HZB (Buy side) & HZS (Sell side) => Hurdle Zone,
*** Specialty of “HZB#1, HZB#2 HZS#1 & HZS#2” is Sidewise (behaviour in Nature)
Rest Plotted and Mentioned on Chart
Color code Used:
Green =. Positive bias.
Red =. Negative bias.
RED in Between Green means Trend Finder / Momentum Change
/ CYCLE Change and Vice Versa.
Notice One thing: HOW LEVELS are Working.
Use any Momentum Indicator / Oscillator or as you "USED to" to Take entry.
⚠️ DISCLAIMER:
The information, views, and ideas shared here are purely for educational and informational purposes only. They are not intended as investment advice or a recommendation to buy, sell, or hold any financial instruments. I am not a SEBI-registered financial adviser.
Trading and investing in the stock market involves risk, and you should do your own research and analysis. You are solely responsible for any decisions made based on this research.
"As HARD EARNED MONEY IS YOUR's, So DECISION SHOULD HAVE TO BE YOUR's".
Do comment if Helpful .
In depth Analysis will be added later (If time Permits)
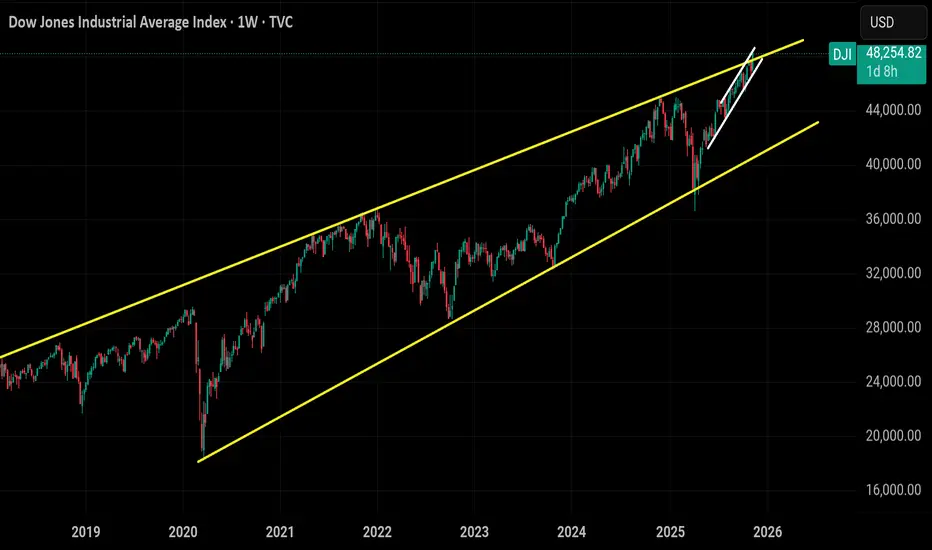
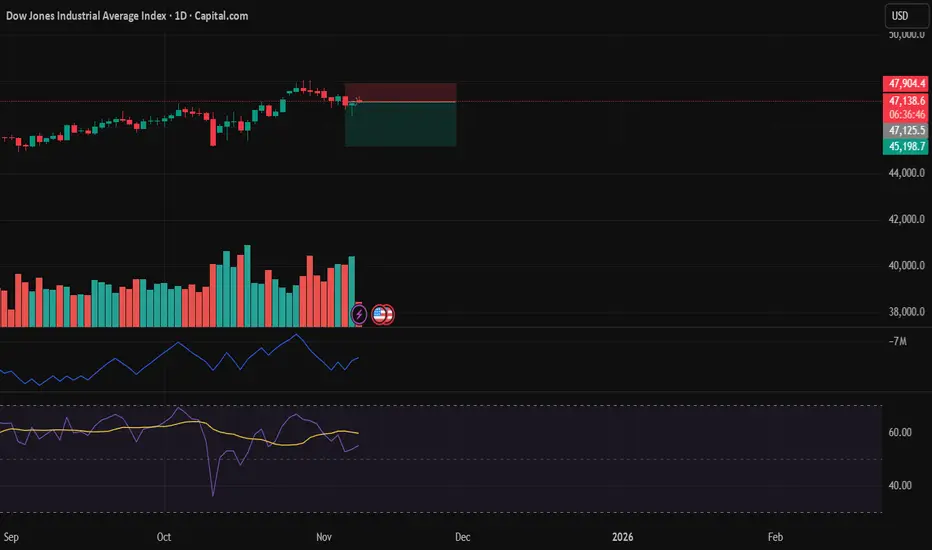
Dow jonesChart is self evident but let me explain.
Top of weekly channel 5yr resistance
(YELLOW)
Top of tariff rebound channel
(WHITE)
Outside weekly and daily bollingerband
Basically we are at extreme resistances really overbought.. imagine trying to break through something while being low on fuel.
The candle pattern " 3 white soilders" from the bullflag breakout has played out. The 4th candle usually completes the sequence
So now I think this is a channel trade and we head back to support 50sma or 47,000
From there if we lose 47,000 or 50sma then we head back to 44,900
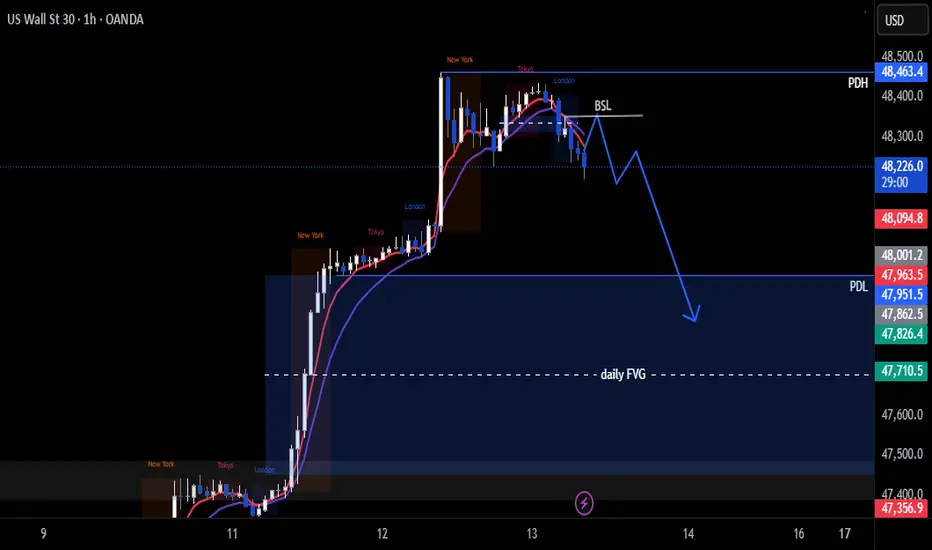
US30 Trade Set Up Nov 13 2025Price reached ATH yesterday during New York session but has closed under it during Asia and London and left a big daily gap that i am expecting price to target so i will wait for a internal BSL sweep followed by IFVG/CISD to target daily FVG
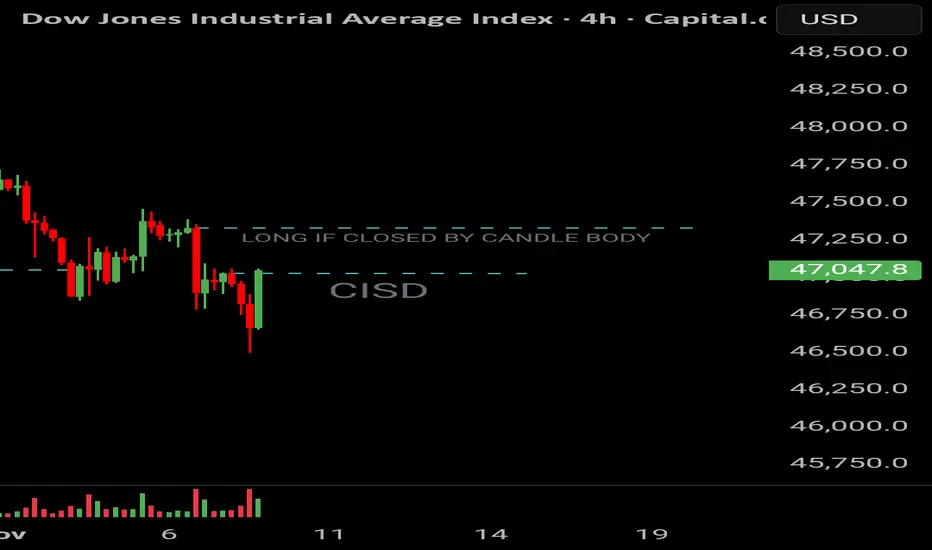
Possible entryWe can see that the price may go up if closed with the body in that upper line ( by my strategy).
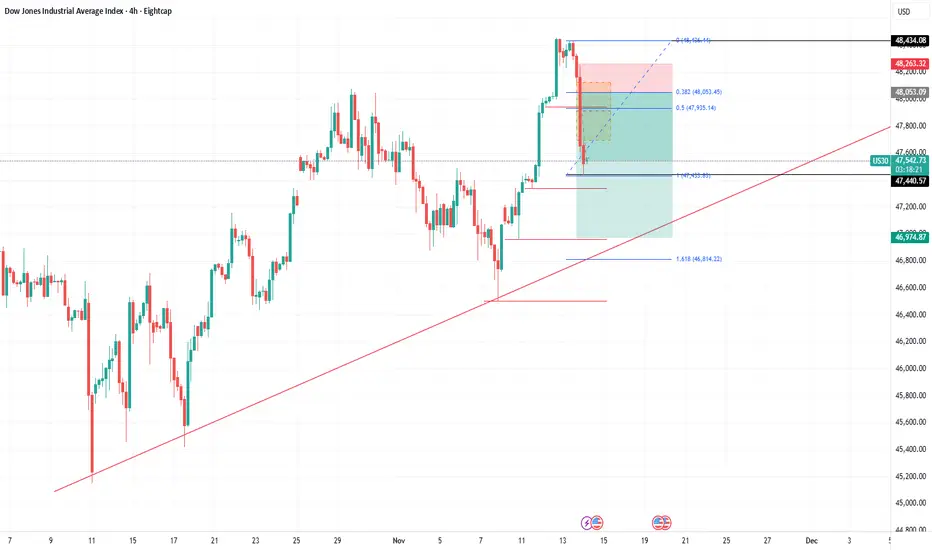
US30 LONGFib Retracement levels. for any form of pull back a higher low need to be created on or above a strong support level.
Short idea on US30After a long rally, a small correction was due signaled strongly by RSI and Volume.
$DJI – Buy the Dip Opportunity | Target: 51,000TVC:DJI – Buy the Dip Opportunity | Target: 51,000 🚀
The Dow Jones is offering a high-probability dip-buying setup within a strong macro bullish structure. Wave alignment and smart money positioning suggest continuation toward the 51,000 zone. Price is respecting key Fibonacci levels and institutional support zones. Momentum is building — this could be the launchpad.
📍 Watch for confirmation on lower timeframes.
📈 Trend remains intact — stay with structure.
#ElliottWave #SmartMoney #Fibonacci #DowJones #DJI #TradingView #TechnicalAnalysis #BuyTheDip

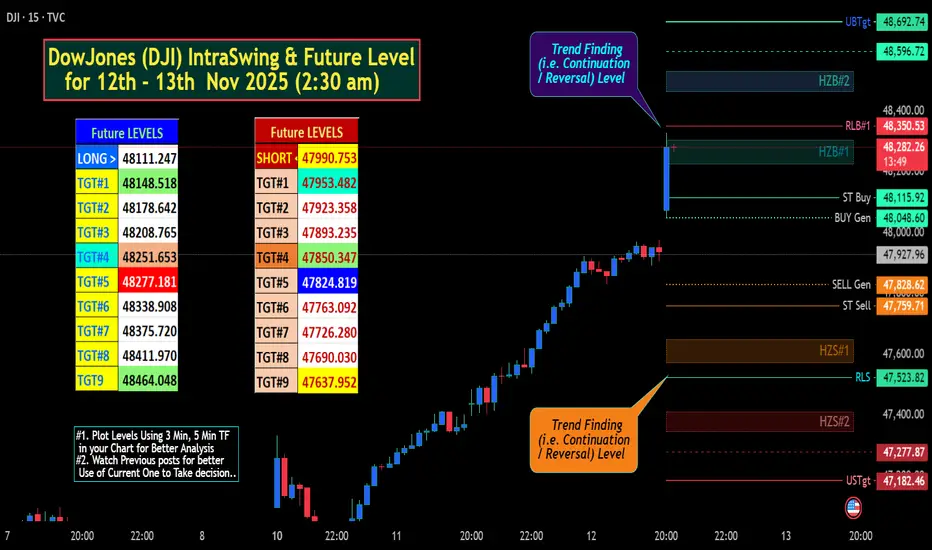
DowJones (DJI) IntraSwing & Fut Level for 12th - 13th Nov 2025 DowJones (DJI) IntraSwing & Fut Level for 12th - 13th Nov 2025 (2:30 am)
b]✍🏼️ "Future IntraSwing Levels" mentioned in BOX format.
Useful to Tally / Recognize for Next day Trade Plan.
Level description:
L#1: If the candle crossed & stays above the “Buy Gen”, it is treated / considered as Bullish bias.
L#2: Possibility / Probability of REVERSAL near RLB#1 & UBTgt
L#3: If the candle stays above “Sell Gen” but below “Buy Gen”, it is treated / considered as Sidewise. Aggressive Traders can take Long position near “Sell Gen” either retesting or crossed from Below & vice-versa i.e. can take Short position near “Buy Gen” either retesting or crossed downward from Above.
L#4: If the candle crossed & stays below the “Sell Gen”, it is treated / considered a Bearish bias.
L#5: Possibility / Probability of REVERSAL near RLS#1 & USTgt
HZB (Buy side) & HZS (Sell side) => Hurdle Zone,
*** Specialty of “HZB#1, HZB#2 HZS#1 & HZS#2” is Sidewise (behaviour in Nature)
Rest Plotted and Mentioned on Chart
Color code Used:
Green =. Positive bias.
Red =. Negative bias.
RED in Between Green means Trend Finder / Momentum Change
/ CYCLE Change and Vice Versa.
Notice One thing: HOW LEVELS are Working.
Use any Momentum Indicator / Oscillator or as you "USED to" to Take entry.
⚠️ DISCLAIMER:
The information, views, and ideas shared here are purely for educational and informational purposes only. They are not intended as investment advice or a recommendation to buy, sell, or hold any financial instruments. I am not a SEBI-registered financial adviser.
Trading and investing in the stock market involves risk, and you should do your own research and analysis. You are solely responsible for any decisions made based on this research.
"As HARD EARNED MONEY IS YOUR's, So DECISION SHOULD HAVE TO BE YOUR's".
Do comment if Helpful .
In depth Analysis will be added later (If time Permits)
US30 Trade Set Up Nov 12 2025Price is trading above PDH and has swept ATH so i want to see a pullback to sweep SSL Asia/London lows and/or tap 4h FVG before looking to buy back up

Dow Jones Rises on Shutdown Optimism | Bulls Eye 48500 ZoneUS30 | Overview
The price pushed up sharply ahead of the expected end of the U.S. government shutdown, reflecting renewed optimism across equity markets.
This momentum suggests a continuation of the bullish trend, with buyers maintaining control as long as the price trades above 48020.
As long as price action holds above this pivot level, the index is likely to advance toward 48210, and a break above that zone could extend gains toward 48500.
However, if the price drops below 47850, a bearish correction may develop, targeting 47450.
Pivot Line: 48020
Resistance: 48210 · 48500
Support: 47850 · 47710 · 47460

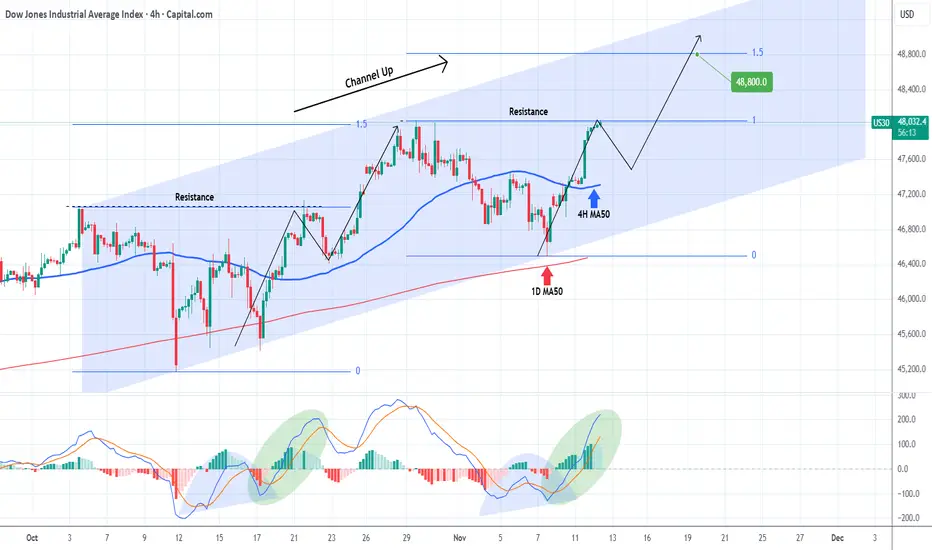
DOW JONES to new All Time Highs and won't stop there!Dow Jones (DJI) has been trading within an aggressive Channel Up since October 03, which made today a new All Time High (ATH). This is its technical Bullish Leg following the Higher Low bottom near the 1D MA50 (red trend-line).
With a 4H MACD sequence identical to the previous Leg, it is possible to see a re-test of the 4H MA50 (blue trend-line) next but on the medium-term, a new Higher High of at least 48800 (the 1.5 Fibonacci extension as on the previous Bullish Leg) is expected.
---
** Please LIKE 👍, FOLLOW ✅, SHARE 🙌 and COMMENT ✍ if you enjoy this idea! Also share your ideas and charts in the comments section below! This is best way to keep it relevant, support us, keep the content here free and allow the idea to reach as many people as possible. **
---
💸💸💸💸💸💸
👇 👇 👇 👇 👇 👇
US30 H4 | Bearish Reaction off Key ResistanceMomentum: Bearish
Price is currently below the ichimoku cloud.
Sell entry: 47,458
- Strong overlap resistance
- 61.8% Fib retracement
- 61.8% FIb projection
Stop Loss: 47,801.28
- Swing high resistance
- 78.6% Fib retracement
Take Profit: 47,078.49
- Overlap support
Stratos Markets Limited (tradu.com/uk ):
CFDs are complex instruments and come with a high risk of losing money rapidly due to leverage. 68% of retail investor accounts lose money when trading CFDs with this provider. You should consider whether you understand how CFDs work and whether you can afford to take the high risk of losing your money.
Stratos Europe Ltd (tradu.com/eu ):
CFDs are complex instruments and come with a high risk of losing money rapidly due to leverage. 70% of retail investor accounts lose money when trading CFDs with this provider. You should consider whether you understand how CFDs work and whether you can afford to take the high risk of losing your money.

US30 Approaches 47,200 Support as Seasonality Favors Bulls!Hey Traders,
In today’s session, we’re monitoring US30 for a buying opportunity around the 47,200 zone. The Dow Jones remains in a broader uptrend and is currently in a correction phase, approaching a key support and resistance area at 47,200.
We’d also like to highlight the strong seasonal tendency for equities during this period — historically, November has often provided a tailwind for the Dow as market sentiment improves ahead of year-end.
Watching closely for a potential bullish trigger at support.
Trade safe,
Joe.

Trading US30 DOW JONES: Bullish Momentum Here's My Trade PlanYesterday in my video 🎥, I mentioned that if US30 broke out to the upside, I'd look to enter long. That’s exactly what happened—big breakout! 🌟 Now, I’m waiting for a pullback 🕰️ to my optimal entry zone and a confirmed market structure shift for another buy opportunity 💵. (Not financial advice) 📝

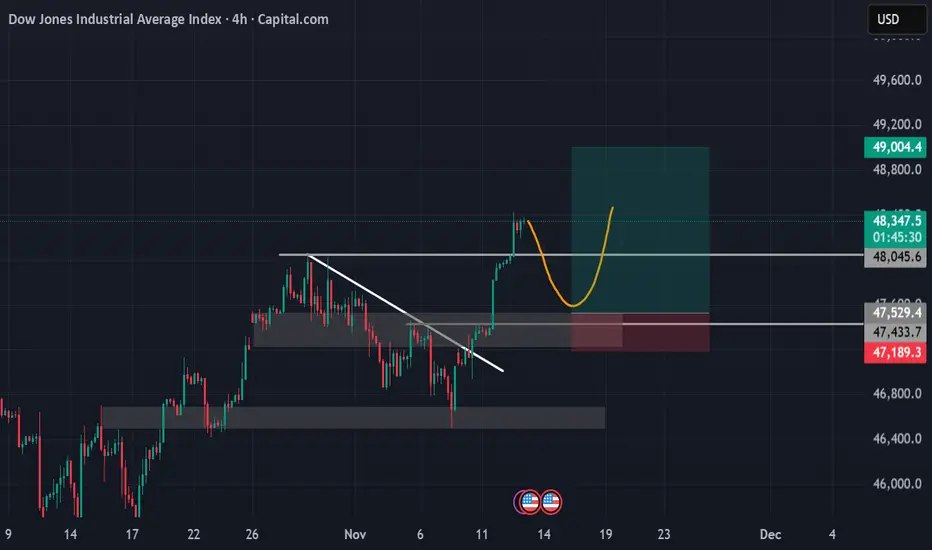
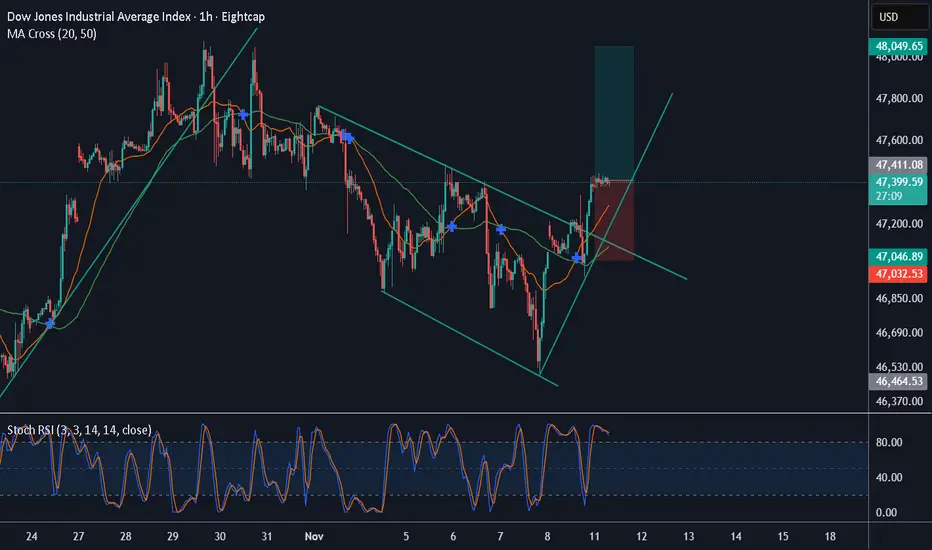
Falling ChannelThe price formed a falling channel followed by a false breakout, pullback and now the price has broken out and looks go long
WE ONLY TRADE PULLBACKS
Comment your thoughts
US30 BULLHI
Simple market structure.
The chart speaks for itself
Quick resume, the market is currently goin through correction for bullish continuation.

Dow Jones: Pressure Builds for a Topside BreakCoiling within an ascending triangle just beneath record highs, Dow Jones Industrial Average traders should be on alert for a potential bullish breakout.
The slingshot price action of recent days has delivered an obvious bullish message, with the three-candle morning star pattern completed on Monday proving prescient in signalling what was to come. Now trading just below 48,000—a level it’s struggled to overcome over the past month—we’re approaching what could be a key moment for medium-term directional risks. With the ascending triangle spanning thousands of points, a clean topside break could trigger significant upside.
With RSI (14) sitting above 50 but not yet overbought, upside pressure is strengthening. MACD is confirming, having staged a bullish crossover in positive territory earlier this week. The ducks are lining up for a potential bullish breakout.
Should we see a clean break above 48,000, longs could be established above the former highs with a stop beneath for protection. Unless we see a close above that level, the preference would be to wait for a pullback, test and bounce from the former highs using a shorter timeframe before entry.
While convention suggests a breakout from the triangle could eventually see the price trade north of 50,000, implying that could be a target, others may prefer to take their cues to exit from price action should an obvious topping signal or pattern emerge.
Even though a topside break is favoured, if the bullish move continues to stall around 48,000, there’s scope to flip the setup, allowing for shorts to be placed beneath the level with a stop above the highs, targeting 47,400 or the October uptrend. This screens as a lower-probability play given recent price and momentum signals despite previous success for shorts around these levels.
Good luck,
DS
