Nasdaq slipped as investors balanced Fed signalsThe Nasdaq 100 (-0.87%) fell as tech stocks weakened. Uncertainty around Nvidia’s $100bn OpenAI deal led the reversal after Monday’s gains.
Powell’s comments added to caution: he repeated that risks remain on both inflation and jobs, but also admitted to “meaningful weakness” in the labour market. This helped bonds rally, but not equities.
Extra pressure came from US government shutdown concerns, while gold hit a record high ($3,764/oz) as investors shifted to a defensive.
Tech momentum cooled, and the Nasdaq slipped as investors balanced Fed signals, policy risks, and stretched valuations.
Key Support and Resistance Levels
Resistance Level 1: 24830
Resistance Level 2: 24950
Resistance Level 3: 25055
Support Level 1: 24412
Support Level 2: 24300
Support Level 3: 24190
This communication is for informational purposes only and should not be viewed as any form of recommendation as to a particular course of action or as investment advice. It is not intended as an offer or solicitation for the purchase or sale of any financial instrument or as an official confirmation of any transaction. Opinions, estimates and assumptions expressed herein are made as of the date of this communication and are subject to change without notice. This communication has been prepared based upon information, including market prices, data and other information, believed to be reliable; however, Trade Nation does not warrant its completeness or accuracy. All market prices and market data contained in or attached to this communication are indicative and subject to change without notice.
USTEC.F trade ideas

Shutdown risk, Investors eye Jobs DataShutdown risk, Investors eye Jobs Data
U.S. stock index futures slipped on 30 September as investors awaited key labor reports and braced for possible delays in economic data due to a looming government shutdown. The risk-off shift follows Monday’s equity gains, with analysts warning this standoff could be more disruptive given the fragile economic backdrop.
Markets are focused on the Labor Department’s JOLTS report and consumer confidence data, while several Fed officials are set to speak. Earnings season and potential price hikes from companies will also draw attention as Q4 begins, historically a supportive period for stocks.
Budget negotiations remain deadlocked in Washington, raising the likelihood of a shutdown that could stall government services and key data releases. Wall Street futures eased from record highs, Treasury yields edged lower, and the dollar softened, while the yen and Aussie dollar gained.

26.09.2025~+ US ec. data (a bit mixed - Mich.Cons.Sent Miss dragged the trade down)
- Seasonals
- Time (Fri)
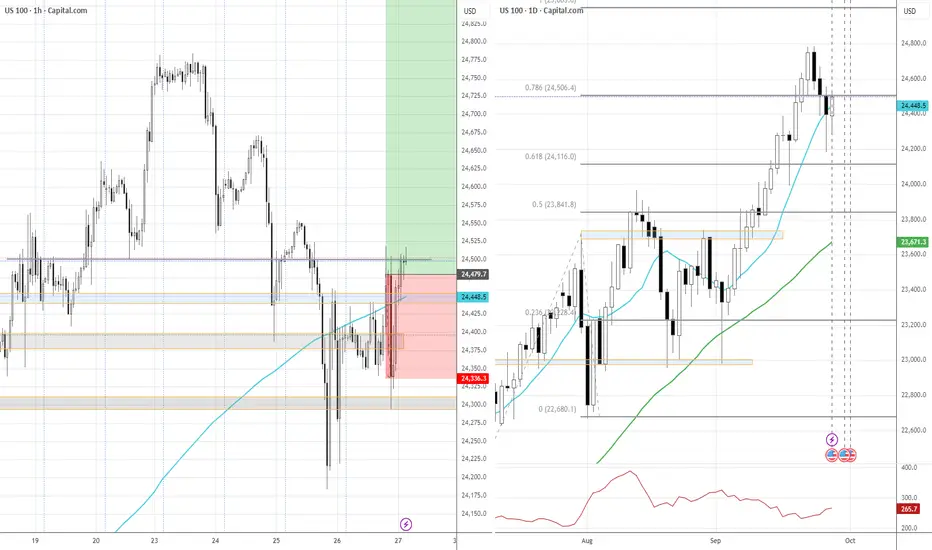
NASDAQ short then longOn NASDAQ, considering the break of market structure, I want to see a small push higher to 24,581 (Resistance + 4H value) before short term swing sells to 23.6k (Weekly value). Price respected daily value at 24,285. Once I see a close under daily value structure, I'll look for a pb to daily value. Sells at 4hr value and sells at daily value.

Nas100: Trading Levels in FocusKey Zones in Play
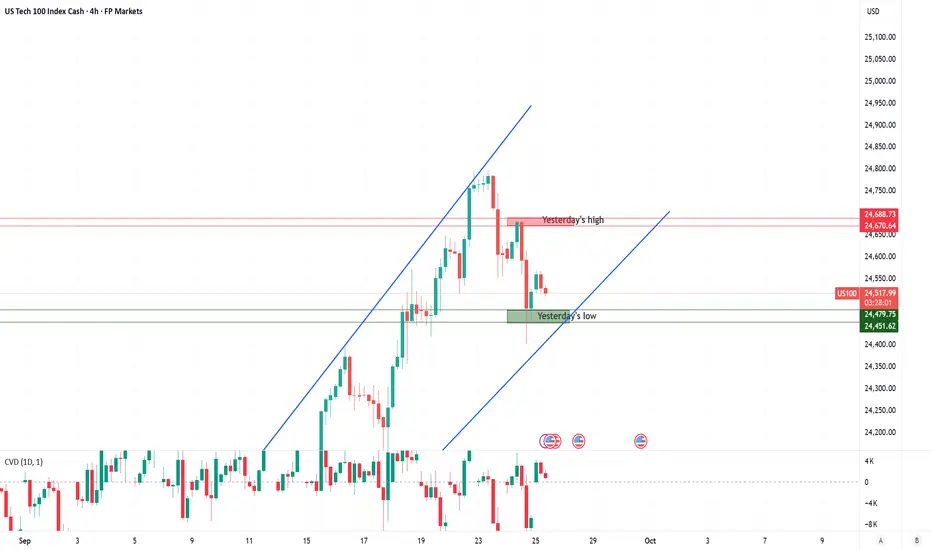
Zone 1 – Yesterday’s High:
Yesterday’s high represents the level where buyers lost momentum and sellers stepped in. If price revisits this zone, traders should expect potential supply pressure. A clean break and sustained hold above would signal renewed strength and could re-ignite bullish momentum.
Zone 2 – Yesterday’s Low:
This zone is the lower boundary of the previous session and now acts as short-term support. Buyers may defend this level to maintain structure, but its reliability is limited given the fresh all-time high environment and lack of historical confirmation. A decisive break below would weaken the bullish case and could invite deeper retracement.
Conclusion:
With US100 trading close to record highs, these zones provide useful guidelines, but they should not be treated as precise buy or sell triggers. In uncharted territory, reactions are often more volatile, making it essential to treat these levels as reference points rather than absolute decision zones.
Morning Sentiment Brief
Market sentiment remains cautiously optimistic. The recent Fed rate cut and ongoing enthusiasm around AI investments continue to underpin a bullish narrative, keeping the US100 near record highs. However, Powell’s cautious tone this week, stressing data-dependence and warning about stretched equity valuations, has cooled some of the initial euphoria.
Traders are now balancing optimism with prudence. Tech momentum is intact, but profit-taking and sector rotation show that conviction is more selective. Political and regulatory headlines add another layer of uncertainty, leaving the market more sensitive to incoming catalysts. Overall, the bias stays positive, but participants are trading with more caution as the index moves in uncharted territory.
USNAS100 – New All-Time High as Tech Headlines Fuel MomentumUSNAS100 – Overview
The Nasdaq 100 recorded a new all-time high (ATH) near 24,820, extending its bullish run as markets continue to digest upbeat tech headlines.
Investor sentiment remains supported by Nvidia’s plan to invest up to $100 billion in OpenAI, with the first data-center gear expected in 2026, and by anticipation of September flash PMIs, which will test U.S. economic resilience amid tariffs and ongoing Fed commentary.
Bullish Scenario
The index maintains strong bullish momentum while trading above the 24,780 – 24,710 pivot zone.
Targets: A sustained move above current highs could drive price toward 24,900 → 25,045.
An hourly close above 24,900 would reinforce upside momentum, potentially opening the way to fresh highs beyond 25,045 if tech sentiment strengthens.
Bearish Scenario
A confirmed 1H close below 24,710 would signal the start of a corrective move.
Targets: 24,570 → 24,460, with deeper losses possible if profit-taking accelerates after recent ATHs.
Key Levels
Pivot Zone: 24,780 – 24,710
Resistance: 24,900 – 25,045
Support: 24,570 – 24,470
US 100 Index – Upside Momentum to be Put to the TestThe US 100 registered its first down week of September when it closed at 24507 last Friday, a weekly loss of 0.4%. Hardly a collapse but a warning that no market moves in a straight line, especially one so sensitive to many of the key drivers that traders are focused on, namely AI and Federal Reserve (Fed) interest rate moves.
It seems that last week’s dip may have been driven by some profit taking into the end of what has been a strong third quarter performance for this technology heavy index (8%, July 1st to September 26th). That drop has already been unwound by yesterday’s 0.4% rally which has continued this morning to current levels around 24640 (0730 BST), as traders’ position for some key economic data on the US labour market, which could clear up whether the Fed has room to cut interest rates again when they meet next on October 29th.
While there is a US labour market data release scheduled for every day across the remainder of this week, the focus could be Friday’s Payrolls update, where traders are anticipating a modest gain of around 39k and the unemployment rate to remain at its current level of 4.3%. Any deviation from these expectations could impact the market’s pricing of around a 90% chance of an October Fed rate cut, and a 60% chance of another December rate cut, with knock on implications for the direction of the US 100 at the start of Q4.
One obstacle impacting Friday’s Payrolls could be the possibility for a US Federal government shutdown from October 1st, which could delay the release of the labour market data, creating an extra level of uncertainty into the end of the week. Congressional leaders met with President Trump at the White House yesterday and talks to avoid a shutdown are on-going, although the latest updates provided by Vice President Vance suggests that a funding agreement is still some way off.
It may be worthwhile monitoring progress on this throughout the day ahead, just in case an agreement isn’t reached, and it leads to some extra US 100 volatility.
Technical Update: Price Decline Finding Support
Price corrections are a natural part of a broader uptrend and often reflect a healthy reaction to recent upside extremes. Following last week’s sell-off in the US 100 index, traders may now be assessing whether the latest weakness is simply a limited pullback ahead of renewed attempts to extend what still appears to be a constructive trend, or the beginning of a more extended price decline.
While it’s impossible to confirm whether a renewed phase of strength is underway, last week’s initial weakness found support at lower levels. As the chart above shows, fresh upside attempts may now be emerging, suggesting the possibility of a resumption of the uptrend pattern.
While positive sentiment may still be evident, this week’s upcoming data releases could prove pivotal, with the potential to shift momentum and drive notable price moves across key assets and traders will be watching closely for confirmation, or disruption, of the current US 100 index trend.
As a result, it may be important to identify and then monitor key support and resistance levels in case an increased spell of volatility emerges.
Potential Support Levels:
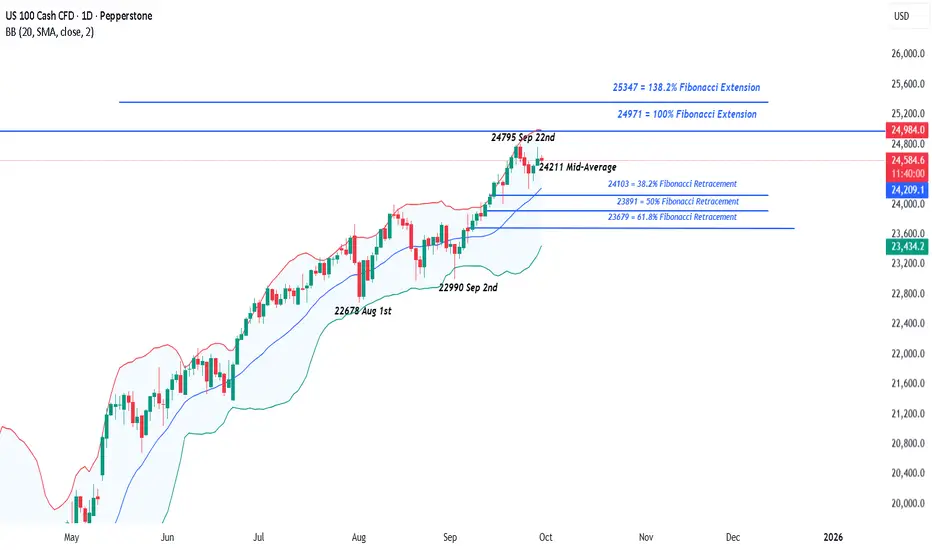
As the chart below shows, the latest price strength seen on Monday and into this morning, appears to be emerging from an initial support zone between 24211 and 24103. This range is marked by both the rising Bollinger mid-average and the 38.2% Fibonacci retracement of September’s advance.
A closing break below these levels wouldn’t confirm a downside shift but could pave the way for a test of 23891, the 50% retracement, and possibly even extend towards 23679, which is the 61.8% level.
Potential Resistance Levels:
After marking a new all-time high at 24795 on September 22nd, traders may now be monitoring this level as the initial resistance focus this week.
If the positive trend does remain, fresh attempts at price strength are possible. It could be worthwhile monitoring how the 24795 all-time high is defended on a closing basis, with successful breaks higher potentially leading to a further phase of price strength.
While a closing break above 24795 doesn’t guarantee further upside, it could trigger fresh attempts to push first towards 24971, the 100% Fibonacci extension, and potentially up to 25347, the 138.2% extension level.
The material provided here has not been prepared accordance with legal requirements designed to promote the independence of investment research and as such is considered to be a marketing communication. Whilst it is not subject to any prohibition on dealing ahead of the dissemination of investment research, we will not seek to take any advantage before providing it to our clients.
Pepperstone doesn’t represent that the material provided here is accurate, current or complete, and therefore shouldn’t be relied upon as such. The information, whether from a third party or not, isn’t to be considered as a recommendation; or an offer to buy or sell; or the solicitation of an offer to buy or sell any security, financial product or instrument; or to participate in any particular trading strategy. It does not take into account readers’ financial situation or investment objectives. We advise any readers of this content to seek their own advice. Without the approval of Pepperstone, reproduction or redistribution of this information isn’t permitted.
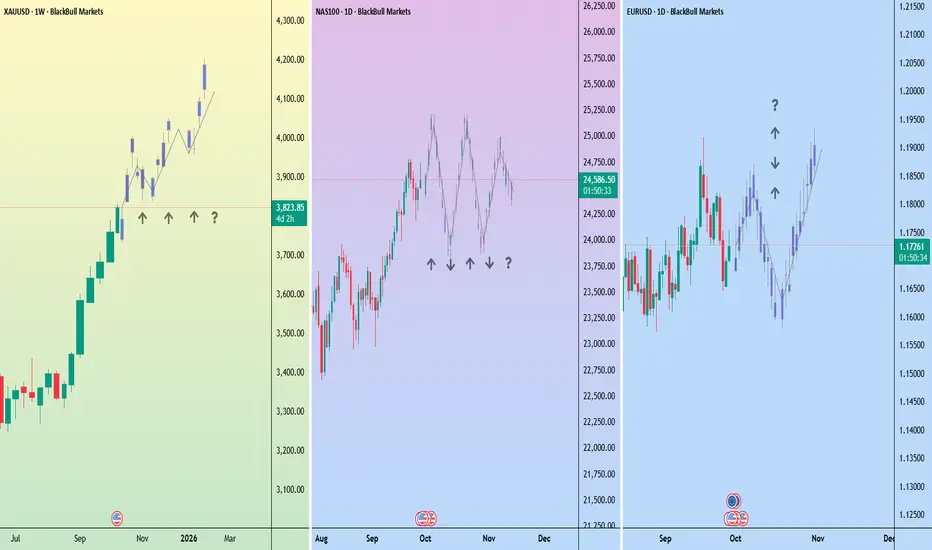
Positioning for a government shutdown: gold, Nasdaq 100, EURUSDUnless Congress can reach an agreement before 1 October, the federal government will shut down. The last major shutdown, during President Trump’s first term, lasted 34 days.
Markets are already weighing the risks of plummeting confidence in the US and its currency and disruptions to the release of important economic data. For traders, this can create volatility and opportunity across major asset classes.
Gold
Gold often benefits from political and fiscal uncertainty. If a shutdown occurs, safe-haven flows could push the metal higher.
Nasdaq 100
The Nasdaq 100 has been sensitive to swings in sentiment around government stability and interest rate expectations. A shutdown could amplify volatility. Traders should be mindful of potential gap moves at the weekly open if negotiations falter over the weekend.
EUR/USD
A shutdown that undermines confidence in U.S. fiscal management could weigh on the EUR/USD in the short term. However, Europe faces its own economic issues, potentially keeping the pair range-bound for now.
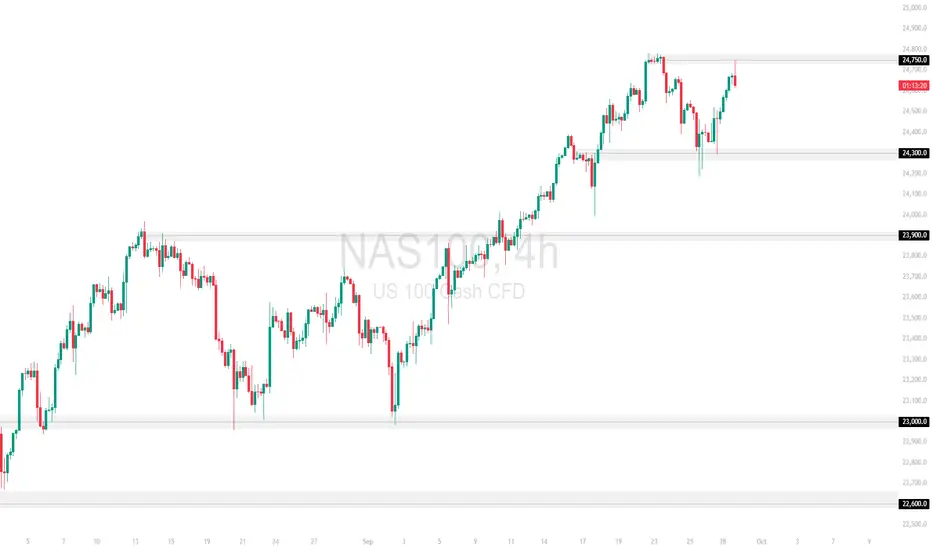
NAS100 Technical Analysis – Key Resistance TestAfter a strong recovery from 24,300, NAS100 pushed higher but is now facing rejection at the 24,750 resistance zone. The index is holding above short-term structure but has yet to clear this key barrier.
Support at: 24,300 🔽 / 23,900 🔽
Resistance at: 24,750 🔼
🔎 Bias:
🔼 Bullish: A clean breakout and hold above 24,750 could open the way for further upside momentum.
🔽 Bearish: Failure to break higher and a sustained drop below 24,300 may trigger deeper retracements toward 23,900.
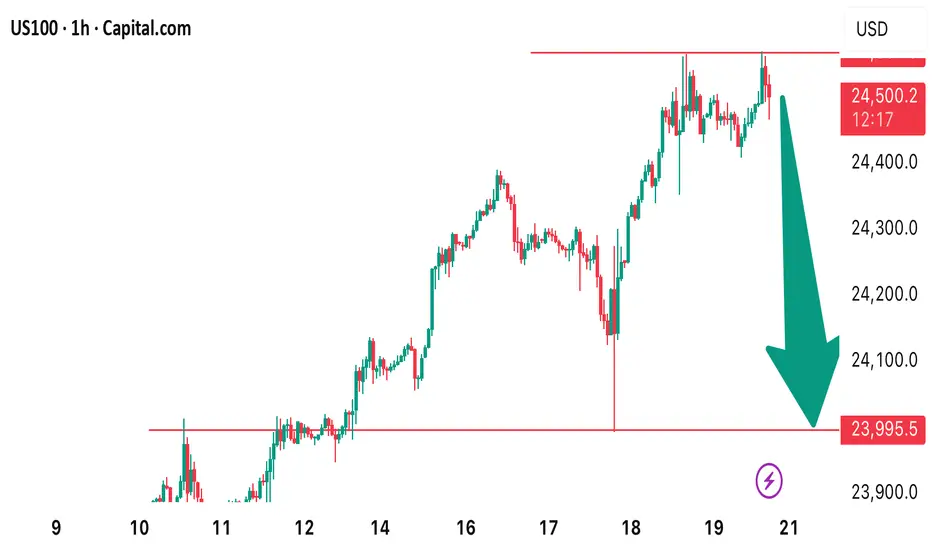
Nas100 Trade Set Up Sep 26 2025Price is overall still bearish so i am expecting a sell off from the 4h FVG or a sweep of PDH
www.tradingview.com

NASDAQ100 HIGH PROBABILITY SETUP SOON!!!🚨 NAS100 HIGH PROBABILITY BUY SETUP 🚨
* Here We Can See Clearly The Next Potential Move For US100 Next Hours/Days.
* Keep Your Eyes Close On Your Trading Positions.
* Happy PIP Hunting Traders.
FXKILLA.

NAS100 Technical Breakdown | Bearish Play in MotionWe're currently observing a strong 1H bearish imbalance (FVG) rejection zone that aligns perfectly with the recent 15m resistance block, leading to a swift rejection in price.
Price action has respected the HTF liquidity zones and is now following through on the anticipated drop towards 1H Support 📉.
The confluence of the descending momentum, HTFL levels, and FVG fill strengthens the case for continued bearish movement in the short term.
📌 Key Levels to Watch:
Resistance Zone: 24,940 – 24,975
Mid Support: 24,793 – 24,780
Major Support: 24,712 – 24,699 (potential liquidity sweep zone)
⚠️ Watch for reaction at the trendline and lower HTFL levels – they may offer a potential bounce or continuation setup depending on the momentum.
🧠 Trade Smart: Wait for confirmation before entering. Don't chase – let price come to your levels.
💬 What’s your bias on NAS100 this week? Drop your thoughts below! 🔽
Greetings,
MrYounity

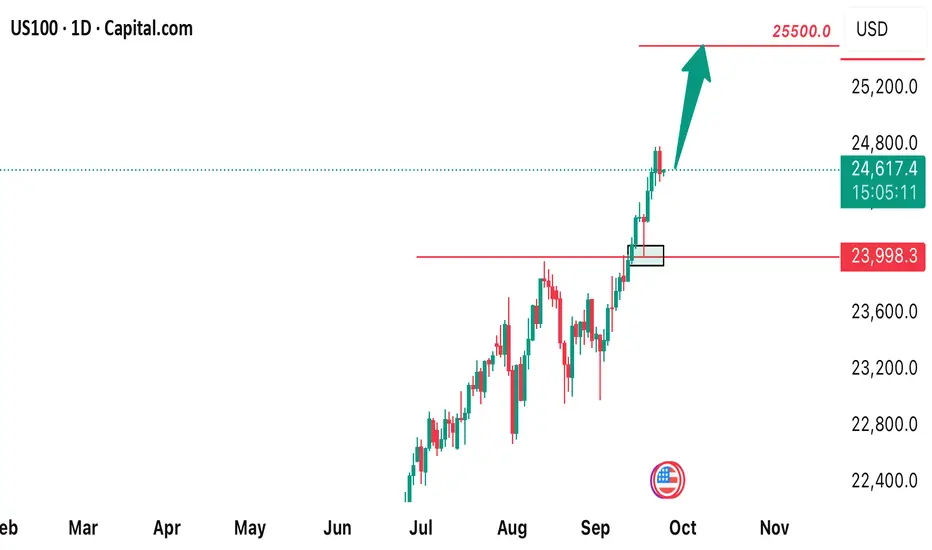
US100 BULLISH CONTINUATION IDEAWe’re currently on a strong bullish trend! We are continuing to long this pair till it get to all time high price of 25500 that’s our overall buy target. Opt in for a buy and take advantage of this opportunity!
Nasdaq correction trendThe overall trend of the Nasdaq is bullish, but at the moment we can expect a bearish reaction by reacting to the MPL supply ranges until the price reaches good demand ranges.


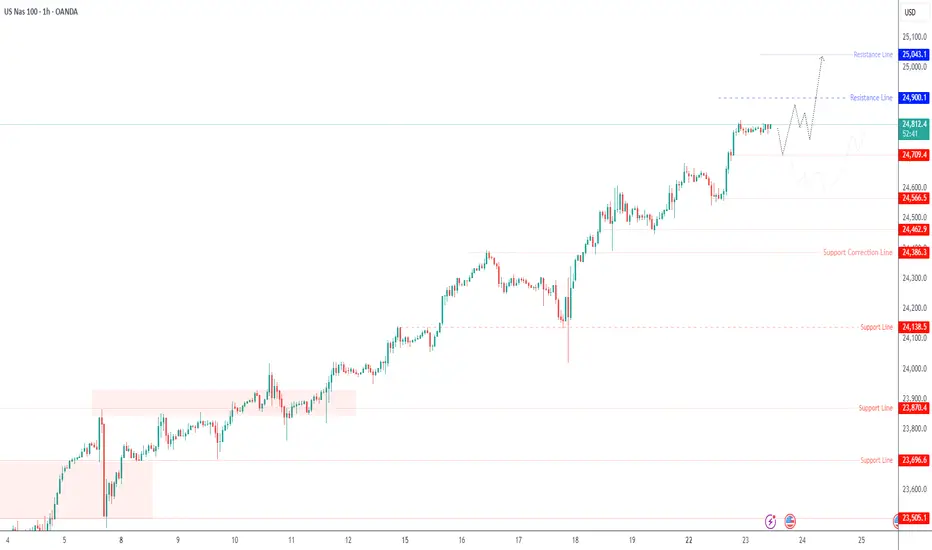
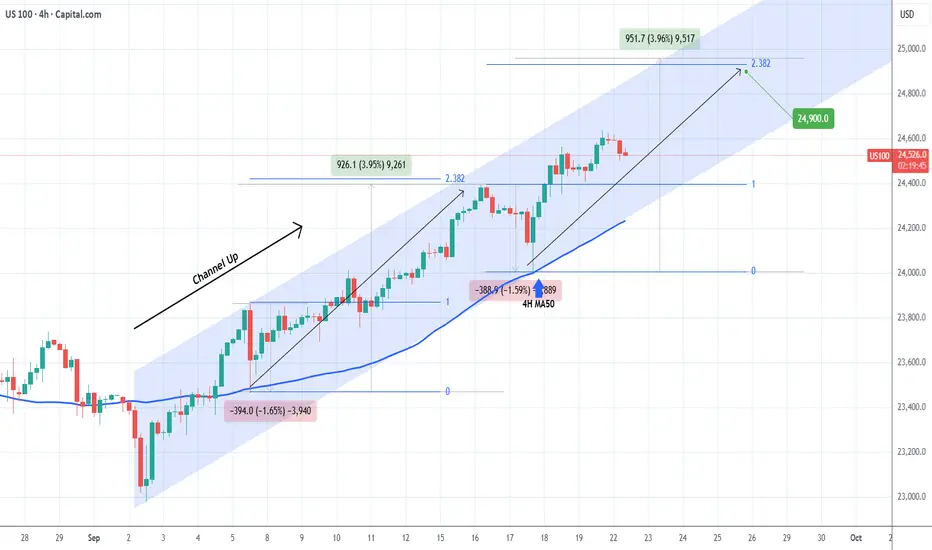
NASDAQ September's Channel Up targets 24900.Nasdaq (NDX) has been trading within a Channel Up since the September 02 Low and at the moment it is unfolding its 2nd Bullish Leg following the 4H MA50 (blue trend-line) bounce on September 17.
Based on the previous 4H MA50 Bullish Leg, the sequence should peak below the 2.382 Fibonacci extension at a maximum +3.96% rise. Our Target is slightly below those at 24900.
-------------------------------------------------------------------------------
** Please LIKE 👍, FOLLOW ✅, SHARE 🙌 and COMMENT ✍ if you enjoy this idea! Also share your ideas and charts in the comments section below! This is best way to keep it relevant, support us, keep the content here free and allow the idea to reach as many people as possible. **
-------------------------------------------------------------------------------
💸💸💸💸💸💸
👇 👇 👇 👇 👇 👇
Nasdaq - USTEC: Trading Edge TodayDear Friends in Trading,
Experimental Test Phase Week:
Correlation Logic & Daily Efficiency - GOLD🔄NASDAQ🔄DOW JONES
🔎 Previous Week Observations -
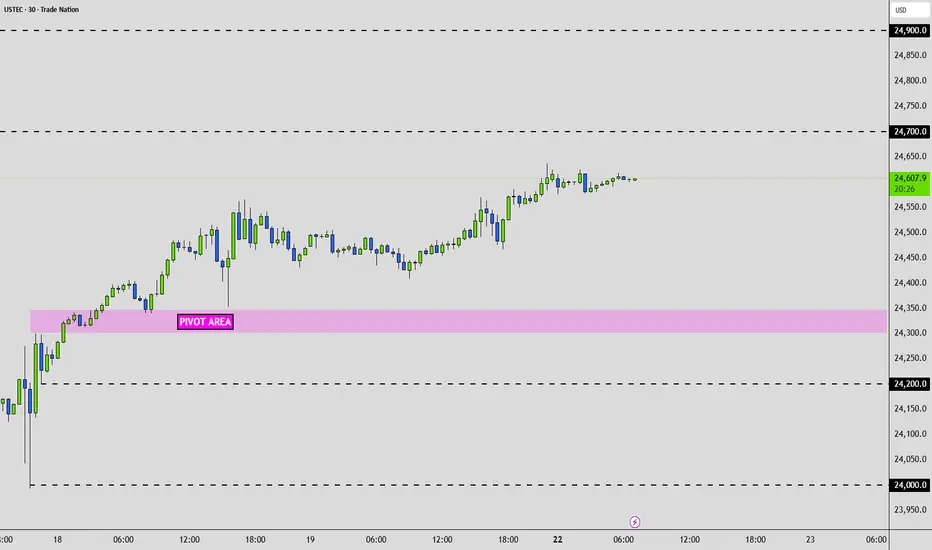
Strong accumulation & clustered trading between 24,300 – 24,350.
This is where most volume likely sat (clustered POC zone).
Breakout above 24,400 carried price strongly higher.
Current price (~24,615) is sitting above last week’s value area, riding momentum.
USTEC - 22Sept:
Pivot: 24,300 – 24,350
Bias: Bullish while above pivot
Bull targets: 24,700 → 24,900
Bear targets: 24,200 → 24,000
👉 Nasdaq leading tech momentum.
Stronger risk appetite = supports US30 as well, usually opposite Gold.
I sincerely hope my point of view offers a valued insight.
Thank you for taking the time study my analysis.
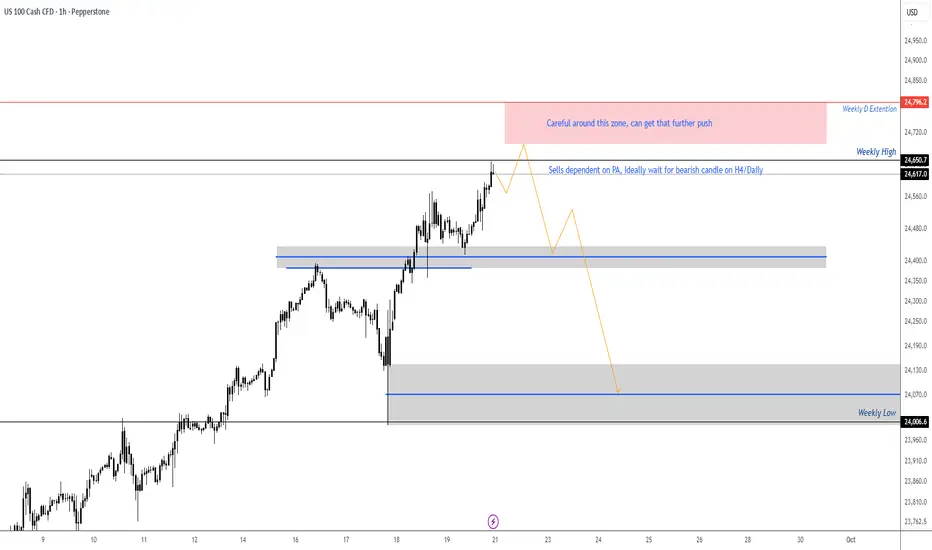
NASDAQ - setting up for Bearish SetupLooking for the bearish signal or the H4/Daily time frame, might get that final push for the D extension on the weekly timeframe, opening of the week might get a small pullback then continuation to the upside. Trade will be validated only if we get bearish PA setup on the H4/Daily. Looking for the setup to create a turn shape then can look for potential entries. If price does not present a bearish setup on the H4/Daily then the plan is no longer valid.
same stratlooking for first 1m resistance in this order block.
short it back to thsi main support zone
US100 is Forming equal highs- possible sell opportunity!Price is forming a double top in H1 timeframe. We high a high probability to see a sell off from that all time high. A sell opportunity is envisaged from the current market price.
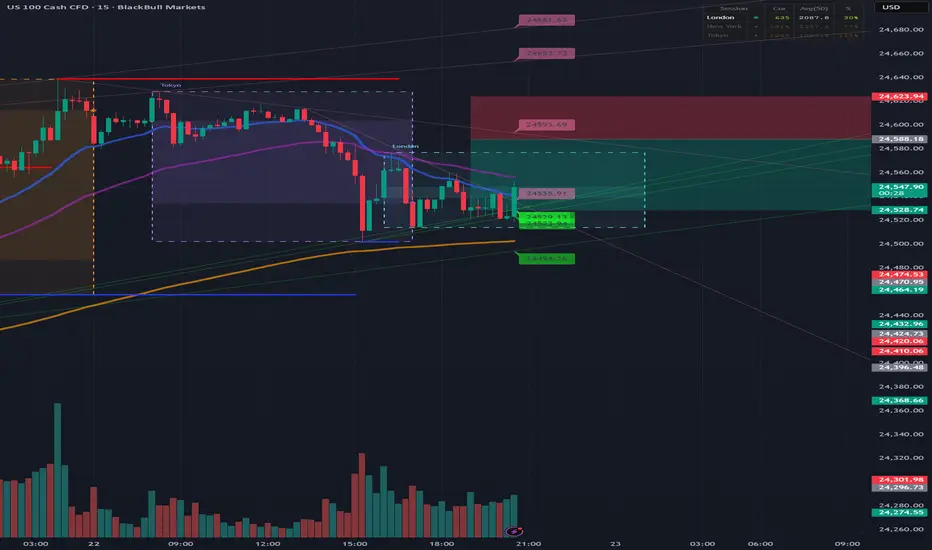
US NAS100Preferably suitable for scalping and accurate as long as you watch carefully the price action with the drawn areas.
With your likes and comments, you give me enough energy to provide the best analysis on an ongoing basis.
And if you needed any analysis that was not on the page, you can ask me with a comment or a personal message.
Enjoy Trading ;)

USTEC - Trading Edge TodayDear Friends in Trading,
🎯Trading Edge:
Tech leading breakout momentum with institutional accumulation above POC
Key Level: 24,800 (volume gap fill)
Pivot: 24,650 – 24,700
Bias: Bullish above pivot
Bull target: 24,800 → 25,000
Bear target: 24,600 → 24,400
Correlation: +88% with US30, +52% with Gold (Fed trade)
Risk Assets Alignment:
GOLD🔄USTEC🔄US30
✅Gold + USTEC + US30 all bullish above pivots = Fed dovish trade confirmed
✅Unusual Gold/equity positive correlation suggests monetary policy driving both higher
Assets Overbought:
🔴USTEC - 4HR Overbought Divergence Detected
I sincerely hope my point of view offers a valued insight.
Thank you for taking the time study my analysis.

NAS100USD Technical AnalysisThe NAS100 has been in a strong bullish structure, creating higher highs and higher lows. After recently tapping 24,800.0 resistance, price rejected and is now pulling back toward the 24,583.1 area, which is acting as short-term support.
Support at: 24,583.1 🔽 / 24,393.3 🔽 / 24,099.2 🔽
Resistance at: 24,800.0 🔼
🔎 Bias:
🔼 Bullish: If buyers defend 24,583.1 and push price back toward 24,800.0, a breakout could open the way for continuation higher.
🔽 Bearish: A clean break below 24,583.1 exposes 24,393.3, and failure there could invite a deeper correction toward 24,099.2.
📛 Disclaimer: This is not financial advice. Trade at your own risk.
