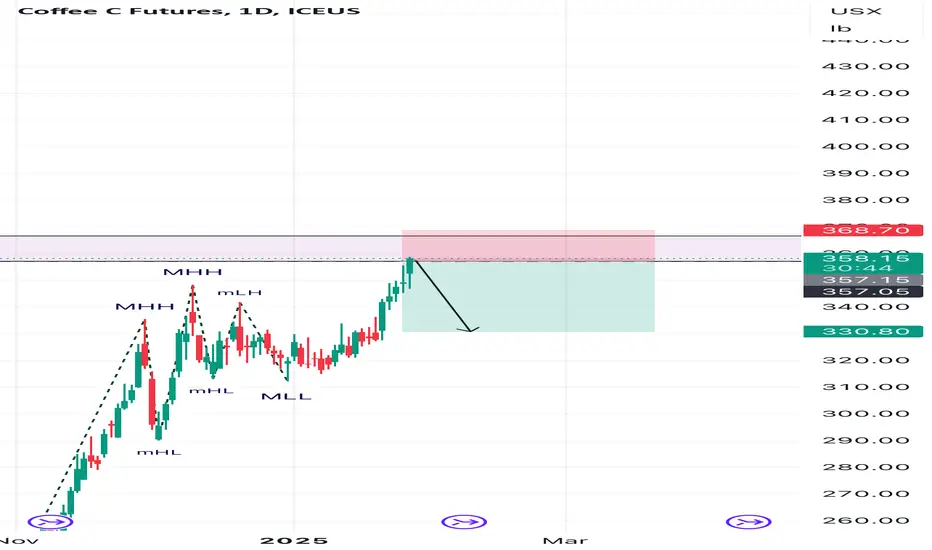
The Coffee Code: A Short Opportunity Hidden in Plain SightThere is a difference between seeing the market and truly understanding it. Most traders react. The enlightened anticipate.
This week, the COT strategy has illuminated a setup so clear, yet so overlooked, that only those who understand the deeper language of the markets will act. Coffeewhispers a warning, and few are listening.
The Codes Have Been Revealed:
🔻 Code 1: Commercials' COT Index – The real insiders, the ones who move markets, are at a bearish extreme. The last time we saw this setup? A major reversal followed.
🔻 Code 2: Positioning Extremes – Large specs are at an all-time high in longs. When the herd rushes in, exits become crowded.
🔻 Code 3: Advisor Sentiment – The so-called “experts” are euphoric. When advisors scream bullishness while commercials quietly stack shorts, it’s a sign. A big one.
🔻 Code 4: Valuation – Coffee is severely overvalued relative to Gold, Treasuries, and the Dollar. The weight of reality will soon press down.
🔻 Code 5: ADX Over 60 – A high ADX signals a trend’s climax. The moment it rolls over is the key to this code triggering the move.
🔻 Code 6: Seasonality – Mid-February to March? Historically, a time of decline. The cycle repeats for those who see it.
🔻 Code 7: Cycles Colliding – Multi-timeframe cyclical pressure is now aligned against coffee.
The rarest and most powerful force in motion.
Additional indicators confirm it. Distribution. Divergences. Ultimate Oscillator. Williams ProGo. %R sell zones. Every signal is flashing red.
And yet, most will hesitate. Most will ignore the signs. They will wait until it's too late.
The question is not whether the opportunity exists. It’s whether you can see it.
If you understand what’s written here, you already know what comes next.
If you don’t... then perhaps it’s time we talked.
Disclaimer
The information provided in this content is for educational and informational purposes only and should not be construed as financial advice, investment recommendations, or an offer to buy or sell any securities or financial instruments.
Trading financial markets involves significant risk, including the potential loss of capital. Past performance is not indicative of future results. You are solely responsible for your trading decisions and should conduct your own research or consult with a licensed financial advisor before making any financial decisions.
The creator of this content assumes no liability for any losses or damages resulting from reliance on the information provided. By engaging with this content, you acknowledge and accept these risks.
Acknowledgment
The strategies and concepts taught in this class draw significant inspiration from the works and teachings of Larry Williams, a pioneer in trading and market analysis. His groundbreaking research and methodologies have shaped the foundation of modern trading education.
While this class incorporates Larry Williams’ principles, the content has been adapted and presented to reflect my own understanding and application of these ideas. Full credit is given to Larry Williams for his original contributions to the field of trading.
ICF1! trade ideas

KC1!, Short, 1D✅ KC1! (Coffee Futures) is overbought and has formed a clear Hanging Man candlestick, signaling a potential reversal. The price is expected to move lower, targeting the key support level at 340.25.
SHORT 🔥
✅ Like and subscribe to never miss a new analysis! ✅

COFFEE // on the way upThe market is long on every timeframe, and broke the last clean H1 breakdown, so the weekly target fibo 138.2 level is valid again.
KEEP IT SIMPLE!🏄🏼♂️
———
Orange lines represent impulse bases on major timeframes, signaling the direction and validity of the prevailing trend by acting as key levels where significant momentum originated.
Level colors:
Daily - blue
Weekly - purple
Monthly - magenta
H4 - aqua
Long trigger - green
Short trigger - red
———
Stay grounded, stay present. 🏄🏼♂️
<<please boost 🚀 if you enjoy💚

Coffee KC - Why I see $390 and $470 as possibleThe Medianlines project the most probable path of price. It's not a fortunetelling tool. It's a technical tool which is based on serious statistical research.
So, what I do when I use it is, using statistical proven evidence on a graphical basis, supported by a definite trading framework.
Why do I pound on these information?
Because it's important to understand what Medianlines aka Pitchforks are based off, and what they are good for in trading. No "Magic", just a tool that helps a trader/TA in it's daily Job.
ANALYSIS OF COFFEE
The up-sloping white Fork shows us the most probable path of price. It's up. Price blew through the Center-Line, found support, and advanced even more to the upside from there.
Then we have the slanted yellow dashed lines.
What are they?
Many say this is a action/reaction thingy.
Others say, it's a timing tool.
I say, it's both.
The way I use it, it takes in the angle from the last real high, and the low of the pullback from it. Then I go back to the last low before the new high. This creates an Angle, and a width. Combined it gives us not only a potential timing, but with the dynamic of price movement also potential resistance/support.
So, we can see where we got such signals - where the orange circles are. The second one intersects very nicely with the Center-Line of the white Fork. I observe this "incident" often when I use them.
Back to Coffee...BRB §8-)
We see the time/price line intersecting with the 1/4 line of the Fork. I expect a reaction there - even a pullback back to the Center-Line is possible from there.
But if price also blows through this level, then I know that the next Target will be the Upper-Medianline-Parallel.
So, there we have it.
I hope you can take away some knowledge from this post and thanks for all the boosting and following folks.

Coffee short Fundamentals showing that coffee going to go down
Will be shorting from that zone
Let’s go⬇️
Analyzing Coffee Futures: Key Insights for Traders and InvestorsICEUS:KC1!
The coffee futures market has recently attracted attention from traders and investors due to significant price movements. On December 10th, the commodity reached new historical highs, surpassing a record set in 1977. This post will analyze the current trends in coffee futures, key technical patterns, and provide insights into what may happen next for this important commodity.
Coffee Futures at a Glance 📈
New Historical Highs:
On December 10th, coffee futures hit $348, breaking the previous record of $339 set in 1977.
Key Technical Patterns:
A bearish crab pattern has formed at the $333 level, suggesting potential downside risks.
The Case for a Pullback or Consolidation 🔄
After reaching new highs, the coffee market could face a period of consolidation or a potential pullback. It’s not unusual for commodities to experience a cooling-off phase after such a strong rally. In this case, the price of coffee could correct lower, especially after a sharp upward movement.
Bearish Crab Pattern at $333
The formation of a bearish crab pattern at $333 suggests a possible downward movement.
A deeper pullback could take the price as low as $269, representing a 16% drop from current levels.
This potential correction is supported by technical analysis, including Fibonacci retracement levels.
Divergence Signals Indicating Weakness ⚠️
Another key factor to consider is the divergence in market indicators. Since the highs of April last year, there have been consistent signs of divergence, particularly with the Relative Strength Index (RSI). The latest price peaks have failed to match new RSI highs, signaling weakening momentum.
Factors Driving Potential Downside Pressure ⬇️
New Historical Highs:
While reaching a new high is exciting, it often leads to a correction or profit-taking, especially after a strong rally.
Bearish Divergence:
The failure of the RSI to match price highs is a classic signal of weakening buying pressure.
Bearish Crab Pattern:
This technical pattern, formed at the 1618% Fibonacci extension, further supports the case for a potential downturn.
What’s Next for Coffee Futures? 🔮
The outlook suggests caution in the short term. The combination of new historical highs, bearish divergence signals, and the formation of a bearish crab pattern presents a strong case for a pullback or period of consolidation. The potential target for this correction could be as low as $269, a significant drop from current levels.
However, as always, it’s important to stay alert and monitor the market closely for any changes in momentum. Technical indicators and patterns like the ones discussed here can provide valuable insights, but the market can be unpredictable. Traders should consider these insights while managing risk and staying prepared for potential shifts in the market.
For further updates and insights on the latest movements in coffee futures, stay tuned for future posts and analysis.
Happy Trading,
André Cardoso

Coffee reached it's BalancePrice reached the Center-Line and is back to Balance. From here it could jump above the CL or get rejected and turn south.
I would stalk a short in the Weekly/Daily time-frame.

Are Global Coffee Markets Brewing a Crisis Beyond Price?In an unprecedented turn of events, the coffee industry faces its fifth consecutive season of demand surpassing production, driving prices to their highest levels in nearly half a century. This isn't merely a story of market dynamics – it's a complex narrative where climate change, shifting consumption patterns, and agricultural sustainability converge to reshape the future of the world's favorite beverage.
The situation has reached a critical juncture as major producing regions struggle with severe weather disruptions. Brazil's drought-stricken Arabica crops and Vietnam's weather-battered Robusta production have created a perfect storm in the market. Volcafe's dramatic reduction of its 2025/26 Brazilian production forecast by 11 million bags underscores the severity of these challenges. China's 60% surge in coffee consumption over five years adds pressure to an already strained supply chain.
Perhaps most concerning is the structural nature of these challenges. Traditional growing regions, from Kenya's prestigious AA bean farms to Brazil's vast coffee plantations, face existential threats from climate change. The delicate balance required for premium coffee production – specific humidity levels, temperature ranges, and rainfall patterns – is increasingly difficult to maintain. One industry expert notes that suitable growing areas continue to shrink, suggesting current market pressures may become the new normal rather than a temporary disruption.
This convergence of factors presents both challenges and opportunities for investors, industry stakeholders, and consumers alike. As major producers like Nestlé and J.M. Smucker announce price increases for 2025, the industry stands at a crossroads. The future of coffee will likely be defined not just by how we manage immediate supply challenges, but by how we adapt to an*56C3VFGBHd innovate within these new environmental and market realities.

Can Coffee's Future Brew a Global Economic Storm?In the high-stakes world of global commodities, coffee has emerged as an unexpected harbinger of economic complexity, revealing how climate volatility can transform a morning ritual into a geopolitical and financial chess game. The current market is experiencing unprecedented turbulence, with Arabica coffee prices surging over 80% in 2024, shattering decades-old records and signaling a profound disruption in one of the world's most beloved agricultural products.
This dramatic price escalation is not merely a statistical anomaly, but a stark illustration of interconnected global systems under extreme stress. Brazil and Vietnam, the twin titans of coffee production, have been ravaged by climatic extremes—from the most severe drought in 70 years to unpredictable rainfall patterns—creating a perfect storm that threatens not just coffee supplies, but exposes the fragile underbelly of global agricultural supply chains. Leading traders like Volcafe are projecting an unprecedented fifth consecutive year of supply deficits, a scenario that challenges traditional market resilience and demands innovative strategic responses.
Beyond the immediate economic implications, this coffee crisis represents a microcosm of broader challenges facing our increasingly complex and climate-vulnerable global economic ecosystem. As major manufacturers like Nestlé begin to signal potential price increases and package reductions, consumers and businesses alike are forced to confront a fundamental question: How do we build sustainable, adaptable systems in an era of escalating environmental uncertainty? The coffee market's current volatility is not just about a potential price hike in your morning brew, but a compelling narrative about resilience, adaptation, and the intricate dance between human enterprise and natural systems.
For the astute observer and strategic thinker, this coffee market disruption offers a compelling lens through which to examine broader economic trends. It underscores the critical importance of diversification, technological innovation, and proactive risk management in an era where climate change is no longer a distant threat, but an immediate and transformative economic reality. The story of coffee in 2024 is more than a commodity report—it's a provocative invitation to reimagine our understanding of global economic interdependence.

Arabica Coffee Futures. The Canary in the Coal MineWith nearly 60 percent up path performance in 2024, Arabica coffee futures rose above $3.00 a pound, the highest mark since May 2011, as traders assess potential problems with next year’s crop in top producer - Brazil.
Despite recent rains, soil moisture levels remain low, leading to limited fruit development and excessive leaf growth, local traders said.
U.S. and European coffee lovers are getting ready to tighten their belts as natural disasters have hit the world’s two largest coffee-producing countries, causing commodity prices to more than double in the past five years.
Droughts in Brazil, the world’s largest coffee producer, and severe typhoons in Vietnam, the second-largest producer, have severely disrupted the global coffee supply chain, driving up production costs that are increasingly being passed on to consumers.
In addition, there are reports that Brazilian coffee farmers are holding back shipments of coffee to the market in hopes of higher prices, leading to further shortages, tighter supplies of coffee on the spot market, and higher prices.
Coffee is literally the “Canary in the coal mine,” signaling climate change, the ecological crisis, and its impact on agriculture.
The idiom originated within the Industrial Revolution in England (back to late XVIII century), when coal miners, lacking modern gas-monitoring equipment, would take canaries (birds) into the coal mine with them. And when dangerous gases like carbon monoxide (which is odorless) accumulated in excess in the mine, they stopped the birds chirping and killed the canaries before killing the miners, thus providing a warning to leave the tunnels immediately.
As some of the world’s largest coffee-consuming regions, coffee lovers in the United States and Europe will find the price hikes particularly hard to stomach.
According to German consumer data company Statista, Europeans consume about 3.2 million tons of coffee a year, accounting for nearly 33 percent of the world’s total coffee consumption, while Americans drink 400 million cups of coffee daily (which equates to 146 billion cups of coffee consumed in the United States each year, or nearly four cups a day for every American adult).
In fact, coffee is more than just a morning ritual in the United States; it has become a cultural and business driver.
But understanding the depth of America’s love affair with coffee may be as complex as the drink itself, and of course, more complex than the current coffee prices.
Natural disasters have taken a heavy toll.
Brazil, which accounts for about 40% of the world’s coffee production, is battling one of its worst droughts in decades. Dry conditions have severely impacted Arabica-growing regions, reducing yields.
The 2023–24 crop cycle is already seeing a sharp drop in production, with some estimates suggesting output could fall by as much as a fifth (20%).
The impact is being felt most acutely in Minas Gerais, Brazil’s largest coffee-producing state and home to high-quality Arabica, which has seen months of lower-than-normal rainfall.
Brazil’s farmers are battling the country’s worst drought in seven decades and above-average temperatures.
While Brazil dominates the Arabica market, Vietnam is the world’s leading producer of the cheaper Robusta beans used in instant coffee. Earlier this fall, Typhoon Yagi devastated the country’s main coffee-growing regions in the Central Highlands, killing at least 60 people and injuring hundreds more.
Thousands of hectares of coffee plantations were estimated to have been damaged, leading to significant losses in both the current crop and future production potential, as the damaged trees will take years to recover.
A perfect storm of environmental concerns has driven prices to all-time highs, above US$3.00 per pound of coffee beans.
The combined impact of drought in Brazil and the typhoon in Vietnam has sent global coffee prices soaring. The International Coffee Organization (ICO), an intergovernmental body made up of coffee-exporting and -importing countries, reported that prices rose nearly 20% in the third quarter of 2024, reaching their highest level in nearly a decade.
The ongoing effects of climate change make a quick return to stability difficult. The sector remains vulnerable to extreme weather conditions, which could further disrupt future harvests. In addition, growing global demand, particularly in emerging markets such as Asia, could continue to put upward pressure on prices, further slowing recovery efforts.
As the world’s two largest coffee producers struggle to recover from the crisis, the outlook for the global coffee market remains uncertain.
Climate change is reducing the area of land suitable for growing coffee crops, and extreme weather events are becoming more frequent, creating a range of challenges for the sector and coffee drinkers in the US and Europe.
In technical terms, the main 12-month graph of coffee prices indicates another buyers attempt to storm the round, 250-cent mark.
Since the price is near to consolidate by the end of the year above this round number, it can contribute to a further rally and multiple price growth in the foreseeable future.

Coffee Tuesday this is a quickie on coffee since it's very close to its all-time high and it looks like a setup that will sooner or later start going lower. I explained some of the details looking at the tools we like to use.... and I am willing to take a chance that the market will range and if it doesn't that's okay.

KC COFFEE 50 Year Range Short-This might seem like a "troll trade" but Coffee is held this 50-year range since 1975.
-Price is high on the range and straight-up shorting getting out at a 50% gain seems like
a high probability trade.
Thoughts?

A review Of about five markets11.18.24 this is a long video I would be looking for a reversal and a trade lower on the ES . coffee is trading towards its all-time high. oil is contracted and it's not a good trading opportunity for me. I talked about gold and silver

Will Today’s Coffee Market See a 15¢ Drop Like April 18?The coffee market is currently testing its support range around 240-260, but recent patterns suggest a bearish outlook. Looking back at April 18 and September 6, we saw sharp price drops of 15¢ and 10¢, respectively, in a single session—both on the back of bearish signals that are resurfacing today. With the added downward pressure of typical Monday trading, today’s movement could follow a similar path, potentially driving prices down to 233 or even challenging the lower blue band at 230.
If the price breaks below 230, it would signal a shift in momentum and open the door for further declines. I should watch for strong volume on any drop below this level, as it could confirm a break in support and set a new range in motion.
Given my strategy to enter on a reversal bar, consider waiting for confirmation that price has indeed tested or broken the support around 233 or 230. If the price drops to those levels, look for a reversal signal—such as a bullish engulfing or hammer pattern—forming at or just below these key support zones.
My entry level:
Short Strategy
First Level: Follow advanced school run strategy as it is quite a break-out set-up.
Second Level: Reversal bar around Yesterday High 249
Long Strategy
First Level: If the price reaches around 233 and shows a reversal bar with strong buying volume, this could be a favorable entry.
Second Level: Should the price break to 230 and quickly rebound with a clear reversal pattern, this would serve as another possible entry point.

Arabica Coffee Futures
Uptrend: The price appears to be in an uptrend, especially in the most recent period. The price has broken out to the upside and is continuing higher, with higher highs and higher lows.
Support is visible around the 300.00 level, where price previously consolidated.
Resistance may emerge near the 330.00 level, where the price is currently approaching.
The price is trading near the upper Bollinger Band, which may suggest that the market is overbought. However, during strong uptrends, prices can stay near the upper band for an extended period.
The bands are expanding, indicating increasing volatility, which often accompanies trending markets.
There has been a noticeable increase in volume during the breakout phases, particularly in July and September. This signals that the current price moves are supported by market participants, adding strength to the trend.
Consolidation and Breakout: The price experienced a period of sideways movement (consolidation) before breaking out around late August. This suggests that bulls are gaining strength.
Candlestick Patterns: There seem to be several bullish candlestick formations near the recent lows, supporting the current rally.
The short-term trend is bullish, with potential for the price to continue rising if it clears the 330.00 level resistance.
However, as the price is near the upper Bollinger Band, there could be a short-term pullback or consolidation before continuing higher.
If a retracement occurs, look for support around the moving average or near the 310.00–300.00 range, which aligns with previous consolidation zones.

Dollar was strong today should lead to Corrections lower for theThe dollar went up today this means that there should be some downward pressure on the metals. a number of markets are starting to range and they gave some examples of that in the video.

Bitcoin coffee soybean oil9. 17. 24 in this video I am following up on some comments that I made yesterday. I was looking for these markets to trade in a certain direction but I couldn't initiated trade for various reasons that I explained. it turns out that the next trading day the market produced the trigger for those markets to go higher and I want you to see how that works. if you think you have a good setup a lot of times the market will give you the trade but it's better to wait for the proper trigger then it is to just blindly go into a market that you generally think is going in a Direction but you're not really seeing exactly what you want and I believe that kind of thinking will create tremendous frustration for the trader. and the good thing is you will be able to find trades ahead of time and this is a good thing as long as you are not impulsive and are willing to give the market some time to give you a better probability that you'll be correct if you wait.

Coffee: DownhillWe expect the downward trend to continue with the blue wave (b) to the support at USX 179.35. However, if the price breaches the resistance at USX 265.75 (39% probable), we will have to expect a new wave alt.(a) high.

Buy Dec. coffee 236.10 limit.If filled stop@228.90 target@244.70Buy Dec. coffee at 236.10 on limit. If filled, place a stop at: 228.90, target at 244.70
Coffee is trying to establish an upside leg.

KC LongKC starting a move up that could be very aggressive.
Pls. see record for explanation.
Thank you.

Buy July Coffee 211.30 limit, if filled stop at 209.20, tgt at Buy July Coffee 211.30 limit, if filled stop at 209.20, tgt at 229.60.

Coffee Futures: Bearish Confluence Indicates Potential Short PosIn the coffee futures market, recent analysis reveals a significant bearish outlook. The Commitment of Traders (COT) report indicates that commercial traders are holding major short positions. Additionally, seasonal patterns suggest a tendency for bearish momentum during this time of the year, further reinforcing the downtrend.
Technical Analysis and Confluences
Supply Area and Fibonacci Levels:
Price Action: The price has reached a key supply area, suggesting a potential retest and subsequent decline.
Fibonacci Confluences: Various Fibonacci retracement levels align with this supply area, adding strength to the bearish case.
Momentum Indicators:
Overbought Conditions: On the H4 timeframe, momentum indicators such as the RSI show that the market is currently in overbought territory. This typically precedes a price correction or reversal.
Seasonal Trends:
Historical data indicates that coffee futures often experience bearish pressure during this period. This seasonality aligns with the current technical setup, suggesting that the market could follow its usual pattern of decline.
COT Report Insights:
The COT report underscores that commercial traders, often considered the "smart money," are heavily short. This position by commercial traders can be interpreted as a strong bearish signal, given their historical accuracy in forecasting market movements.
Trading Strategy
Given the combination of a bearish COT report, seasonal trends, and technical indicators showing overbought conditions and resistance at the supply area, we are considering opening a short position in coffee futures.
Key Points for the Short Position:
Entry Point: Around the current supply area, taking into account Fibonacci retracement levels.
Stop Loss: Just above the supply area to manage risk.
Target: Based on historical support levels and previous price actions, aiming for a significant downward move in line with seasonal and COT report signals.
By aligning our strategy with these confluences, we aim to capitalize on the anticipated bearish momentum in the coffee futures market.

Coffee Primed for a DeclineLike FOREX pairs, commodities are often very long to correct and have blow off tops. While I'm not certain on the long term count, I can isolate a highly probable next move in a flat pattern visible clearly on the daily timeframe. Where that flat pattern fits in to the bigger picture doesn't much matter. As Elliotticians, we want to "catch the three." As in, wave 3 is often a very powerful move. As can be seen by the chart below, it's a very reasonable and highly confident setup that Coffee will initiate a nice decline.
