ES (SPX, SPY) Week Ahead Analysis, Nov 3rd - Nov 7thMarket Context
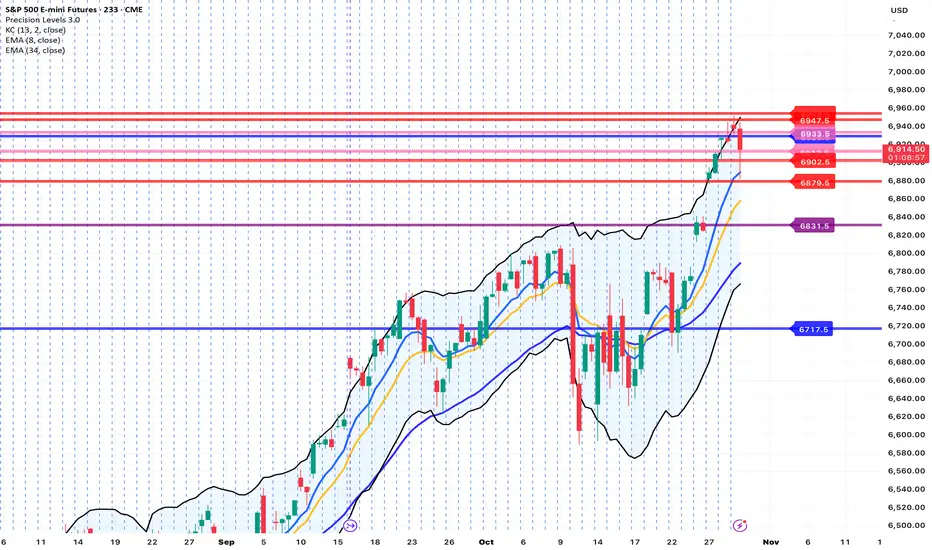
The price is currently positioned just below a key near-term resistance level at 6,900–6,906, following a sharp reversal on Friday from around 6,845. The daily and 4-hour structures indicate an incomplete "weak-high" area above, but the 1-hour momentum has just shifted upward from oversold conditions. As we move into the Asia/London sessions, I anticipate a balance formation within the upper half of the previous session unless we see a decisive 15-minute close above 6,906.
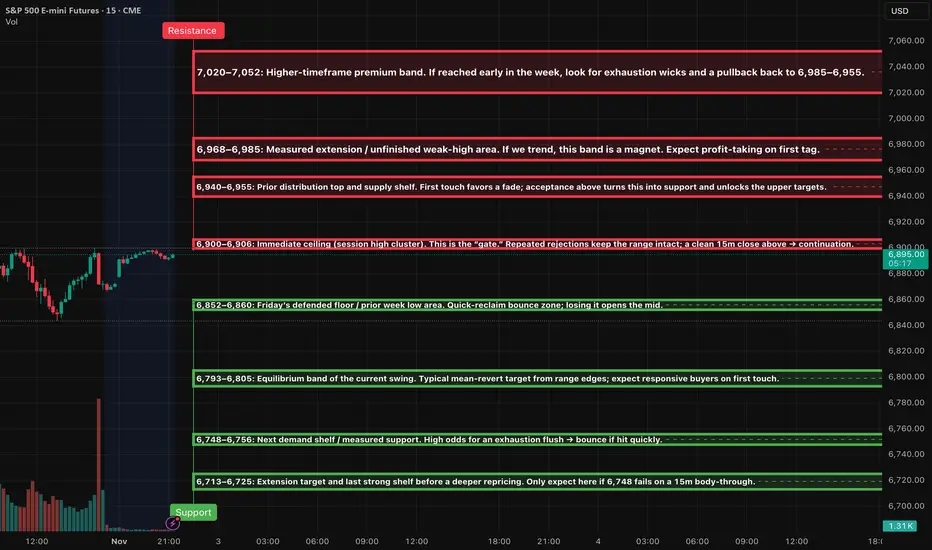
Short — Rejection Fade at 6,900–6,906
Trigger: 15m rejection close back below the band → 5m re-close down with a lower high → 1m first pullback fail.
SL: Above the 15m wick high +0.25–0.50.
TP1: 6,880 → 6,860 (≥2.0R gate). TP2: 6,805.
Notes: If a retest holds below 6,900, add on a fresh 1m LH.
Short — Rejection Fade at 6,940–6,955
Trigger: Same 15m→5m→1m sequence as above.
SL: Above the band’s 15m wick +0.25–0.50.
TP1: 6,900 gate; TP2: 6,880–6,860; stretch TP3: 6,805.
Long — Acceptance Continuation above 6,906
Trigger: 15m full-body close above 6,906 → 5m pullback holds and re-closes up → 1m HL entry.
SL: 5m pullback low −0.25–0.50.
TP1: 6,940–6,955; TP2: 6,968–6,985; stretch TP3: 7,020–7,052.
Notes: If 6,906 holds as support on retest, consider scaling on a clean 1m HL.
Long — Quick-Reclaim Bounce at 6,852–6,860
Trigger: Sweep/flush below the band and instant reclaim (1–3m), confirmed by a 5m re-close up → 1m HL entry.
SL: Below the sweep low −0.25–0.50.
TP1: 6,900 gate; TP2: 6,940–6,955.
Long — Quick-Reclaim Bounce at 6,793–6,805
Trigger: Same reclaim logic; prefer fast tag → quick pop.
SL: Below the 5m reclaim low −0.25–0.50.
TP1: 6,860; TP2: 6,900; optional TP3: 6,940.
Long — Exhaustion Flush Bounce at 6,748–6,756 (stretch 6,713–6,725)
Trigger: Fast liquidation into the band + momentum divergence → 5m reversal close → 1m HL entry.
SL: Below the exhaustion low −0.25–0.50.
TP1: 6,793–6,805; TP2: 6,860; trail only after TP2.
Short — Continuation Below 6,852
Trigger: 15m body-through below 6,852 that holds on retest → 5m LH → 1m pullback entry.
SL: Above the 15m break wick +0.25–0.50.
TP1: 6,805; TP2: 6,756; stretch TP3: 6,725.
KILL-ZONES & EXECUTION NOTES
Primary execution windows: NY AM 09:30–11:00 and NY PM 13:30–16:00. London 02:00–05:00 optional, reduced size. Asia optional, smallest size.
Stops & viability: Anchor hard SLs to the relevant 15m wick; only take plays where TP1 ≥ 2.0R. Max two attempts per level per session. At TP1: close 70%, set 30% runner to BE; no trailing before TP2.
WEEK AHEAD GAME PLAN
If Monday holds above 6,860 and forms a higher low, the outlook is modestly bullish, aiming for a move toward 6,940–6,955 early to mid-week. A decisive daily close above 6,955 would suggest a rally into the 6,968–6,985 range, with the potential to extend further to 7,020–7,052 later in the week.
Conversely, if the price falls back below 6,852, the scenario shifts to a mean-reversion week, targeting 6,805 and then 6,756, with 6,713 as a potential stretch target.
Trade ideas
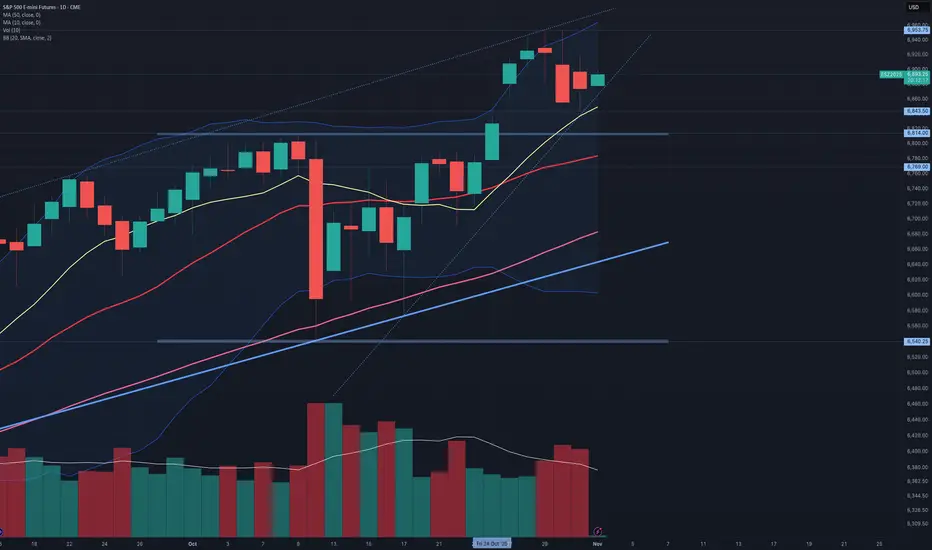
$ES_F $SPX $SPY: The song remains the same This song remains the same, at least during Globex. Several bearish weekly candlesticks, including those for $ES_F, SP:SPX , and AMEX:SPY so far, are not hindering the intense chasing buying pressure. The uptrend remains intact as long as the 10-day simple moving average continues to provide support. The recent weekly Doji could indicate a possible pullback if today's closing price falls below 6843. It's important to note that the volume did not support the breakout above the resistance level at 6814 on October 25, resulting in a new ATH. In contrast, there was a higher volume on Thursday and Friday, both of which closed with red candlesticks. Additionally, the average volume over the past two weeks has been decreasing.
ES Open GapSunday trading started with yet another open gap due to Japan pumping yet again (amazing). The Euros might fill the gap before US open though.
We might see some overnight swings on futures if Japan and EUrope are on two different pages.

S&P 500 (ES1!): Bullish! Buy This Dip!Welcome back to the Weekly Forex Forecast for the week of Nov. 3 - 7th.
In this video, we will analyze the following FX market: S&P 500 (ES1!)
The S&P500 is bullish, and buys are valid.
Price is currently in a +FVG, so looking for sells is prohibited!
If the +FVG fails, only then will buys become invalid.
Enjoy!
May profits be upon you.
Leave any questions or comments in the comment section.
I appreciate any feedback from my viewers!
Like and/or subscribe if you want more accurate analysis.
Thank you so much!
Disclaimer:
I do not provide personal investment advice and I am not a qualified licensed investment advisor.
All information found here, including any ideas, opinions, views, predictions, forecasts, commentaries, suggestions, expressed or implied herein, are for informational, entertainment or educational purposes only and should not be construed as personal investment advice. While the information provided is believed to be accurate, it may include errors or inaccuracies.
I will not and cannot be held liable for any actions you take as a result of anything you read here.
Conduct your own due diligence, or consult a licensed financial advisor or broker before making any and all investment decisions. Any investments, trades, speculations, or decisions made on the basis of any information found on this channel, expressed or implied herein, are committed at your own risk, financial or otherwise.

What is driving the market to the upside?You need to understand what is driving an asset market to the upside → to get a clear read if that driver has persitance & if it could reverse.
You want to correctly know why something is happening...
Where does CRYPTOCAP:BTC stand - lets dive in!
Lets start with an example:
What drove the crypto market so sharply higher in November 2024?
Did something fundamentally change on a macro level?
- no
On November 6, Trump was elected — and it wasn’t even traditional markets that reacted, but mainly crypto.
Crypto rallied aggressively purely on expectations surrounding the election anticipation of deregulation, potential pro-risk sentiment, “crypto-friendly” narratives, etc.
But when Inauguration Day came and nothing specific materialized to further justify that optimism, the rally became unsustainable.
The microstructure overheated, while macro fundamentals hadn’t changed at all.
That’s exactly why the S&P 500 didn’t rally alongside Bitcoin — it was an expectations trade, not a macro shift.
Then the first tariff news hit.
That was a real macro shock.
Trade relationships changed, growth expectations weakened — and naturally, the S&P started to fade.
Bitcoin, which was already sitting on a fragile market structure, followed lower.
This time it wasn’t just positioning — it was macro reality catching up: slower growth, tighter liquidity expectations, weaker global trade momentum.
The market then crashed further on tariff expectations,until that pressure ended around April 7.
From there, everything reverted sharply higher — because we’re still in a powerful credit-cycle expansion.
Since then, the S&P has absorbed every piece of news that doesn’t alter the macro picture.
Positioning unwinds get bought back quickly, and liquidity remains abundant.
So where does all of this leaves crypto right now?
Bitcoin currently has no internal reason to sell off aggressively.
Macro still points upward — growth, liquidity, credit — all supportive.
Only a real macro shift (not just noise) could sustainably push BTC lower, and if that happens, the S&P will fall too.
Until then, BTC is likely just waiting for the next catalyst — whether it’s a genuine macro change, another wave of expectations, or simply a market-maker-driven breakout.
Either way, as long as the macro backdrop doesn’t turn negative,
it’s just a matter of time before Bitcoin resumes higher.

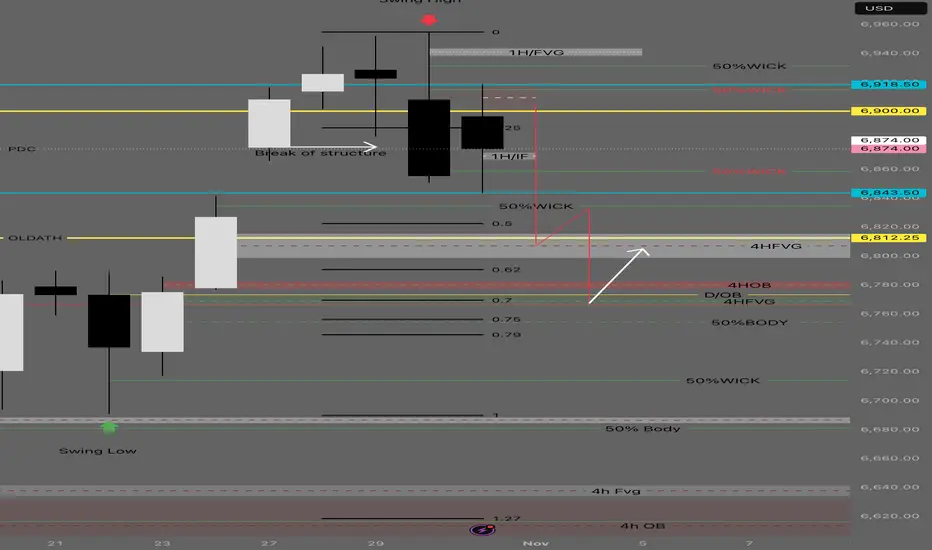
SP500 Bearish unless price consolidate and make a swing low!If price reject 6900 on Asia or London lower prices are more likely we are to premium. Discount area 6800 -6750 keeping bull trend intact. So be aware of bull traps.
Trading Rejection Strategy- A Visual Backtest💡 Overview
Here is everything you need to know about the strategy. But before you study it any further, all the visuals are at the end of this post- so don't miss that part.
This setup is built upon simple beliefs:
▶Price always remembers its key levels- Previous Day’s High (PDH), Previous Day’s Low (PDL)
▶Strong support/resistance zones often act as liquidity magnets.
▶When price revisits these areas and fails to break through, it gives us a clear rejection and that’s where the edge lies.
⚙️ Core Conditions
➡Price rejects PDH or PDL
➡Price retests a breakout / breakdown zone
➡Price rejects a tested support / resistance level
➡Timeframe: 15-Minute
➡Type of trade: Intraday only
➡Only one trade per day
🎯 Trade Plan
🔘Entry: One tick above/below the Pin Bar or reversal candle close
🔘Stop Loss: Just beyond the high/low of the rejection candle
🔘Target: Next liquidity zone (recent 15m swing or PDH/PDL)
🚫 Avoid Trading When:
➡No rejection at liquidity levels
➡Risk > 20 points
📊 October Backtest Results
(1 trade per day, tested manually)
Total trades taken= 14
Winners= 6
Losers= 8
Total points made out of winner= 263
Total points lost in losers= 75
Net points made= 188
🧠 Takeaway
Even though the backtest covers only October, the results are encouraging.
The logic is built on price behavior around institutional levels, and that tends to hold steady across time.
📈 Try extending the backtest further:
If results remain consistent, this could become a reliable rejection-based intraday setup worth adding to your toolkit.
Here is a visual to guide to all the Entries, Exits and about how it went.
Enjoy the charts and do let me know what you think about this strategy or if I missed an opportunity ;)
📣Disclaimer:
Everything shared here is meant for education and general awareness only. It’s not financial advice, nor a recommendation to buy, sell, or hold any asset. Do your own research, manage your risk, and make sure you understand what you’re getting into.
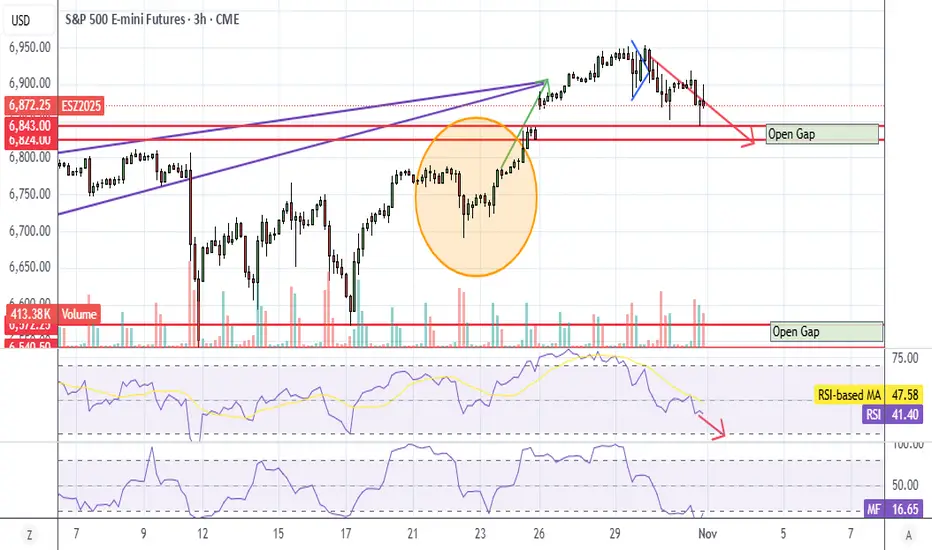
S&P500: Rising?S&P 500 futures edged slightly lower in yesterday’s session but are expected to remain within the upward trajectory of magenta wave (5), which, under our primary scenario, is likely to continue moving higher. This advance would also complete the larger blue wave (III). Afterward, we anticipate a corrective phase in magenta wave (A), which should put renewed pressure on the index. At the same time, we are monitoring our alternative scenario, which suggests that magenta wave alt.(3) has not yet concluded. If prices drop below the support level at 6,371 points, this scenario will come into play. In that case, wave alt.(4) would likely extend further downward, reaching its low within the magenta alternative Target Zone between 6,055 and 5,822 points (probability: 30%).

Neutral zone tradeFriday structure in the daily chart of the S&P 500 implies an inside day on Monday with a bullish bias.

ES UpdateI noticed this morning the MFI went down after open instead of going up. Europe dumped because their market is heading down.
I think we're going to see RSI hit oversold either Monday or Tuesday. Then we get a bounce.
Also, AAPL threw and exhaustion gap. That's usually teh end of a rally.
Day 60 — Trading Only S&P Futures | 10-for-10 Green TradesStick around — at the end, I’ll break down the key levels I’m watching for tomorrow. Let’s go.
Recap & Trades
Day 60 — another clean session.
We started the day with a bearish structure, so my plan was simple: wait for price to reach the 1-minute MOB and short it.
Every trade lined up with VX Algo confirmations — short, lock profit, repeat.
I was already up after the first few setups, and once I realized I was 10-for-10 on trades, I stopped.
Lesson & Mindset
This was a great reminder that it’s not about trading more — it’s about trading better.
Consistency doesn’t come from being in the market all day; it comes from having discipline to stop when the job’s done.
News & Levels
The quiet story today — liquidity is draining from the system.
US bank reserves just fell to $2.8 trillion, the lowest since 2020. That’s worth watching closely in the weeks ahead.
Tomorrow’s levels: Above 6915 bullish, below 6895 bearish.

ES Premarket UpdateMFI went oversold on ES and NQ so we melt back up. I should've warned everyone not to hold puts for Apple earnings. They pump every time.
Gap still open, not sure what's gonna cause it to fill. Expecting a pump today and Monday.

ES - October 31st - Daily Trade PlanHappy Halloween!
October 31st - 7:50am
*Before reading this trade plan, IF, you did not read yesterdays, or the Weekly Trade Plan take the time to read it first! (You can see both posts in the related publication section) *
If my posts provide quality information that has helped you with your trading journey. Feel free to boost it for others to find and learn, also!
My daily trade plan and real-time notes that I post are intended for myself to easily be able to go back and review my plan and how I did from an execution perspective.
--------------------------------------------------------------------------------------------------------
Yesterday we found the daily low at 6850. This happened right before the end of the day and rallied into 6893 area and overnight we have our low at 6888 with our high at 6906. We have tested 6906 2x overnight and as I write this, we are giving it another attempt. I have stated all week that 6708 is our bull/bear line. You can see that Institutions have been buying overnight at the 6893 level. IF price loses this level, we will have a chance to ride higher, IF price can reclaim this level. Ideally, we can flush 6888 maybe down to 6882 and then reclaim 6888 to move higher. IF price clears 6908, we need to hold it or flush it down to 6901 and reclaim quickly.
It is the last day of the month, and I think we continue higher today with 6914, 6923, 6930 being the first targets. IF price holds 6930 end of day, we could rip higher next week to kick off November.
Key Levels Today -
1. Loss of 6901 and reclaim (Micro Level Reclaim but might be all we get)
2. Loss of 6893 and reclaim
3. Loss of 6888 and reclaim
4. Loss of 6877 and reclaim
Below these levels and we will probably be selling off pretty hard, and I would probably let price find a support level below and build a base to move higher.
Key Support Levels - 6901, 6893, 6888, 6877, 6865, 6850
Key Resistance Levels - 6908, 6914, 6923, 6930, 6944, 6953
IF price loses a level and you are not able to enter, wait for price to find another key level above, build a base and allow that level to become support. Then find a spot to enter for a level-to-level move.
I will post an update around 10am EST.
----------------------------------------------------------------------------------------------------------------
Couple of things about how I color code my levels.
1. Purple shows the weekly Low
2. Red shows the current overnight session High/Low (time of post)
3. Blue shows the previous day's session Low (also other previous day's lows)
4. Yellow Levels are levels that show support and resistance levels of interest.
5. White shows the trendline from the August lows

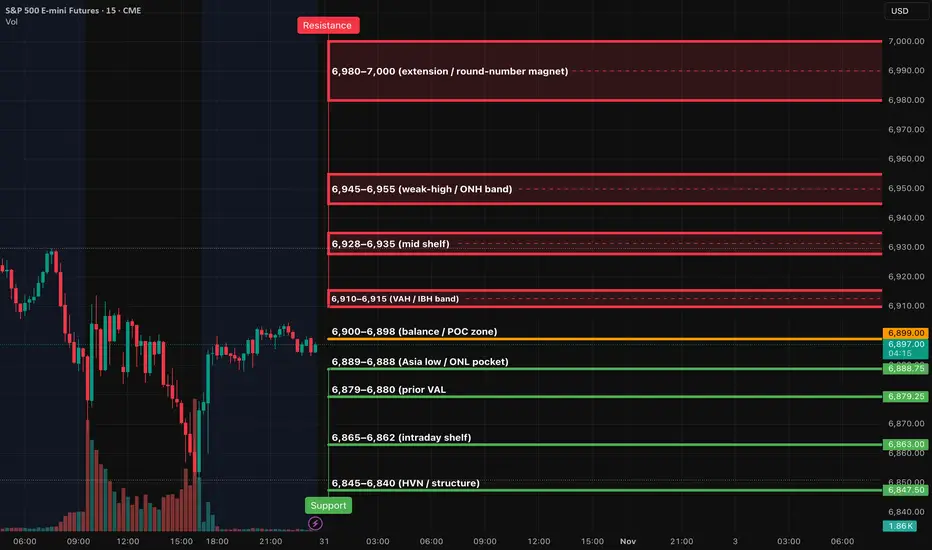
ES (SPX, SPY) Analysis, Key Zones, Setups for Fri (Oct 31st)Kill-zones (ET): NY AM 09:30–11:00; manage 12:00–13:00; NY PM 13:30–16:00.
Event (Fri): 9:45 ET Chicago PMI (unaffected by shutdown).
Upside continuation (LONG):
6,910 flips to support with a 15m close above → 5m pullback holds → 1m HL entry.
SL: 15m trigger-wick ±0.25–0.50.
TP1 6,928; TP2 6,945–6,955; TP3 6,980–7,000.
Quick-reclaim bounce at 6,889–6,888: sweep and instant reclaim → ride to 6,898 → 6,904–6,910.
Pop-and-fail shorts (SHORT):
Reject 6,904–6,910 then 15m closes back under 6,904 → 5m LH entry.
SL: 15m wick.
TP1 6,898; TP2 6,889; TP3 6,879.
Clean breakdown of 6,889 with a 15m close ≤6,887 → 5m LH entry.
TP1 6,879; TP2 6,865; TP3 6,845.
Management & risk
Viability gate: only take a trade if TP1 ≥ 2.0R using the 15m-wick stop.
At TP1: close 70%, set the 30% runner to BE; runner aims TP2→TP3.
Max two attempts per level per session.
Continued selling is not expectedContinued selling in the S&P 500 daily chart for Friday is not expected. Rather an inside day with a positive close is expected.

Day 59 — Trading Only S&P Futures | +$142 & Netflix Split Recap & Trades
Day 59 — started off strong shorting 6930 resistance right out the gate.
Those early plays hit perfectly, and I built up about +$300 in profit.
Later, I got a little greedy — took a risky end-of-day setup, got stopped out right before a recovery, and ended up finishing at +$142.
Could’ve been a bigger day, but I’ll take a green close any time I stick to the plan.
Lesson & Mindset
Sometimes the best win is walking away with discipline intact.
Once you’re up early, your focus should shift from “how much can I make” to “how well can I protect it.”
That mindset compounds long-term consistency.
News & Levels
Big market story today — Netflix just announced a 10-for-1 stock split.
Tomorrow’s levels: Above 6920 bullish, below 6875 bearish.

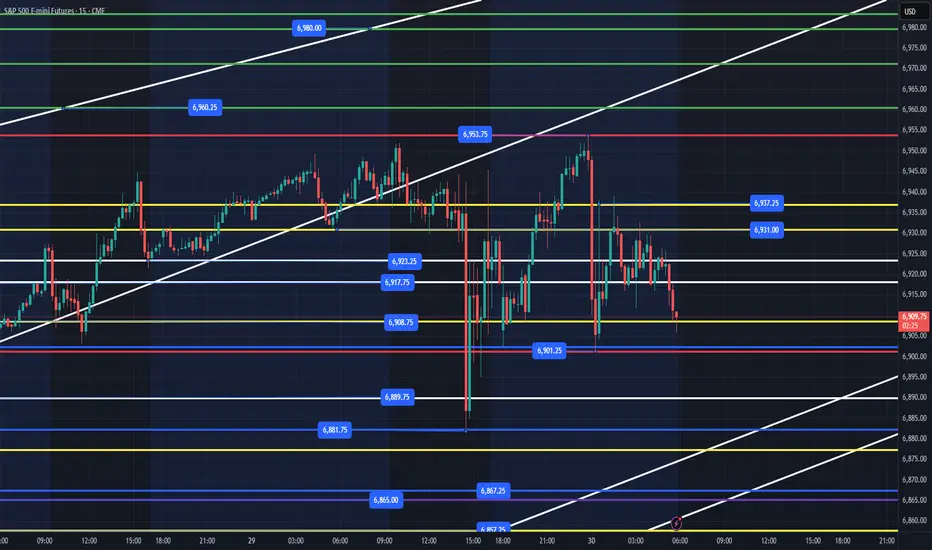
ES - October 30th - Daily Trade PlanOctober 30th - 6am
*Before reading this trade plan, IF, you did not read yesterdays, or the Weekly Trade Plan take the time to read it first! (You can see both posts in the related publication section) *
If my posts provide quality information that has helped you with your trading journey. Feel free to boost it for others to find and learn, also!
My daily trade plan and real-time notes that I post are intended for myself to easily be able to go back and review my plan and how I did from an execution perspective.
---------------------------------------------------------------------------------------------------------
Yesterday we had some afternoon volatility. Prior to 2pm EST we had a big battle at the 6930 level. This level was finally lost after FOMC and we sold off very quickly into the 6901, 6889 levels. This happened very fast and as I stated on my Daily Trade Plan that we were looking for the flush and reclaim of 6889, 6901 (6908 being the safer option). I did not take a trade in the afternoon but watching price action it would have been difficult without having a large stop loss in place.
At 5:30pm I wrote the following note:
"Price back tested the 6937 level we sold off from, and we need to hold 6908, 6894 in the overnight session. There is a bull/bear line at 6908 that was battled today. My general lean is that we need to continue lower to the 6864-67 level or close the gap at 6827 and then move higher. We are still in a bullish trend and nothing bearish changes the trend until we lose 6690. I think we can continue higher, IF price can flush lower, close the gap and then move higher and clear 6950."
What has transpired overnight? We made our overnight high of 6953 and have held the 6901 level. As of typing this post, we are currently at 6906 and about to test the 6901 level for the 3x overnight. We may get one more bounce here or we may lose the 6901 level and have to test the 6881 (yesterday's low). We still have a large gap below that needs to be filled.
My general lean for today is that we can lose 6881 and reclaim to move higher and back test 6901. This could continue us higher. Ideally, we would get a nice flush of 6865-67 levels and reclaim to move us higher. We could have both happen today.
Key Levels Today -
1. Loss of 6908 and reclaim (This is the bull/bear line in this range between 6881-6953)
2. Loss of 6901 and reclaim (Weaker level now)
3. Loss of 6881 and reclaim
4. Loss of 6867-65 and reclaim
Below these levels and we will probably be selling off pretty hard, and I would probably let price find a support level below and build a base to move higher.
Key Support Levels - 6908, 6901, 6889,6878, 6867, 6857, 6841, 6827, 6812
Key Resistance Levels - 6908. 6917, 6931, 6937, 6953, 6960, 6980
IF price loses a level and you are not able to enter, wait for price to find another key level above, build a base and allow that level to become support. Then find a spot to enter for a level-to-level move.
I will post an update around 10am EST.
----------------------------------------------------------------------------------------------------------------
Couple of things about how I color code my levels.
1. Purple shows the weekly Low
2. Red shows the current overnight session High/Low (time of post)
3. Blue shows the previous day's session Low (also other previous day's lows)
4. Yellow Levels are levels that show support and resistance levels of interest.
5. White shows the trendline from the August lows
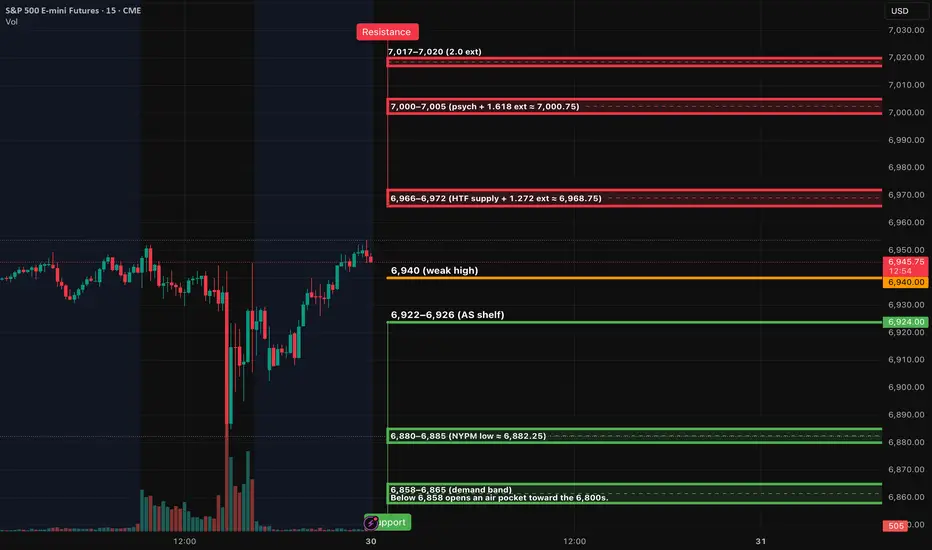
ES (SPX, SPY) Analysis, Key Zones, Setups for Thur (Oct 30th)Bias: Neutral → mild-bullish while 6,922 holds; momentum unlocks only on acceptance above the 6,966–6,972 pocket.
Setups — Rejection Fade (short): Tag 6,966–6,972 and print a 15m rejection close back inside, then a 5m re-close lower with a lower high, then take the 1m first-pullback fail. Stop = 15m wick high +0.25–0.50. TP1 = 6,940. TP2 = 6,922. Runner aims 6,885.
Setups — Acceptance Continuation (long): 15m full-body close above 6,972, 5m pullback holds and re-closes, then 1m higher-low entry. Stop = 6,966 wick. TP1 = 7,000. TP2 = 7,017. Stretch into low 7,040s if momentum persists.
Setups— Quick-Reclaim Bounce (long): Flush into 6,922–6,926 that instantly reclaims on 15m, 5m re-close confirms, then 1m higher-low entry. Stop = 6,916. TP1 = 6,940. TP2 = 6,966–6,972.
Setups — Breakdown Continuation (short): 15m body through 6,922 that holds below on a 5m retest. Stop = 6,929–6,932. TP1 = 6,900. TP2 = 6,885. Stretch 6,858 if pressure accelerates.
Management: only take a setup if TP1 is at least 2.0R using the 15m-wick stop. At TP1, close 70% and set the 30% runner to break-even; runner targets the next opposing major level. No trailing before TP2. Maximum two attempts per level per session.
Invalidation: Bull idea is invalid below 6,916 (loss of the AS shelf). Bear idea is invalid once there is 15m acceptance and hold above 6,972 with 5m higher-low structure.
Notes: Expect headline sensitivity. If we rip into 6,966–6,972 without a 15m close above, favor the fade. If we grind above and hold, ride acceptance toward 7,000 then 7,017.
ES UpdateNo rate cut in December? WHo cares? META missed earnings? Who cares? MSFT down after earnings? WHo cares?
The melt up must continue until the daily gets overbought, lol. Gotta set up for the China trade deal news.
You can see that the algos did sell some today, but futures are flat right now despite META miss.
Note: 30 year bond yields went back up to Sept levels because the December cut was priced in. Mortgage rates will actually go up, not down from this cut.

Thursday’s meeting between the US and ChinaThe focus for Thursday for the daily chart in the S&P 500 will be the meeting between US and China. If a resolution can be reached on some of the major topics, positive movement to the upside and the S&P 500 would be expected.

Day 58 — Trading Only S&P Futures | +$304 & Easy FOMC GainsRecap & Trades
Day 58 — clean and easy.
We had some conflicting signals early, but once the structure aligned, it became a straightforward session.
The key takeaway today was how FOMC movement tends to cap between 30–60 points, which makes it easy to plan trades if you size stops properly.
Overall, simple setups, small size, steady gain — +$304 for the day.
Lesson & Mindset
You don’t have to trade aggressively to make progress.
Low-effort, high-consistency days are often where real edge compounds.
I’m learning that keeping your head calm on choppy news-driven days is what separates pros from gamblers.
News & Levels
Powell’s comments cooled expectations for further rate cuts, causing the Dow to fade late in the session.
Tomorrow’s levels: Above 6885 bullish, below 6840 bearish.