Follow-Up: Non-Farm Moves from FridayHi All,
Following up on the range (size of the move) after non-farm on Friday to see how close our range expectation estimates were (see the earlier video post linked here for that).
The actual number came in pretty poor and worse than expected at 22k (vs 75k expected).
The move on the Non-farm release itself was actually quite muted with roughly a 20pt move on both sides of our VWAP starting point. But the real move came around 30 minutes into the US open where we saw a quick decline down to our lower boundary (50pts lower at 6470) and then briefly over-ran to 6450. But we settled and that 6470 became support for most of the session before reverting back to that declining VWAP to finish the day around 6490.
So, what's the lesson here: a bit of time pre-framing the possibilities for moves in either direction using a combination of stats (ATR, standard deviation of range), other technical analysis tools (support/resistance, VWAP, vol profile) along with experience can help frame the day and the important levels. Use this to start to decide what tools to pull out of the toolbox (trading strategies) and where to initiate trades.
If you find this helpful and would like to see more please let me know.
Happy Trading!
WSPM2019 trade ideas

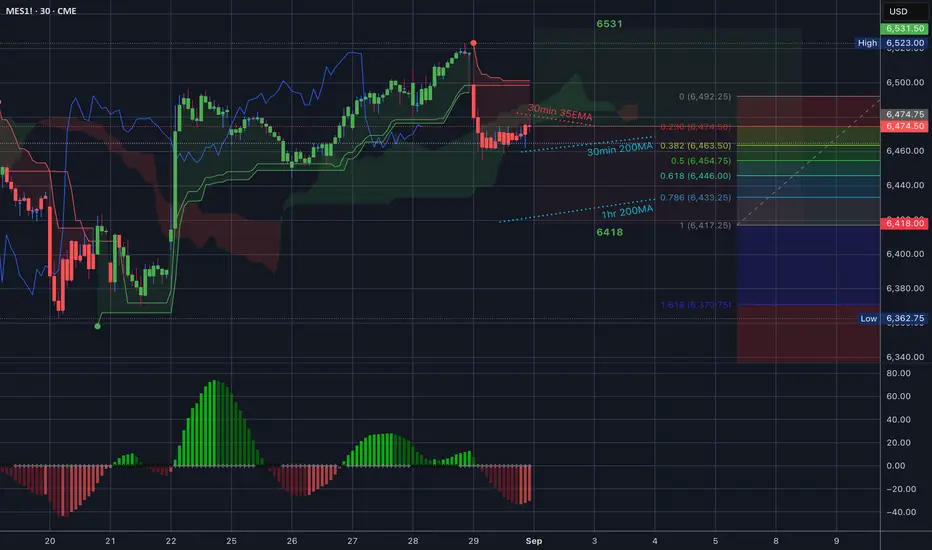
$MES_F $ES_F Trading Range for 9.2.25
Ok, so we are heading into tomorrow after the three day weekend a little bearish. Friday every candle printed red and the 35EMA is above us facing down so definitely look to that as resistance.
30min 200MA underneath us still facing up so we could see a technical bounce there, you can see that extended hours are sitting right on top of that level.
And way at the bottom of the trading range we have the 1hr 200MA - good to know that’s there.
Let’s go, y’all. I have officially been converted into a futures trader so new regular ticker right here.
Stock Index: The AI Bubble That Will Burst!ES
S&P 500 futures finishes up 0.23% as economic slowdown worries cloud rate-cut optimism. From a technical perspective, this week marks the third consecutive where ES has been trading inside of 11 Aug 25 bullish spinning top candle indicating weakness of bulls after reaching uncharted territory of $6,541.75 all-time highs.
Such signs point to a short-term retracement down into discount arrays but I am not here trying to guess the top. If it does occur, $6,355.00 is an area of interest but on an overall basis, I want to be neutral until Sunday’s opening price / opening gap.
NQ
Nasdaq follows with a 0.93% gain but with the same issue of price trading within a range, in this case, since the 4th Aug 25 weekly bullish marabozu was printed, I would not want to put my money on a continued run as of yet. Preeing short-term retracements with a discount array @ $22,781.75 is being watched closely and for the time being, I want to be neutral
YM
Dow Jones closes -0.37% lower this week with the intermediate highs of $45,887 still in tact. Will the monthly buyside liquidity pool be used to suck in unexpected bull traders before repricing to HTF discount arrays?
If I am to see a decline in the 3 stock index pairs, YM will be the pair to lookout for as the front-running market.

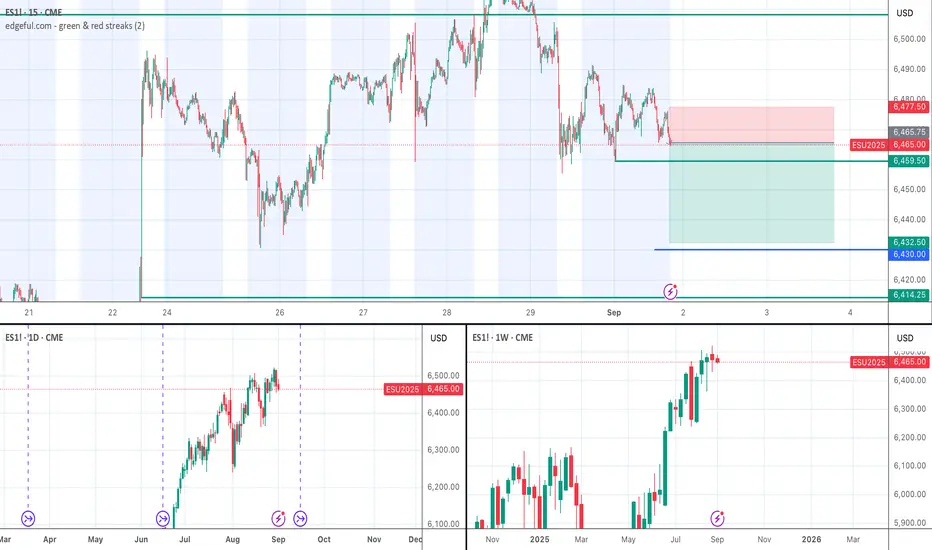
Short ES to Last Week's LowES is looking heavy with a steady decreasing Cumulative Volume Delta this evening. There is a 500 order block sitting at last week's lows just below 6430, so I'm thinking we head down to that level and test the support there.
ES Analyses (Sep 1–5), Fundamental, Key Zones, SetupsShort holiday week. U.S. cash equities are closed Mon Sep 1 for Labor Day. ES trades a holiday schedule and then normal hours from Tue.  
Key releases (ET):
• Tue Sep 2, 10:00 — ISM Manufacturing (first business day).  
• Thu Sep 4, 8:15 — ADP Employment Report.  
• Thu Sep 4, 8:30 — Weekly jobless claims. 
• Thu Sep 4, 10:00 — ISM Services (third business day). 
• Fri Sep 5, 8:30 — Nonfarm Payrolls (Employment Situation). 
Plan to sit out the first 10 minutes around each print.
Big picture
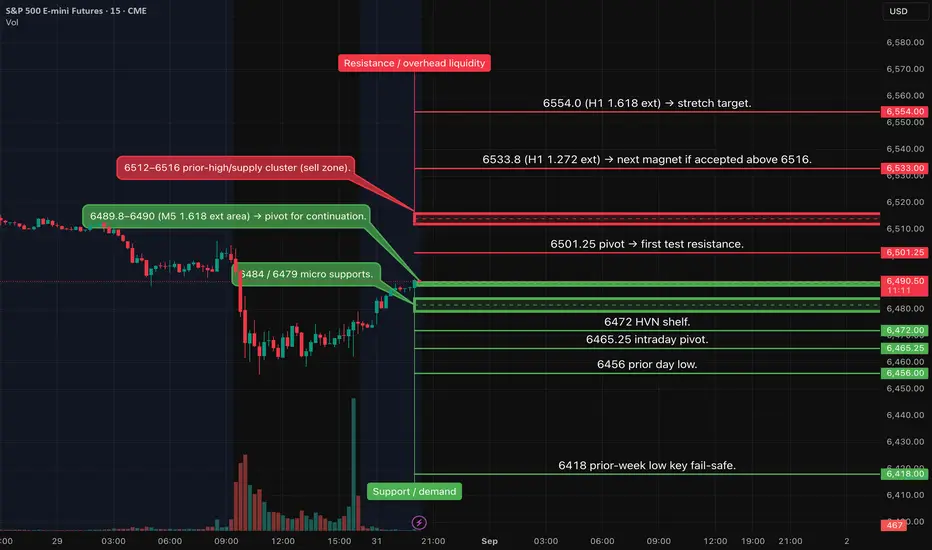
I’m treating 6512–6516 as the week’s decision zone. Acceptance above it opens 6533–6535 → 6554. Lose 6454 on a confirmed close and the door opens to 6418. While above 6418, I keep a neutral-to-bullish bias. (Levels are from my charts.)
Key levels I’m trading around
Overhead liquidity
• 6501.25 pivot
• 6512–6516 prior supply and decision zone
• 6533–6535 H1 1.272 extension
• 6554 H1 1.618 extension
Support
• 6490 continuation pivot
• 6484 / 6479 micro supports
• 6472 HVN shelf · 6465.25 pivot
• 6456 prior low · 6454 fail-safe
• Guardrail: 6418
Playbook (casual, but A++ rules still apply)
30m trend aligned, 15m momentum-on-structure, 5m close to confirm. Risk 6–8 pts. TP1 ≥15 pts. No trades during data prints.
1) Continuation LONG above 6490
Look for a 15m close above 6490, quick check that bids are holding >6484, then a 5m confirmation to enter 6489–6492.
• SL: ~6485
• TP1: 6506 (+15) → scale
• TP2: 6512–6516, TP3: 6533–6535
• Invalidation: 15m bearish close back under 6484
2) Rejection SHORT at 6512–6516
If we poke the zone and print a 15m bearish close <6508, I want a 5m confirm to work 6508–6514 short.
• SL: 6517–6519
• TP1: 6493–6496 (+15)
• TP2: 6484 → 6472, TP3: 6465 → 6456
• Invalidation: 30m acceptance >6516
3) Breakdown SHORT below 6454
If a 15m bar settles <6454 and retest fails, I’ll use 6454–6457 for entry.
• SL: 6460–6462
• TP1: 6439 (+15)
• TP2: 6418, TP3: 6405–6395
• Invalidation: Swift reclaim >6462
Management notes
Trade windows 9:45–11:30 ET and 13:30–15:30 ET. Scale half at TP1. Move stop to breakeven only after structure breaks or a 15m/30m close through TP1. I don’t add fresh longs straight into 6512–6516 unless we’ve got 30m acceptance.
Monday is expected to be an inside dayThe daily structure in the S&P 500 chart implies an inside day for Monday which means Monday would trade within the range of Friday.

Bearish autumn NQ and ESThis autumn will give us a retracement on the indicies in my opinion. We have seasional tendencies for bearishness and divergence on the weekly and daily charts on the tops.

S&P500 about to BREAK downLook at the chart, its very EVIDENT. with this overbought and bullish sentiment, i expect the markets to CORRECT further. its still extreme greedy. You can see the support lines. S&P can correct somewhere between 5-9%. Be prepared.
SP:SPX TVC:SPX CBOE:SPX SPREADEX:SPX CBOE:XSP

Positive attitudeThe daily price action on Thursday in the S&P 500 indicates a positive attitude of the market going into Friday's labor numbers. It will be interesting to see if buyers follow through with a positive close going into the weekend.

OTEUM EXPERT CALL: SP500 – Jackson Hole Fade OTEUM EXPERT CALL: SP500 – Jackson Hole Fade 🏔️🐻
We’re looking for a SHORT(s) in spot and options for a macro swing down into Jackson Hole and the immediate aftermath 📉. Plan is to sell rallies into value (red box), ride the drift lower, and bank along staged targets. After that, we’ll be hunting the first-cut squeeze back up 🏦✂️🚀.
Risk: a surprise dovish leak / policy jawbone that front-runs the cut and squeezes shorts. Size smart, trail tight, don’t overstay.
#SP500 #ES #Macro #JacksonHole #ShortSetup #OTEUM

ES-Weekly Trading Plan - September 1st-5thSaturday August 30th - 10:41am EST
We have a short week with futures open for half day on Monday due to USA Labor Day Holiday. I expect light volume on Monday with price not telling us much until we see institutions at their desks on Tuesday.
I said last week the following - (You can also see this on the related publication section)
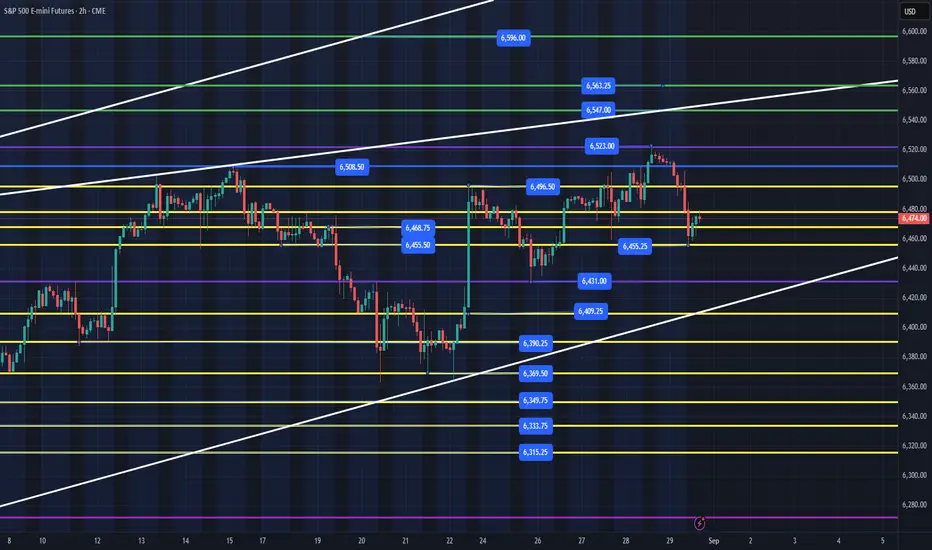
"When you look at the 2hr, 4hr, 8hr chart and zoom out, you can see that the trend is up and that we will probably need to digest Friday's rally and most likely chop around ideally above 6468, 6452 levels with 6429 being the lowest level we would want to test. Then we can retest the 6508 level and continue higher this week with 6522, 6547 my main targets with 6596 if bulls really want it.
IF, we lose 6369, my lean is that we will continue lower and a new market trend could be starting to unfold with 6245 the big area for us to hold to stay bullish in the bigger picture."
Recap of last week - 6430 was the low for the week (never get close to 6369) that got bought up on Sunday evening and we rallied up to the 6522 targets by Thursday. My daily trade plan kept us moving higher all week. I did not post Thursday night/Friday as I was off my desk. We are still in a bullish uptrend and until 6369 is lost, we must focus on trend.
-----------------------------------------------------------------------------------------------------
What is the plan for this week? Since Monday is a short session and will be low volume, I will not be trading and will enjoy time with my family. Ideally, I am looking for a pullback down to the 6431 or tag the white trend line and recover the next level above. Due to low volume on Monday, I do not expect us to get much higher than 6496 in the Monday session, with some headline taking us down Tuesday to 6431 or the white trend line (I will have better idea after the close on Monday) and will have more details in my daily trade plan for Tuesday.)
I do believe we can still rally up to 6547, 6563+ this week, but IF, we lose the 6369 level, that would be a big blow to bulls, and it would need to be sharp reclaim back inside the white trendline to keep momentum.
Overall, we should continue up the levels and get to new highs by end of the week. IF, we lose 6369, I will wait for failed breakdowns below at the levels in Yellow. Remember that when ES wants to sell off, it's better to get out the way and let it build a new base. We had buyers step in on Friday at 6455, so any flush and reclaim of that level Monday would be a good setup.
Tuesday Daily Trade Plan will come out after the close on Monday or before the 6pm EST evening session open.
S&P 500 (ES1!): Short Term Sells For Longer Term Buys TargetsWelcome back to the Weekly Forex Forecast for the week of Sept 1 - 5th.
In this video, we will analyze the following FX market: S&P 500 (ES1!)
The S&P500 has been strong, but gave a bearish close on Friday. Looking at the Daily, it is easy to see price is retracing lower, perhaps to the +FVG, which is a great place to look for longs once contacted.
Short term sells are permissible, but be mindful the HTFs are bullish.
Enjoy!
May profits be upon you.
Leave any questions or comments in the comment section.
I appreciate any feedback from my viewers!
Like and/or subscribe if you want more accurate analysis.
Thank you so much!
Disclaimer:
I do not provide personal investment advice and I am not a qualified licensed investment advisor.
All information found here, including any ideas, opinions, views, predictions, forecasts, commentaries, suggestions, expressed or implied herein, are for informational, entertainment or educational purposes only and should not be construed as personal investment advice. While the information provided is believed to be accurate, it may include errors or inaccuracies.
I will not and cannot be held liable for any actions you take as a result of anything you read here.
Conduct your own due diligence, or consult a licensed financial advisor or broker before making any and all investment decisions. Any investments, trades, speculations, or decisions made on the basis of any information found on this channel, expressed or implied herein, are committed at your own risk, financial or otherwise.

MES1! WEEK 36 AUG 24TH Looking for MON, TUE, WED to create high of the week at the AUG 29th 6A.M Bearish OB. The Head towards the 3H Equal Lows.
IF price break above the OB then you will need to sit back and reassess. Possibly look for higher prices.
CALANDER EVENT
TUES
-10AM - PMI (HIGH)
WED
-7AM - 30-YEAR MORTGAGE RATE (MED)
-9AM - FED SPEACH (MED)
-10AM - JOLT's JOB OPENING (HIGH)
THUR
-10AM - PMI (HIGH)
-12PM - OIL/GAS (MED)
FRIDAY
-8:30AM - NFP / UNEMPLOYMENT RATE
STOCK
Look to place a Put at the time price trades to the 3H OB.

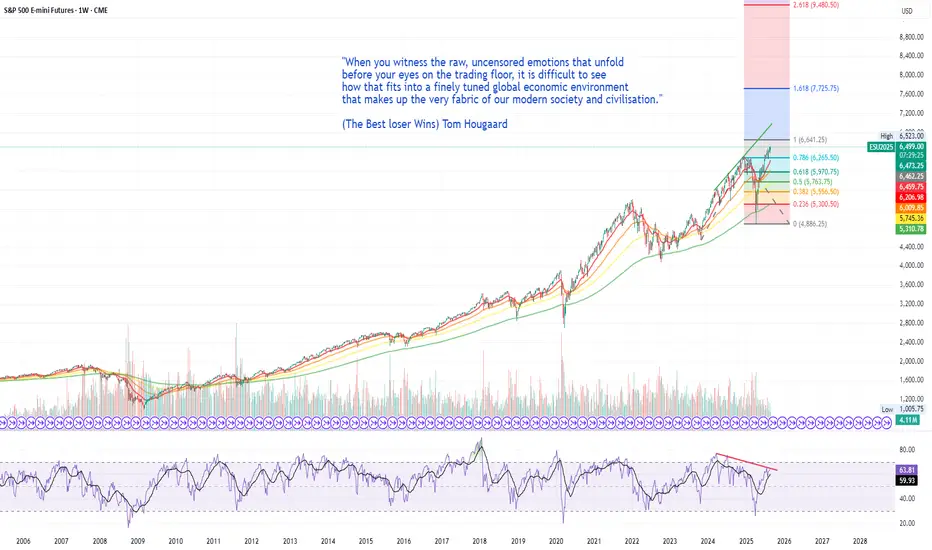
The end - 2026 Financial panicSince 2300, I’ve marked a zone and made a personal commitment: no matter what happens in the market, when this zone is approached, I will begin reducing my exposure and carefully exit all financial markets—with extreme caution and tight stop losses.
Yesterday, I received an alert I never expected to see. It signaled the approach of the zone I identified back in 2021 as the escape point—where major crashes are likely imminent and the urge to invest must be resisted.
This zone aligns with the 0.786 trend-based Fibonacci level from the 2009 bottom to the 2020 peak, as well as the April 2020 bottom. It also coincides with the 2.618 and 3.618 Fibonacci extensions from the 2007–2010 cycle, and the 3.618 trend Fibonacci from the 2002–2009 cycle. But that’s not all.
According to Gann’s Square of 9, if you examine closely, you’ll notice that whenever the trend reaches one of its primary or secondary angles since the 2009 bottom, it consistently triggers a significant drop. The end cycle at the 360° angle corresponds to 7926—perfectly aligning with all the previously mentioned Fibonacci zones.
And for those skeptical of technical analysis, consider this: the upcoming year, 2026, is a pivotal year in the Samuel Benner chart developed in 1875 to identify periods of financial disorder. Benner’s chart indicated when to buy, when to sell, and when to expect chaos. Remarkably, it has accurately forecasted major financial crashes over the past 150 years—including the Great Depression, the Dot-Com bust, and the 2020 COVID crash. According to this chart, selling during the crash year and re-entering post-crash has historically led to profitable outcomes with a +-2 Years at a 87.5% accuracy.
When you combine all these signals, it feels reckless not to take them seriously—especially since this marks the end of a cycle measured from 2009. That’s how significant it is.
To those who dismiss technical analysis, this may sound like smoke and mirrors. But for those who’ve seen its power firsthand, the sheer number of confluences here is too substantial to ignore. If I know such big crash may happen - I would be happy to wait 1-2 years on cash and take opportunity of big red markets to buy.
Curious to hear your thoughts on this.

Day 17 — Trading Only S&P Futures | A+ Setup, Done by 10AMWelcome to Day 17 of Trading Only S&P Futures!
Today was all about conviction. I spotted a rare A+ setup: X7 ES buy signals, bullish market structure, and a buy right at MOB support. That kind of alignment doesn’t happen often — so I sized up 3x my usual and went long.
The trade worked perfectly, and I wrapped up the day by 10AM with +295.37, making this the fastest finish to a session I’ve ever had in this challenge.
📰 News Highlights
STOCKS CLOSE HIGHER, VIX DIPS AS NVIDIA NASDAQ:NVDA EARNINGS LOOM
🔑 Key Levels for Tomorrow
Above 6450 = Remain Bullish
Below 6435 = Flip Bearish

ES breakdown, bullish lookfollowing market structure after just making a new high, market corrects and find support to start creating new higher highs on 4h time frame signaling what it seems to be a continuation towards new all time high. bullish outlook for the week,
on the opposite scenario, break bellow 6,460 with a full body 4h candle closing bellow could signal the down trend

Nq & Es Premarket Comment 29-08-2025Good morning everyone,
I continue to believe that the market maintains a bullish trend, even though we have already reached our previous targets. However, since today is Friday, a day often characterized by unusual reactions, caution is required.
At the market open (09:30 NY time), I will be looking for long opportunities on Nasdaq (NQ), which is currently showing stronger bullish momentum compared to ES and YM. Price has already made a significant retracement and entered a discount zone, so my main focus will be to see whether the support level holds after the open before committing to any long positions.
Wishing everyone a productive and successful session.
⚠️ Disclaimer: This analysis reflects personal market observations and is for educational purposes only. It does not constitute financial advice.

AMP Futures - Experience every stage of Futures in Paper TradingIn this idea we will cover some of the new updates to Tradangview's paper trading connection.

Weekly Divergence Divergence on lower timeframes is something I look for. Does it tell us a story with the weekly and monthly as well?
ES Analyses, Key Zones, Setups, Bias (08/29)Fundamentals for Fri, Aug 29 (ET)
• 08:30 — Personal Income & Outlays (incl. PCE) for July. Official BEA schedule lists this release for Aug 29, 8:30am. 
• 08:30 — Advance Economic Indicators (Advance Goods Trade Balance, Retail & Wholesale Inventories) — scheduled Aug 29. 
• 09:45 — Chicago PMI (Aug). Usual release time 9:45am; calendars list Aug 29.  
• 10:00 — U. Michigan Consumer Sentiment (Final Aug). Institute notes next data Fri Aug 29 at 10am. 
• Context — Next FOMC: Sep 16–17. Recent Fed commentary leans toward a potential cut dependent on incoming data (e.g., Waller remarks today).  
Implication: 8:30 data can set the day’s bias; 9:45–10:00 can create a second impulse. Use our macro blackout (±10m) rule around these times.
Structure & Bias (multi-TF snapshot)
• HTF (D/4H/1H): constructive uptrend with HH/HL; price is consolidating just under overhead supply.
• LTF (30m/15m/5m): Asia range formed near the highs; New-York PM printed a marginal higher high and stalled.
• Working bias: Neutral-to-bullish above the pivot cluster; flips bearish only on a 15m close back through the pivot (see Zones).
Key Zones (why they matter)
Numbers are rounded to the nearest quarter-point when appropriate.
Overhead supply / breakout gate
1. 6516.75–6523 = AS.H → NYPM.H band (resting liquidity / prior sweep zone). Acceptance above unlocks extensions.
Acceptance / flip cluster (the hinge)
2) 6512.5–6516.75 = Asia range.
3) 6506.75–6508.5 (with PDH ~6507.50) = prior session highs & intraday BOS retest (hard pivot).
→ Hold above = constructive; lose it on a 15m bearish close = momentum shift down.
Supports below (ladder)
4) ~6497 = intraday LL / demand edge.
5) ~6492 = micro shelf / HVN pivot.
6) 6480–6484 = prior NY AM low / prior swing shelf (first deeper magnet).
7) 6468–6472 = prior day range floor cluster (PDL/PMH vicinity) — next hard liquidity.
Upside magnets
• ~6534–6536 = 1h measured move/extension cluster.
• ~6553–6556 = 30m 1.272 ext / HVN edge.
• ~6579–6582 = 1.618 ext / exhaustion pocket.
(All targets respect our “Hard Liquidity first” rule; then extensions.)
A++ Setups (score ≥9 only)
A) Breakout-Acceptance Long (primary)
• Trigger: 30m close above 6516.75, then 15m MOS holds above the box; wait for a 5m confirmation (micro BOS or clean retest that doesn’t reclaim the box).
• Entry zone: 6518–6520 on the retest/impulse continuation.
• Initial SL: 6–8 pts (tightest of: under the 15m trigger bar or below 6512).
• TPs:
• TP1: +15 pts → ~6534–6536 (first hard magnet/extension).
• TP2: ~6553–6556 (next HTF zone).
• TP3 (runner): trail via 15m/30m closes toward ~6579–6582.
• Management: Scale ½ at TP1; move SL→BE only after structure break or 15m/30m close through TP1, then trail by 15m/30m swings.
• Disqualifiers: 15m closes back inside ≤6516 after trigger; macro-print within blackout; clear Liquidity-Wall ≤5 pts above entry that blocks TP1 ≥15 pts.
B) Rejection → Breakdown Short (secondary)
• Trigger path 1 (fade failure): Wick into 6516.75–6523 and a 15m bearish close back inside the box plus 5m confirmation (CHoCH / OB tap).
• Trigger path 2 (momentum break): 15m close below 6506–6508 (PDH/NYAM.H cluster) → 5m retest failure of 6508–6510.
• Entry zone: 6514–6518 (fade) or 6508–6511 (retest short).
• Initial SL: 6–8 pts (above 6521 on fades; above 6516 on retests).
• TPs:
• TP1: ~6492–6495 (≥15 pts and a hard pivot).
• TP2: ~6480–6484 (NY AM shelf).
• TP3: ~6468–6472 (prior range floor); trail by 15m/30m.
• Mandatory (bearish) rule: needs both 15m bearish confirmation and 5m alignment before entry (per protocol).
• Disqualifiers: 30m re-acceptance above 6512.5–6516.75 after entry; macro blackout.
Execution Rules (strict)
• Time windows: 9:45–11:30 ET and 13:30–15:30 ET only.
• Confirmations: 30m trigger → 15m MOS → 5m close; bearish trades require 15m bearish close.
• Risk: SL = min(under 15m trigger bar, 6–8 pts). Daily hard stop −2R; lock day at +3R.
• Targets: TP1 ≥ +15 pts at a Hard Liquidity level; front-run 1–2 pts.
• No trades inside macro blackout windows or if Liquidity-Wall blocks TP1.

ES - August 28th - Daily Trade PlanAugust 28th - 5:50am EST
Let's review yesterday's trade plan. I try to keep things as simple as possible. If you have been following me, you know that I like to frame my plan by IF statements.
I posted the following yesterday:
"IF, price can reclaim and clear 6489, we should be able to test 6496, above there we should target6508 then 6522, 6547 as my main targets and bulls can still reach 6562, 6581, 6595 if they really want it!
IF, price loses 6478, a quick flush and reclaim will take us longer. Ideally, price does not go any lower than 6464 to keep the bull case moving higher."
What happened? We lost 6478, flushed to 6472, reclaimed and grinded higher into end of day. After the bell we got a massive flush and recovery of guess what? 6472 which was the daily low.
I always like to highlight the current session levels in red with other key levels in Yellow. You can pull up a 30 min chart and see that we have 3 key levels that need to hold today.
Those levels are - 6472, 6485, 6496. Any flush and reclaim of these levels, should take us higher and continue up our target levels for the week of 6522, 6547. Below 6460 and we will need to test 6453, 6430 being the weekly low in purple.
Today is pretty simple, flush and recover one of the 3 levels I mentioned above, and we keep going higher. I will say that 6472 has been tested 3X and I am not sure it will hold next time. Be careful if we are selling hard into this area.
Ideally, we flush down to 6490-93, reclaim 6496 and head higher!
I am off my desk travelling this afternoon and will try to provide an update when I can.

ES (08/27): Analyses, Fundamental, SetupsPrice is consolidating under 6489 to 6495 with a firm shelf near 6483. Above 6489 on a 5-minute confirming close, bias favors continuation into 6504, 6518, then 6532. A 5-minute close back below 6483 opens rotation toward 6468, 6458, then 6453. Trade only during 09:45–11:30 ET and 13:30–15:30 ET. Stand down around the listed events.
Macro Docket (ET)
• 07:00 – MBA Mortgage Applications (weekly). Source notes Wednesday 7:00 AM ET. 
• 10:30 – EIA Weekly Petroleum Status Report (standard Wednesday release time). 
• 13:00 – U.S. Treasury 5-Year Note Auction (Aug 27, 2025; size listed on TreasuryDirect). 
• After the close – NVIDIA Q2 FY26 results; conference call 5:00 PM ET (2:00 PM PT).  
• Durable Goods (July) is out: headline −2.8% m/m; ex-transport +1.1% (market still digesting). 
• Fed calendar: no Board-listed speech flagged for Wed at time of writing; I cannot confirm regional Fed schedules. 
Key Levels
• Breakout band: 6489–6495
• Line in the sand (shelf): 6483
• Support below: 6468, 6458, 6453, 6444–6448
• Upside magnets: 6504/6506, 6518–6520, 6532–6535
A++ Setup 1: Acceptance Long above 6489
• Trigger: First 5-minute close >= 6489 with follow-through (no immediate fade).
• Entry: 6490–6491 (momentum on signal).
• Initial SL: 6484 (about 6 pts; below shelf).
• Targets: TP1 6505 (+15), TP2 6518 (+28), TP3 6532 (+42).
• R:R to TP1 approx 2.5.
• Management: Scale 1/2 at TP1; move to break-even only after new structure or a decisive close through TP1; then trail by last 5-minute swing or VWAP band.
• Invalidation: 5-minute close back below 6483 or persistent absorption under 6495.
A++ Setup 2: Shelf-Break Short below 6483
• Trigger: 5-minute close <= 6483 with clear rejection (no immediate reclaim).
• Entry: 6482 (momentum on signal).
• Initial SL: 6488 (about 6 pts; back inside range).
• Targets: TP1 6467 (−15), TP2 6458 (−24), TP3 6453 (−29).
• Short confirmation protocol: Start half size on the 5-minute break when the 15-minute trend was bullish; size to full only if a bearish 15-minute close prints within the next 3 x 5-minute bars. If within 2 x 5-minute bars there is no extension (new low) and price threatens a shelf reclaim, reduce or scratch to BE.
• Invalidation: 5-minute reclaim above 6489 or obvious absorption at 6468 forming higher lows.
Execution Rules (condensed)
• Windows: 09:45–11:30 ET and 13:30–15:30 ET.
• Risk: initial stop 6–8 pts; max 2 attempts per idea; day hard stop −2R; lock day at +3R; no scalps.
• News clock: no new risk within approx plus/minus 5 minutes of MBA (07:00), EIA (10:30), 5-yr auction (13:00).
• Close protocol: if trading late day, adjust sizing based on NYSE MOC imbalance (sub-$500M = tiebreaker only; >= $1B = can trade with confirmation; >= $2B = allow continuation holds into the cross).

ES (S&P 500 Futures) — Outlook for Thursday, Aug 28Macro Drivers
• Earnings Reports: Watch Best Buy, Dollar General, Ulta Beauty, Marvell, Affirm → consumer + tech sentiment drivers.
Economic Data:
• Q2 GDP (2nd estimate): Consensus ~3.1% YoY. Stronger print = bullish, weaker = bearish.
• Weekly Jobless Claims: Key labor health indicator → surprises can shift Fed rate expectations.
• Pending Home Sales (July): Forecast +0.5%. Housing often ties into rate expectations.
Sentiment Risks:
• NVDA earnings digested, but positioning still fragile.
• Treasury yields remain high → liquidity pressure.
• Political / Fed uncertainty adds headline risk.
⸻
Technical Key Levels (HTF Zone Mapping)
• ATH: 6508.75
• Major Liquidity Wall: 6500 (multi-timeframe rejection zone)
• Support Shelf: 6480–6483 (equilibrium & PMH)
• Deeper Support: 6459 → 6450–6452 (1H/4H shelves)
• Discovery Mode Fib Projections (above ATH):
• 1.272 = 6554
• 1.618 = 6580
• 2.0 = 6608
⸻
Setups for Tomorrow
1. Bullish Breakout — Discovery Mode Long
• Trigger: 30m close ≥6500 + 15m MOS extension.
• Entry Zone: 6500–6502.
• Stop: Below 6492–6493 (tighter of bar low or 6–8 pts).
• TP1: ATH 6508.75 (front-run 6507.75).
• TP2: Fib 1.272 ~6554.
• TP3: Fib 1.618 / 2.0 → 6580 / 6608 (runner, trail by 15m/30m structure).
⸻
2. Bearish Breakdown — Short Setup
• Trigger: 30m close ≤6483.
• MOS Confirmation: 15m close <6472.75.
• Entry Zone: 6479–6482.
• Stop: Above 6488–6490 (or 6–8 pts).
• TP1: 6459.
• TP2: 6450–6452.
• TP3: 6444 shelf (runner).
⸻
3. Chop / No-Trade Zone
• If ES trades inside 6483–6500 without breakout → no A++ setup. Stay sidelined.
