Buying momentum is buildingBuying momentum is building in the daily structure of the S&P 500 futures market. The expectation is for continuation to the upside with the next objective being 6770.
WSP1! trade ideas

Day 5 100 to 1,000,000 The Hour tf was outrunning the 9 ema, was waiting to see a pull back. Jumped into lower tf"s starting first on the 15m then 5m marking all respected gaps and liquidity. then finally the 1m for my entry and exit.

SPX Mid-TermSome thoughts on SPX. I don't want to outline the logic too clear but this chart summarizes it. I am aiming for a decent correction.
MESZ2025 WEEK 39 SEPT 21ST Looking for MON, TUE, WED to be the low of the week, trading towards then away from he daily VIB. Because of PMI on TUES look for early week run
Look for buying opportunities once price has broken below the 3H Bullish breaker #6715. Note that price can run lower into the BOB (Bullish OB) $6703 or $6700 before turning around.
IF- price closes below the 3H OB at $6797. Hold to see if price runs lower breaking and closing below 3H swing lows. You could be wrong in your analysis and price may be trying to run lower.
NOTE we are entering MC-NM. This is typically a retracement which should be to the up side given market structure.
NOTE: you are looking to hold for a 12 point run based on the fib. The best BUYs will be formed below $6715
CALENDAR EVENT
MON
- 12PM - FOMC SPEAKER
TUES
- 9:45AM - PMI (HIGH)
- 12:35AM - POWELL SPEAKS (HIGH)
WED
- 10AM - NEW HOMES SALES
THUR
- 8:30AM - FINAL GDP (HIGH)
- 10AM - EXISTING HOME SALES
FRIDAY
- 8:30AM - CORE PCE INDEX (HIGH)
Final Note
- remember to keep track of midnight/8:30 opening prices. Always refer back to the 1H and 3H
to confirm what side of the market you should be on.
- Alway look to buy in a discount range and sell in a premium range.
Risk- Only risk 150- 200 per trade on initial entry. you can add lots once you confirm trade is good. Refer back to higher TF before adding lots.
Max two trades per session.

day 4 100 to 1 millionlong time frames were to hot to be looking for a short of that significance. In that situation one is better off not trading at all.
I thank God for this lesson I learned, and am eager to learn and share.

Asia may set the tone for Monday's price actionThe expectation is continuation to the upside in the S&P 500 daily chart. A clue to that follow-through to the upside may be the Asia session which begins at 5 o'clock central time on Sunday evening.

ID: 2025 - 0095.5.2025
Trade #9 of 2025 executed.
Trade entry at 137 DTE (days to expiration).
Trade construct is a PDS (put debit spread) at Delta 15 combined with a PCS (put credit spread) at Delta 15. Overlapping short strikes give it the "unbalanced" butterfly nomenclature.
Sizing and strike selection is designed to keep the risk/reward "AT EXPIRATION" to a 1:1 risk profile. This lets charm work it's magic (second order greek), while exploiting the fact that this is a non-directional bias. The process is a disciplined and systematic approach letting time decay evaporate the extrinsic time value from the short options until target profit is achieved.
OF NOTE: This trade opened at EXCELLENT fills, and there is zero risk to the upside. The danger is of a catastrophic move to the downside, which will bring in phenomenal gains for ID 006 and 008. 😊
Happy Trading!
-kevin

long esthe lower rot gaps have been taken out this could explode today. I could see us push to yesterday's highs.

Bearish scalping S&P500S&P500 ideas:
Overnight bearish (0.3% drop after the daily open vs. 0.1% rise)
On Friday, upward gaps tend to close more than on other days.
Gaps of up to 0.2% tend to close at 87% within the same day.
0.2% will be there around 8:30.
Opening around there and rising, a good selling area is at 25% adr, which matches yesterday's negative delta.
A possible sell-off with context if it shows that sellers are still there.

ES - September 19th - Daily Trade PlanSeptember 19th - 6am
Before reading this trade plan, IF, you did not read yesterday's take the time to read it first!
(You can see my post in the related publication section)
I wrote yesterday ... "We need a pull back with some structure to one of the levels, ideally at either 6696-6700, 6692, 6682. We could also build a flag down to 6705-09 and then reclaim 6714, and head to 6733. IF, we go lower than 6682, I would get out the way and wait for a reclaim of 6684."
At 9:46am my note stated "We have continued to sell. Be patient. We could get a short squeeze soon. I would wait for reclaim of 6676 for a run to retest 6690-92"
At 9:50am - we sold into 6670, reclaimed 6676 and squeezed higher. This is a great example of why I DO NOT SHORT ES. Everyone thought it was going to continue lower and then the Institutions stepped in and took it higher and everyone short was covering.
There were 2 levels in my note yesterday that have continued to be very important since Wednesday. They have been 6682 & 6692. I will go deeper into this during my note for today.
-------------------------------------------------------------------------------------------------------------------
The overnight session low was 6679 and the high is 6705. We have been making lower lows, lower highs on the 15 min chart since yesterday's low of 6670. Until the trend changes, we cannot be bullish short term. The first sign of a change will be when we hold 6679 and then take out 6697. Ideally, we could flush down to 6670 or even as far down as the white trendline around 6658-62 zone and then rally higher. I will be waiting patiently for one of the following to happen:
1. Flush 6679, 66670 or below and reclaim higher for a level-to-level move.
2. Hold above 6679 and look for a back test of the breakout above 6697.
I do believe we will break out one way or another and IF, price drops below the white trendline and cannot reclaim it pretty quickly, I would expect price to flush lower and retest 6634 area or the FOMC lows around 6610. That would be a good spot to grab some points.
Key Support Levels - 6692, 6686, 6679, 6676, 6670, 6658-62 (White Trendline Zone)
Key Resistance Levels - 6697, 6705, 6710
Upside targets above are all levels in yellow with a breakout above 6719 to target 6733, 6750, 6776, 6796, 6809, 6814.
Based on where price is at time of this post 6:05am - We either hold this 6692 or 6686 and then reclaim above and that would potentially start the change in trend. Below 6686 and we need to flush 6679. Any breakout above 6697 should be bullish.
I will post an update around 10am EST.
---------------------------------------------------------------------------------------------------------------------
Couple of things about how I color code my levels.
1. Purple shows the weekly Low
2. Red shows the current overnight session High/Low (time of post)
3. Blue shows the previous day's session Low (also other previous day's lows)
4. Yellow Levels are levels that show support and resistance levels of interest.
5. White shows the trendline from the August lows.

ES (SPX) Analyses - Key Levels - Setups - Fri, Sep 19Bias:
After the recent FOMC meeting, where they cut rates by 25 basis points on September 18, the E-mini S&P 500 futures are looking a bit bullish. There’s decent support holding up, but expect some bumpy trading around those all-time highs. We might see the market bouncing between the usual value areas, with traders likely to fade the extremes unless there’s a strong breakout.
Momentum could slow down as we get close to overbought levels, which might lead to some profit-taking on any rallies. On the flip side, expect strong buying when prices dip. For now, the trading range looks to be between 6660 and 6710, with swings of about 20 to 30 points likely in quieter trading conditions.
Friday has no major U.S. data on the weekly calendar wrap; Thursday’s LEI fell −0.5% m/m in Aug (already out), so macro tape-bombs are limited.
Quadruple-witching: 09/19/2025 is the quarterly expiration (third Friday of Sep). Also note ESU25 last trade = Sep 19, even though most trading has rolled to ESZ25. Expect flowy opens/closes and possible “pin” behavior. 
Options positioning (ES):
• Report totals: 5.83M total OI; put/call = 3.51. 
• Friday weeklies: 2.676M OI; P/C = 5.09 (put-heavy into expiry). 
• Sep contract (ESU5, 2 DTE): ~1.07M total OI; P/C = 3.01; ~185k volume in the latest report. 
• Vol: 30-day ATM IV ≈ 12.33% (down slightly d/d). 
• 0DTE share in SPX options has been >60% of volume recently — expect same-day gamma flows to matter on a quad-witch Friday. 
Bottom line: This is a put-heavy, expiry-dense tape with subdued vol. Expect pinning/reversion around big strikes and flowy opens/closes rather than a trend day—unless price cleanly accepts outside the range.
Next known catalysts (not tomorrow but near-term): Flash PMIs Mon 9/22; U. Michigan final sentiment Fri 9/26.
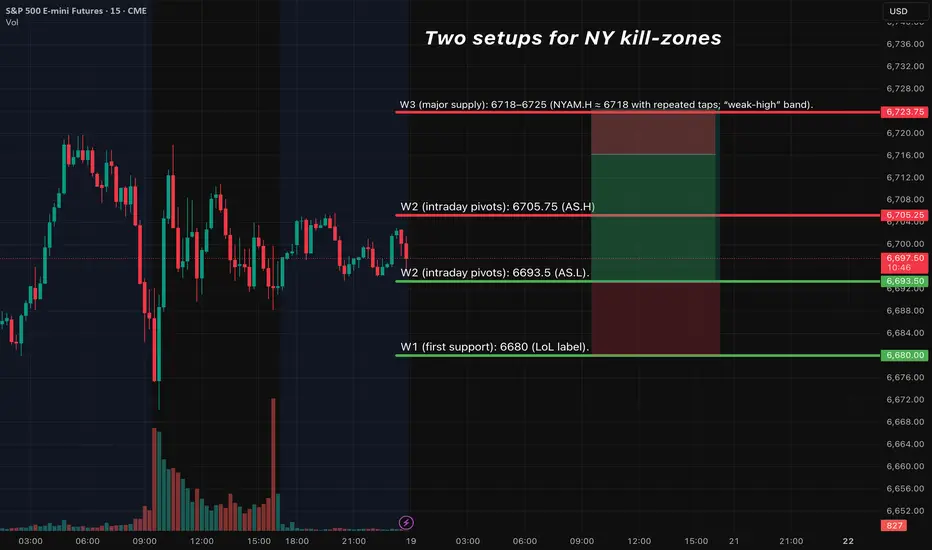
Setup 1 — Tier-2 (A+ Bounce) LONG @ 6680–6695
Trigger: sweep 6680–6690 → 15m close back above 6693.5 (AS.L) → 5m re-close + HL → 1m pullback hold.
Entry: 6694–6697.
SL: below the 15m sweep low −0.5 pt (hard).
TP1: 6705–6707 (AS.H). TP2: 6718–6725 (W3).
Management: at TP1 close 70%, move runner to BE; aim TP2; time-stop 45–60m if neither TP1/SL hits; max 2 attempts/level.
Setup 2 — Tier-1 (A++ Rejection-Fade) SHORT @ 6718–6725
Trigger: quick sweep above 6718–25 → 15m body back inside 6710 → 5m LH + re-close → 1m failure retest.
Entry: 6714–6718 on the re-close.
SL: above sweep high +0.5 pt.
TP1: 6705–6707; TP2: 6693–6695; stretch 6685–6680 only if momentum continues.
Management: same as above.
SPY options overlay (execution notes)
Given quarterly expiration and heavy 0DTE participation, prefer same-day SPY (AM window) with Δ≈0.60–0.70 on entries; consider 1-DTE for PM window to temper decay. (0DTE share data from Cboe.)
Potential neutral zone tradeThe daily structure in the S&P 500 implied the potential of a neutral zone trade. This indicates that both buyers and sellers are present and a sideways movement in this market. To determine if this neutral zone environment will hold Friday's close will be very important.

short eshigher liquidity has been hit I could see a large push down here. We took out lower gaps and I think this will be the strongest gap of the day.

Will S&P500 meet the target 7k?Will S&P500 meet the target 7k?
iN how many days? MAGA! Let's push harder!

ES - September 18th - Daily Trade PlanSeptember 18th - 5:30am
Before reading this trade plan, IF, you did not read yesterday's take the time to read it first!
(You can see my post in the related publication section)
I wrote yesterday ...
"My main levels I will be watching for a pull back to are 6659, 6653, 6648-50, 6643. The white trend line (6648-50) will continue to be a magnet on any pullback. "
"Our overnight session low is 6653 with high at 6674. IF, we can clear 6674, we should continue higher. I think we will get another pullback, Ideally, to flush the 6653 level and reclaim or even better a deeper scary flush below 6643 and reclaim, then head higher up the levels."
Let's review because we pretty much followed the plan to detail!
6660-6662 became a clear support area but each test and rally could not get higher than 6674.Then around 12pm we lost the support and slowly grinded down to the 6653 area and white trendline.
On my 12:20pm Note I stated "The Fed meeting today could produce any reaction +/- 100pts. I could see us drop below the 6637 level, flush, reclaim and rally to back test the 6660 level. To be bullish, we need to see price reclaim 6684 to continue higher."
What happened after FOMC? We rallied to 6686, dropped to 6628, rallied and flushed again to 6610 then reclaimed the 6634 area and then we rallied and closed at 6661. I stated that the reclaim of 6684 would be bullish.
What happened in the overnight session? We took off and tested 6682, pulled back, rallied to 6692, pulled back and back tested the 6682 level which we have now rallied into some key targets for the week at 6700,6709, 6714, 6720.
---------------------------------------------------------------------------------------------------------------------
Everyone that has been following my trade plans know that I am a long only ES trader. That means, I patiently wait for pullbacks into Institutional zones and ride with them higher.
Since we are now coming into our overnight session high at 6720, there is not much I can do but wait for a pull back. Let's discuss what areas we can expect a pullback and continuation higher.
Our overnight session low is 6663 with high at 6720. We do not have a ton of structure to work with at this time. We are at all-time highs, market sentiment was already bullish/greedy, and CNBC and all the talking heads will be waking up excited and bullish. Retail traders will be jumping in and chasing with FOMO today and tomorrow.
The first obvious area is the 6696-6700. We should pull back to this area and test it. Any pullback down to no lower than 6682 can build a base, reclaim a level higher and continue up. IF, we lose 6682 it will be a warning sign that this is a massive parabolic move and won't be sustainable. Remember, we have tested the white trendline 3x and closed back above it. It continues to be a bigger term support, but when we close inside it, we will most likely be in the midst of a change of character and a new bear trend could emerge. We have been in a bull market since April, and it has been a great 6 month run. Until this change occurs, we must remain bullish with possible targets higher of 6733, 6750, 6776, 6796, 6809, 6814.
Key Support Levels - 6643, 6649-50 (white trendline), 6663, 6682, 6692, 6696, 6700, 6709
Key Resistance Levels - 6719, 6733, 6750
Upside targets above are 6733, 6750, 6776, 6796, 6809, 6814.
Recap for today's key areas - We need a pull back with some structure to one of the levels, ideally at either 6696-6700, 6692, 6682. We could also build a flag down to 6705-09 and then reclaim 6714, and head to 6733. IF, we go lower than 6682, I would get out the way and wait for a reclaim of 6684. Below 6663 and we will most likely flush below the white trendline and go test the low of 6610 from yesterday.
DO NOT CHASE today! Institutions will pull the rug when they are ready and with this parabolic move overnight, anything can happen today/tomorrow. Follow the plan.
I will post an update around 10am.
--------------------------------------------------------------------------------------------------------------------
Couple of things about how I color code my levels.
1. Purple shows the weekly Low
2. Red shows the current overnight session High/Low (time of post)
3. Blue shows the previous day's session Low (also other previous day's lows)
4. Yellow Levels are levels that show support and resistance levels of interest.
5. White shows the trendline from the August lows.

The Domino EffectHow a Crisis in One Country Shakes Global Markets
Part 1: The Nature of Interconnected Global Markets
1.1 Globalization and Economic Interdependence
In earlier centuries, economies were relatively insulated. A banking collapse in one country might not ripple across the world. Today, however, globalization has created a tightly linked system. Goods made in China are consumed in Europe; oil produced in the Middle East powers factories in India; financial instruments traded in New York impact investors in Africa.
Trade linkages: A slowdown in one economy reduces demand for imports, hurting its trading partners.
Financial integration: Global banks and investors allocate capital worldwide. A collapse in one asset class often leads to capital flight elsewhere.
Supply chains: Modern production is fragmented globally. A crisis in one key hub can paralyze industries across continents.
1.2 Channels of Transmission
Economic shocks can travel across borders in several ways:
Financial contagion: Stock market crashes, banking failures, and currency collapses spread panic.
Trade disruptions: Falling demand in one country hurts exporters elsewhere.
Currency spillovers: Devaluation in one country pressures others to follow, creating competitive depreciation.
Investor psychology: Fear spreads faster than facts. When confidence erodes, investors often withdraw from risky markets en masse.
Part 2: Historical Case Studies of the Domino Effect
2.1 The Great Depression (1929–1930s)
The Wall Street Crash of 1929 began in the United States but soon plunged the entire world into depression. As U.S. banks collapsed and demand fell, countries that relied on exports to America suffered. International trade contracted by two-thirds, leading to widespread unemployment and social unrest worldwide.
2.2 The Asian Financial Crisis (1997–1998)
What began as a currency crisis in Thailand quickly spread across East Asia. Investors lost confidence, pulling money from Indonesia, South Korea, and Malaysia. Stock markets collapsed, currencies depreciated, and IMF bailouts followed. The crisis revealed how tightly emerging economies were linked through speculative capital flows.
2.3 The Global Financial Crisis (2008)
The U.S. subprime mortgage meltdown triggered the worst financial crisis since the Great Depression. Lehman Brothers’ collapse led to a global credit freeze. Banks in Europe, Asia, and elsewhere faced severe liquidity shortages. International trade shrank by nearly 12% in 2009, and stock markets around the world lost trillions in value. This crisis highlighted how financial products like mortgage-backed securities tied together banks worldwide.
2.4 The Eurozone Debt Crisis (2010–2012)
Greece’s debt problems quickly spread fears of contagion across Europe. Investors worried that Portugal, Spain, and Italy could face similar defaults. Bond yields soared, threatening the stability of the euro. The European Central Bank and IMF intervened, but not before global investors felt the tremors.
2.5 COVID-19 Pandemic (2020)
The pandemic began as a health crisis in Wuhan, China, but within weeks it disrupted the global economy. Supply chains broke down, trade collapsed, tourism stopped, and financial markets plunged. Lockdowns across the world triggered the sharpest economic contraction in decades, proving that non-economic crises can also trigger financial domino effects.
Part 3: Mechanisms of Global Transmission
3.1 Financial Markets as Shock Carriers
Capital is mobile. When investors fear losses in one country, they often pull funds from other markets too—especially emerging economies seen as risky. This creates a contagion effect, where unrelated economies suffer simply because they are perceived as similar.
3.2 Trade Dependency
Countries dependent on exports are especially vulnerable. For example, Germany’s reliance on exports to Southern Europe meant that the Eurozone debt crisis hit German factories hard. Similarly, China’s export slowdown during COVID-19 hurt suppliers in Southeast Asia.
3.3 Currency and Exchange Rate Volatility
When a major economy devalues its currency, trading partners may respond with devaluations of their own. This “currency war” creates global instability. During the Asian crisis, once Thailand devalued the baht, other Asian nations followed suit, intensifying the crisis.
3.4 Psychological & Behavioral Factors
Markets are not purely rational. Fear and panic amplify contagion. A crisis often leads to herding behavior, where investors sell assets simply because others are selling. This causes overshooting—currencies collapse more than fundamentals justify, worsening the crisis.
Part 4: The Role of Institutions in Crisis Management
4.1 International Monetary Fund (IMF)
The IMF often steps in to stabilize economies through emergency loans, as seen in Asia (1997) and Greece (2010). However, IMF policies sometimes attract criticism for imposing austerity, which can deepen recessions.
4.2 Central Banks and Coordination
During 2008, central banks across the world—like the Federal Reserve, European Central Bank, and Bank of Japan—coordinated interest rate cuts and liquidity injections. This collective action helped restore confidence.
4.3 G20 and Global Governance
The G20 emerged as a key crisis-management forum after 2008. By bringing together major economies, it coordinated stimulus measures and financial reforms. However, the effectiveness of such cooperation often depends on political will.
Part 5: Why Crises Spread Faster Today
Technology and speed: Information flows instantly through news and social media, fueling panic selling.
Complex financial instruments: Derivatives, swaps, and securitized assets tie banks and funds across borders.
Globalized supply chains: A factory shutdown in one country can halt production worldwide.
Dependence on capital flows: Emerging economies rely heavily on foreign investment, making them vulnerable to sudden outflows.
Part 6: Lessons and Strategies for Resilience
6.1 For Governments
Diversify economies to avoid overdependence on one sector or market.
Maintain healthy fiscal reserves to cushion shocks.
Strengthen banking regulations to reduce financial vulnerabilities.
6.2 For Investors
Recognize that diversification across countries may not always protect against global contagion.
Monitor global risk indicators, not just local markets.
Use hedging strategies to reduce currency and credit risks.
6.3 For International Institutions
Improve early-warning systems to detect vulnerabilities.
Promote coordinated responses to crises.
Reform global financial rules to prevent excessive risk-taking.
Part 7: The Future of Global Crisis Contagion
The next global crisis could emerge from many sources:
Climate change disruptions (floods, droughts, migration pressures).
Geopolitical conflicts (trade wars, regional wars, sanctions).
Technological disruptions (cyberattacks on financial systems).
Debt bubbles in emerging economies.
Given the growing complexity of global interdependence, crises will likely spread even faster in the future. The challenge is not to prevent shocks entirely—since they are inevitable—but to design systems that are resilient enough to absorb them without collapsing.
Conclusion
The domino effect in global markets is both a risk and a reminder of shared destiny. A crisis in one country can no longer be dismissed as “their problem.” Whether it is a banking failure in New York, a currency collapse in Bangkok, or a health crisis in Wuhan, the shockwaves ripple outward, reshaping the economic landscape for everyone.
Globalization has made economies interdependent, but also inter-vulnerable. The lessons from past crises show that cooperation, resilience, and adaptability are crucial. The domino effect may never disappear, but its destructive impact can be mitigated if nations, institutions, and investors act with foresight.
The world economy, like a row of dominoes, is only as strong as its weakest piece. Protecting that weakest link is the surest way to prevent the fall of all.

Bought the breakThe daily structure for the S&P 500 indicates a higher supply break in this market and they are continuing to support this market in the Asian session. The expectation is for continuation to the upside.

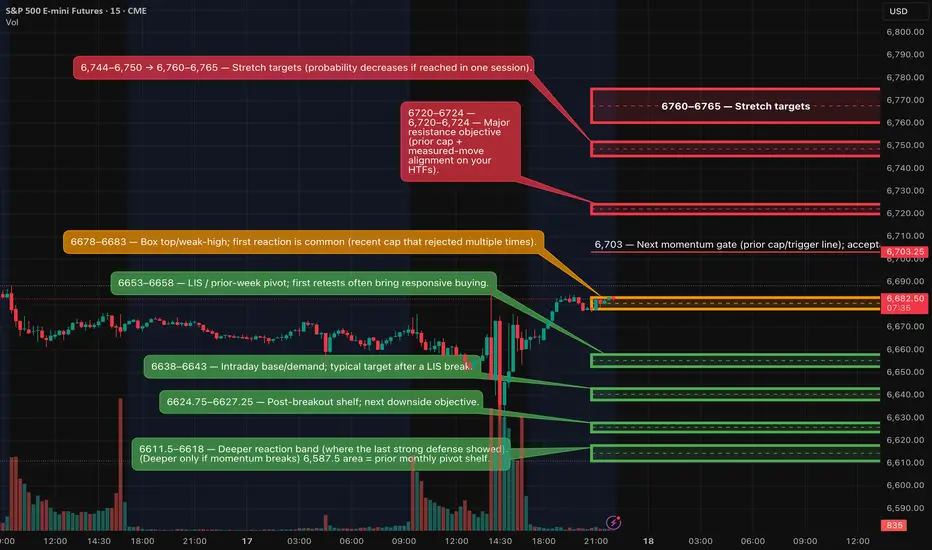
ES (SPX) Futures Analyses - Key Zones, Setups (Thur, Sep 17)Same map as last night.
Bias & structure
Price is pressing the box top 6,678–6,683 (1h AS.H 6,683.25) with a dense extension liquidity pocket above (D: 1.272 ≈ 6,763, 1.618 ≈ 6,856, 2.0 ≈ 6,959). We trade edge-only: fade a rejection at the top, or buy a sweep-and-reclaim at the control level.
Kill-zones (ET): London 02:00–05:00 (½–¾ size); NY AM 09:30–11:00; NY PM 13:30–16:00.
London (2 setups)
SHORT — Rejection Fade @ 6,678–6,683
15m tag → 15m close back ≤ 6,675 → 5m LH/re-close 6,672–6,674 → 1m LH entry 6,679–6,682.
Hard SL: above 15m rejection high +0.25–0.50.
TPs: 6,666–6,668 → 6,653–6,658 → 6,638–6,643.
Cancel if two 15m body-closes ≥ 6,685. Gate: TP1 ≥ 2.0R.
LONG — Sweep & Reclaim @ 6,653–6,658 (bias pivot)
Wick below LIS → 15m close back ≥ 6,658 → 5m re-close up 6,664–6,666 + HL → 1m HL entry 6,659–6,662.
Hard SL: below sweep low −0.25–0.50.
TPs: 6,678–6,683 → 6,703 → 6,720–6,724 (runner eyes 6,744–6,750).
U.S. (NY) (2 setups)
LONG — Acceptance Continuation > 6,683
Two 5m closes ≥ 6,685 (or one decisive 15m) → PB hold 6,679–6,683 flips to support → enter on 1m HL.
SL: under acceptance pivot −0.50–1.00.
TPs: 6,703 → 6,720–6,724 → 6,744–6,750 (→ 6,760–6,765).
Fail back below 6,679 on 5m = stand down.
SHORT — Breakdown & Failed Reclaim < 6,653
15m body close < 6,653 → retest fails (6,653–6,658 caps) → sell 6,651–6,654 on the fail.
SL: above fail-wick +0.50–1.00.
TPs: 6,638–6,643 → 6,624.75–6,627.25 → 6,611.5–6,618.
Back above 6,658 on 5m = invalidate.
Management (all plays)
First-touch priority; TP1 ≥ 2.0R gate using the 15m-anchored hard SL; no partials before TP1; at TP1 close 70% and set runner to BE; time-stop 45–60m if neither TP1 nor SL hits; max 2 attempts per level per session.
Fundamentals to respect (London → U.S. a.m.)
Bank of England MPC decision & minutes — Thu 12:00 BST (07:00 ET). High-impact for indices/GBP; often injects vol into London PM/NY open.
UK ONS releases — Thu 09:30 BST (04:30 ET) (e.g., housing affordability & Business Insights this week). Moderate.
U.S. Weekly Jobless Claims — Thu 08:30 ET (every Thursday; schedule page).
• Philly Fed Manufacturing Survey — Thu 08:30 ET.
• EIA Natural Gas Storage — Thu 10:30 ET.
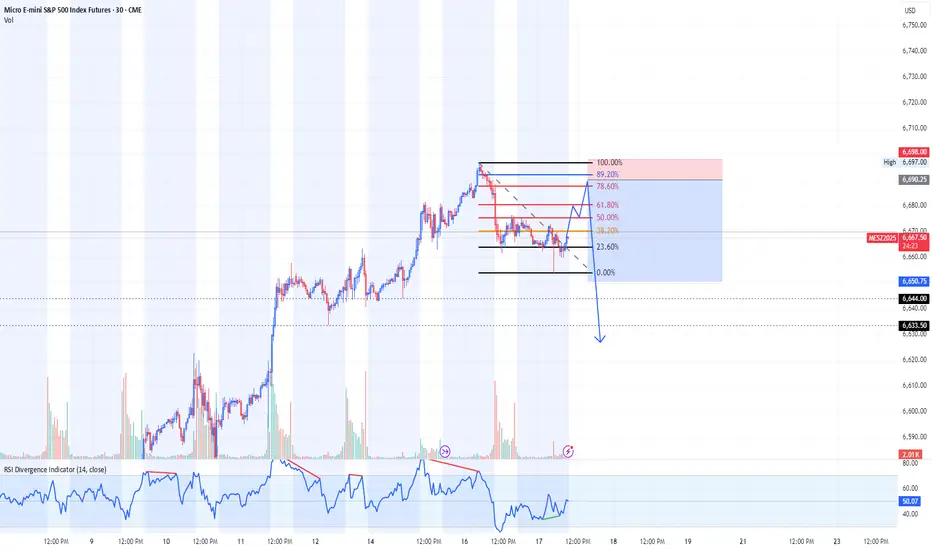
S&P 500 Futures Outlook – Correction or Pause Ahead?The S&P 500 futures remain near recent highs, reflecting strong bullish momentum driven by tech and macroeconomic optimism. However, several indicators are flashing caution. Momentum is showing signs of fatigue, with RSI/Stochastic levels edging toward overbought conditions and breadth narrowing to fewer leading stocks. These signals often precede either a short-term correction or a consolidation phase, as the market takes a breather before deciding its next leg.
Key support levels on the daily chart sit near recent consolidation zones and moving averages. If these levels break, we could see a retracement in the 5–8% range, bringing futures back to test medium-term supports. On the other hand, holding above resistance and regaining momentum could translate into a sideways pause rather than a deep pullback. In short, the market remains in a bull trend, but traders should stay alert for signs of a cooling phase that could unfold in the weeks ahead.

Day 32 — Trading Only S&P Futures | +$2,171 FOMC ReversalDay 32 of Trading Only S&P Futures is in the books!
The day started rough — I went long off an X7 buy signal at the 1-min MOB, got greedy, and ended up down -180 early. Instead of forcing it, I stepped away. By the afternoon, I was mapping out key levels ahead of FOMC.
That prep paid off. My orders for the “pop and drop” scenarios lined up perfectly with the signals. I made back my losses and finished +$2,171. Discipline + structure = consistency.
📰 News Highlights
Fed projections show 9 of 19 officials see two more cuts in 2025
🔑 Key Levels for Tomorrow
Above 6670 = Flip Bullish
Below 6640 = Flip Bearish

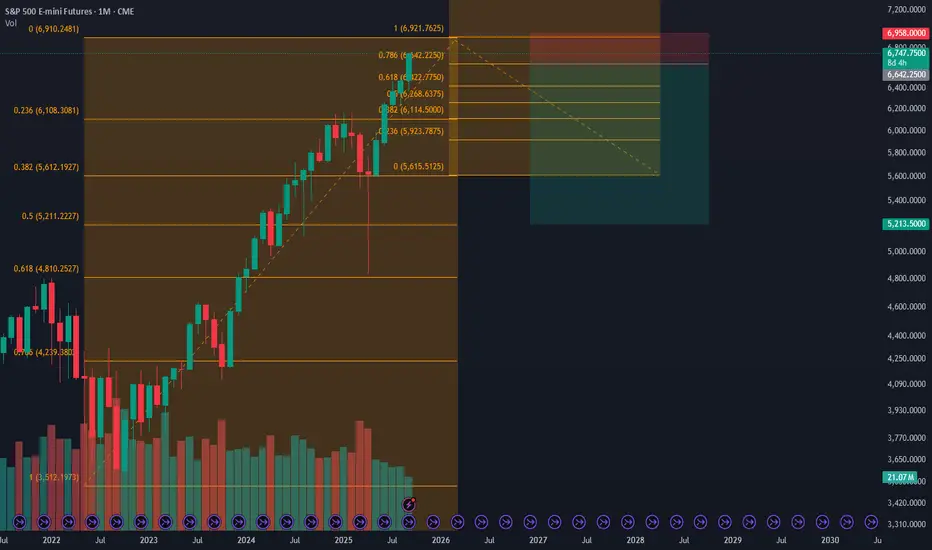
S&P 500 2030 ForecastFor the S&P 500 I think its fair to put the 2030 projection between two bounds. 8900 lackluster and 12800 outperformance. If it maintains its trajectory some where in the middle it could hit 10,000 by 2029. Its probably better to put a bit more conservative forecast to account for uncertainties.
2030 forecast S&P 10,000
#SnP500
#marketprojection

ES - September 17th - FOMC - Daily Trade PlanSeptember 17th - 6am
I stated yesterday in our daily trade plan -
"My main levels I will be watching for a pull back to are 6681-83, 6671, 6643. The white trend line will continue to be a magnet on any pullback, but when we start to really sell off, price can slice through lots of levels below. That is why it is important to be patient and wait for price to build a good base and institutions to start accumulating again."
We pulled back to 6682 then spiked to 6687 then lost the level after the open. We then flushed the overnight low of 6671, spiked, but could not hold anything higher 6675. We finally then hit the Monday afternoon low of 6663 with a very quick flush down to 6661.25. I was actually able to ride this move up to 6673 as my stop was at 6660 (not 6662) when I wrote my note yesterday at 11:07am. I also stated the "reclaim of 6671 should keep us moving higher". 6671 became a magnet yesterday and the highest we got was 6676.
In my 3:35pm Note - "Today we got a nice pullback, and I was able to grab 10pts with a very tight stop. The 6671 level became a magnet this afternoon and then we lost it after 3:15pm. Price should still retest the 6682 level in the overnight session. IF, we lose the 6662 daily low, we will need to work down the levels with 6643 being a good spot for points. I do not think we will lose the 6662 low overnight and will most likely head higher to retest 6682 then continue up the levels if we can hold overhead resistance."
What happened overnight? We still haven't cleared 6676 and finally lost the 6661 level after testing 2x with a nice flush down to 6653 and then reclaim of 6657. You can look at the 1 min chart around 4:30am and see that we flushed down to 6656, then back tested 6661, came back down to make a low at 6653 and you can enter on any reclaim of 6656. Of course, this was a great level reclaim that I was not yet awake for 🤷♂️. The good news, we should get another great setup at some point today.
--------------------------------------------------------------------------------------------------------------------
Today's action is pretty simple, to be honest.
Our overnight session low is 6653 with high at 6674. IF, we can clear 6674, we should continue higher. I think we will get another pullback, Ideally, to flush the 6653 level and reclaim or even better a deeper scary flush below 6643 and reclaim, then head higher up the levels.
Key Support Levels - 6643, 6649-50 (white trendline) 6653, 6659, 6663
Key Resistance Levels - 6674, 6682, 6686, 6692, 6697
Upside targets above are 6700, 6709, 6724, 6732 (IF, Bulls really want it)
My main levels I will be watching for a pull back to are 6659, 6653, 6648-50, 6643. The white trend line (6648-50) will continue to be a magnet on any pullback. Size down today and be patient. We have the FOMC at 2pm and I will only be taking trades that present themselves until around 12pm. I will be off my desk the rest of the day. I will send out a note around 10am after the NYSE open has settled.
