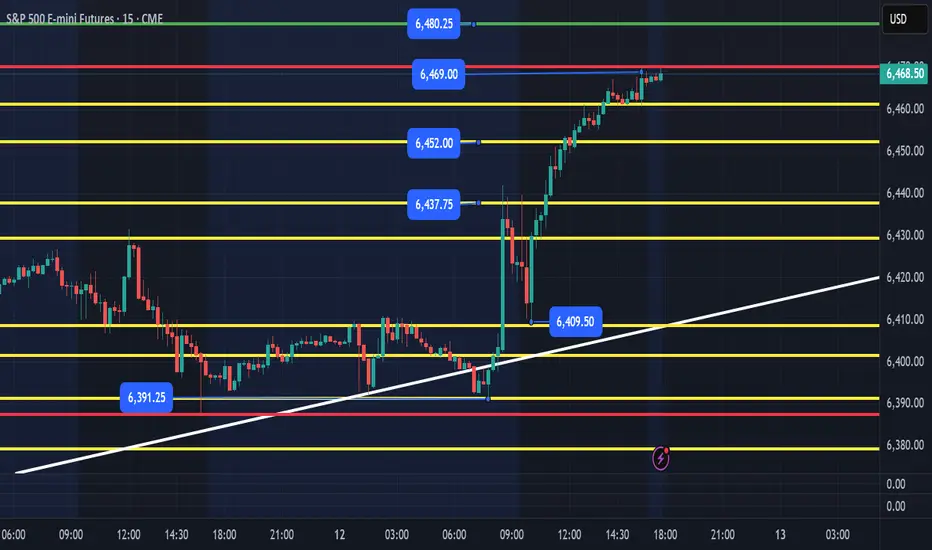
ES- August 14th - Daily Trade Plan7:25am EST
Price has built up an overnight base between 6476 and 6490. PPI coming out this am and we could keep grinding higher or Ideally we get a loss of 6477 and reclaim to setup a nice opportunity for 10+ points and retest the 6502 high yesterday with potential upside targets of 6514, 6525, 6539.
I will update my thoughts after PPI is released. I am first looking for a flush below overnight low and reclaim or we will need to see a quick flush of lower levels at 6452, 6437 or levels shown by the yellow support levels on the chart as areas we could flush and move higher. Below 6397 and we could continue lower. IF, price is falling fast, I would get out the way and let price find support at a level and put in a good base to build and work higher.
My lean is we continue higher but first we need a flush to scare holders and push prices higher as we head into Friday OPEX. I could see us potentially spiking to 6502, 6514 after PPI then come back into the overnight range after the NYSE open. I won't be guessing or chasing, I will just be focused on how price acts and will wait for my entry to enter. IF, price loses 6437 area and doesn't reclaim, it might need to head to 6409 or 6391 area to setup a strong back test.
Update around 10am EST.
WSPM2019 trade ideas

Tomorrow’s Playbook: Levels, News Bias & Scenarios 08/14/2025Summary: Bias = Neutral→Bullish while above 6,464–6,466 and the 15m 200-EMA (6,459). A clean 5m/15m acceptance above 6,491/6,500 favors continuation; otherwise expect a data-driven sweep into 6,475–6,468 to test demand.
Scenarios & Triggers (rule-based)
1) Continuation breakout
• Trigger: 5m close > 6,491 → probe 6,496–6,500.
• Validation: 15m acceptance above 6,500 (no immediate rejection).
• Targets: 6,502–6,505 first; stretch 6,512/6,520 if momentum persists.
• Management: If price reclaims 6,491 from above after a retest, momentum likely intact.
2) Rotation to demand (buy-the-dip if structure holds)
• Trigger: Rejection at 6,489–6,491 with 5m close back inside range.
• Path: 6,482 → 6,475.5 → 6,468; watch order-flow absorption or an FVG fill inside 6,464–6,466.
• Validation: Bullish 5m close from the box and 15m structure holds above 6,459.
• Targets on bounce: Return to 6,489–6,491, then 6,496–6,500.
3) Bearish flip (lower-probability without data shock)
• Trigger (strict): 15m bearish confirmation and sustained acceptance below 6,459 (15m 200-EMA).
• Path: Open the door to a deeper mean-reversion leg toward prior breakout bases (next map would be built after the break).
• Note: No shorts without that 15m confirmation per protocol.
Educational only — not financial advice.

S&P500 Long Bullish long term
-15m demand zone sitting under 15m high
-Entry in liquidity sweep of demand zone
-Ride plane north to continue trend

PPI and jobless claimsPPI and jobless claims will be the focus on Thursday for the S&P 500 daily chart. The market is looking for these reports to support the idea that the Fed will lower interest rate in September.

Day 8 — Trading Only S&P Futures — From -400 to +155Welcome to Day 8 of Trading Only S&P Futures!
Today was a battle of patience and discipline. I started the day with a -400 loss from an overnight short order that got stopped out before the market even opened. It was tempting to close up shop, but I traded small, stayed disciplined, and waited for the right setup.
Once I saw the X7 Sell Signal align with X3 Bearish Structure, I sized up — turning the day from deep red to +155 before fees.
📈 What you’ll learn
How to manage a big overnight loss without spiraling
The importance of sizing down until confidence returns
Using structure + signal alignment for A+ setups
Patience in clawing back losses
⏰ Timestamps
0:00 — Intro & Day 8 Recap
0:40 — The Overnight Loss & Mindset Shift
1:40 — Clawing Back With Small Trades
2:20 — The X7 + X3 Bearish Alignment Trade
3:00 — Market News & Impact
3:30 — Key Levels for Tomorrow
📰 News Highlights
DOW jumps over 400 points, VIX falls as stocks end higher on rate cut bets.
🔔 VX Algo Signals (9:30am – 2pm EST)
3:00 AM Market Structure flipped bullish on VX Algo X3!
9:30 AM VXAlgo ES X1 Sell Signal
9:42 AM VXAlgo NQ X1 Sell Signal
10:00 AM VXAlgo ES X1 Sell Signal
10:26 AM VXAlgo ES X7 Sell signal
10:30 AM Market Structure flipped bearish on VX Algo X3!
11:20 AM VXAlgo ES X1 Buy signal (double buy)
1:25 PM VXAlgo NQ X3 Buy Signal
2:13 PM Market Structure flipped bullish on VX Algo X3!
🔑 Key Levels for Tomorrow
Above 6440 = Remain Bullish
Below 6410 = Bearish

ES - August 13th - Daily Trade PlanWe built an overnight base between 6462 and 6475. We broke out of this and have grinded higher into the 6484 target we have been looking for this week. PPI coming out this am and we could keep grinding higher or Ideally we get a loss of 6462 and reclaim to setup a nice opportunity for 10+ points and retest the highs of the day and potential target 6492, 6503+.
I will update my thoughts after PPI is released. I am first looking for a flush below overnight low and reclaim or looking at 6452, 6437 or 6424 level as shown by the yellow support levels on the chart as areas we could flush and move higher. Below 6397 and we could continue lower.
My lean is we continue higher, but first need a flush to scare holders and push prices higher as we head into Friday OPEX.
Update around 10am EST.

Day 7 Trading Only S&P Futures — Trusting Structure Over GreedWelcome to Day 7 of Trading Only S&P Futures!
Today was a mixed day with a small loss of -$16.65. I started strong, up $133 early on, but after a big push up, I expected the market structure to flip bearish and missed a key long entry. Later, I shorted the 6451 resistance but let greed get the best of me, holding too long and turning a winner into a loss.
The key lesson? Trust the market structure and the double down (DD) signals — don’t fight the system.
📈 What you’ll learn
Why trusting structure and signals beats guessing the market
How greed can sabotage even well-planned trades
The importance of taking profits on key moves
Reading VX Algo signals for better trade timing
⏰ Timestamps
0:00 — Intro & Day 7 Recap
0:30 — Trading Wins & Mistakes
1:30 — VX Algo Signal Review
2:30 — Market News & Impact
3:30 — Key Levels for Tomorrow
🔔 VX Algo Signals (9:30am – 2pm EST)
8:29 AM Market Structure flipped bullish on VX Algo X3!
10:10 AM VXAlgo NQ X1 Buy Signal
10:20 AM VXAlgo NQ X1DD Buy Signal (double buy)
11:30 AM VXAlgo ES X1 Sell Signal
11:50 AM VXAlgo ES X1 Sell Signal
12:10 PM VXAlgo NQ X1 Sell Signal (double sell)
12:40 PM VXAlgo NQ X1 Sell Signal
📰 News Highlights
S&P 500 closes at a new record high.
🔑 Key Levels for Tomorrow
Above 6410 = Remain Bullish
Below 6390 = Bearish

SP500 LongSP500 is not net long the regression break.
I am considering a limited risk position long.

Solid closeBuyers created a solid close on the daily S&P 500 chart. The expectation for Wednesday is follow through with an objective to the upside of 6495.

ES - August 13th - Opening Session Trade PlanToday's CPI was not as complex as I have seen in other releases. While price tried to shake out longs by ripping 40pts at the 8:30am CPI release, sold off and held structure support at 6410 and continued higher and have met 2 out of 3 targets I had planned for the week.
I posted the following this morning.
"IF, price can hold the 6411-14 area, we should be able to put in a nice bull flag and continue up after the 9:30am NYSE open. IF, price losses the 6410 level, we might need to try and dip below yesterdays low at 6387 and then rally up. We are still targeting the levels above at 6452, 6468, 6480 to hit this week."
We hit 6409.75 and took off and hit our 6452 & 6468 targets!
What is next for ES with PPI coming out tomorrow and OPEX on Friday. I expect to see more complex trading the next couple of days. ES closed at the highs and are only 12pts from our last target of 6480 this week. ES can continue higher with price putting in structure between 6430-6468. The yellow support levels I have outlined are areas we could see price test, recover, reclaim and move us higher. Ideally, we can set a low overnight that we flush and recover to get us to the 6480, 6493+ targets.
IF, price needs to cool off, we would want to see it go no lower than 6430 area with a reclaim of the 6437 support level. That would be a healthy pullback and keep structure moving higher.
There is nothing short term bearish until we lose the 6391 level. IF, price does go that low, we should see an initial bounce, but would be a warning sign. The RSI on the 8hr chart is currently at 80, which alone isn't a signal that price will reverse, it is something to keep an eye on. We could get a rug pull tomorrow after the PPI release all the way back down to the 6390 level, IF, we do and ES is selling fast, wait for price to build structure around 6380-85 level and enter once it clears the 6390-92 level.
I will post an update and Daily Trade plan by 8am EST based on overnight price action.
You can reference my trade plan from today by looking at the related publication section to the right and also see my weekly overview I posted on Monday am. Follow to get my daily trade plan.
Are We Replaying the Dot Com Era?I’m completely unbiased here - more so curious - but today’s S&P 500 setup looks eerily similar to the late 1990s. In 1996 and 1997, the index posted back-to-back gains of over 20%, just as 2023 and 2024 have done. Then, in 1998, we saw a sharp 20% pullback - much like the one we’ve had in April of 2025. If you overlay that late-’90s fractal on today’s chart, the trajectory points to an S&P 500 level near 8,200 by early 2027.
The bullish case practically writes itself: strong GDP growth, resilient corporate earnings, AI-driven productivity gains, a still-accommodative liquidity backdrop, and investors willing to pay up for growth narratives—just as they did in the dot-com era. The “there is no alternative” (TINA) mentality toward equities was alive then, and it’s alive now. If the trend holds, the next couple of years could deliver staggering upside.
That said, it’s purely an observation - not a prediction. A decisive break below the key rising support trendlines would negate this bullish scenario and shift me to a cautious or neutral stance. Until then, the pattern is worth keeping an eye on.
ES Fails to Break ATH – Possible Reversal Ahead?
The S&P 500 futures (ES) made another attempt at the all-time high but failed to push through. This rejection at resistance could signal potential exhaustion from buyers.
Key points I’m watching:
Strong rejection at ATH zone.
Momentum slowing on shorter timeframes.
Increased selling pressure in the last few sessions.
Potential for a pullback toward recent support levels.
If sellers step in with volume, we could see a healthy correction before any new ATH attempt. On the flip side, a strong breakout above this level with sustained buying could invalidate the short bias.

2:1 on MES1! for an expected market miss on USD CPI yr/yrThe forecasted 2.8 USD CPI yr/yr looked too high. The 10 yr average of 2.68 and trend of market misses along with the price of oil suggested a potentially lower cpi yr/yr than forecasted. It setup for a trend following long on risk.

ES - August 12th - Daily Trade Plan9:15am - Daily Trade Plan
I wrote last night that " CPI is tomorrow at 8:30am and my lean is that we hold today's low overnight and continue to move sideways between 6387-6414. Ideally, we can flush down below 6380 and reclaim today's lows of 6387. The levels in yellow and a reclaim of the white trendline are the levels I am watching to trap shorts and move us up higher and out of the range."
Price set an overnight low of 6392 and we touched that level 3X overnight and into this am. You can see that price engaged the trendline areas, flushed below and then rallied. At 7:45am we started to build momentum and when CPI came out we rallied to 6440 area and are currently back testing the breakout zone. IF, price can hold the 6411-14 area, we should be able to put in a nice bull flag and continue up after the 9:30am NYSE open.
IF, price losses the 6410 level, we might need to try and dip below yesterdays low at 6387 and then rally up.
We are still targeting the levels above at 6452, 6468, 6480 to hit this week.
Follow me to be notified of my daily trade plan.
AMP Futures - Heikin Ashi meets bar Replay!In this idea we will demonstrate how to access the NEW Heikin Ashi bar replay feature in Tradingview.

50 50The market structure in the S&P 500 daily chart implies a 50-50 type set up as the market waits for the CPI numbers that will be released on Tuesday.

ES - August 12th Daily Plan - Session OpenWe kicked off the week with a choppy session that ended closer to the lows of the session range. 6387 - 6432 with 6414 being the magnet in between. We cant get moving to the upside until we can clear this choppy range. Price can still continue sideways until a catalyst breaks it out of this range. CPI is tomorrow at 8:30am and my lean is that we hold today's low overnight and continue to move sideways between 6387-6414. Ideally, we can flush down below 6380 and reclaim today's lows of 6387. The levels in yellow and a reclaim of the white trendline are the levels I am watching to trap shorts and move us up higher and out of the range. We will most likely get some fake outs tomorrow and I will only trade the reclaim of today's low or a level lower. I will update the plan tomorrow am before 8am EST and can provide more thoughts based on the overnight session action. Still bullish above 6333, but a loss of 6360 could be a signal that we need to go further down before we can keep momentum higher. Ideally, we build a base overnight, flush today's low and rally up to the 6430 resistance in the range.
Make sure to follow if you want to receive notifications of when I post my daily plan.
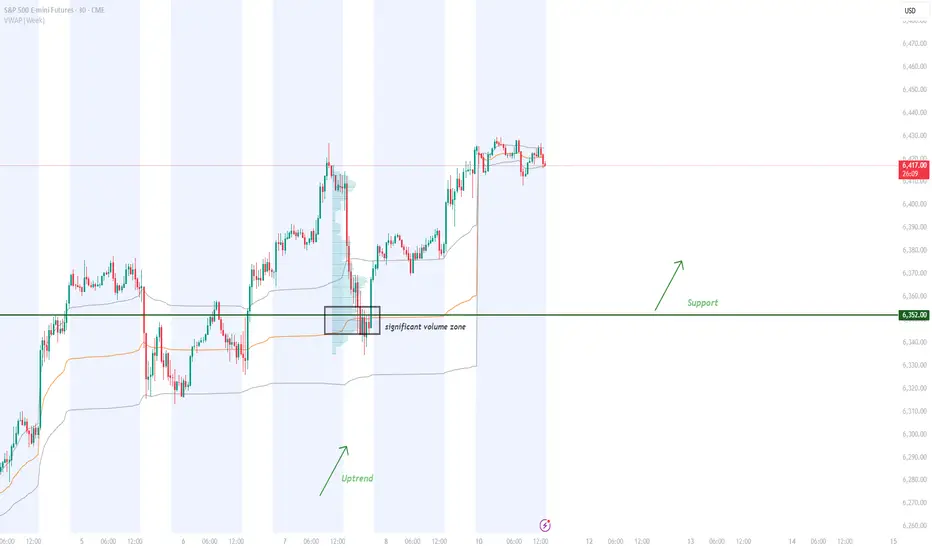
ES Rejection Setup: Volume Profile & Fair Value Gap StrategyOn ES, it’s nice to see a strong buying reaction at the price level of 6352.00.
There’s a significant volume cluster in this area, showing strong buyer accumulation. I believe buyers who entered here will defend their long positions. If the price returns to this level, strong buyers will likely push the market up again.
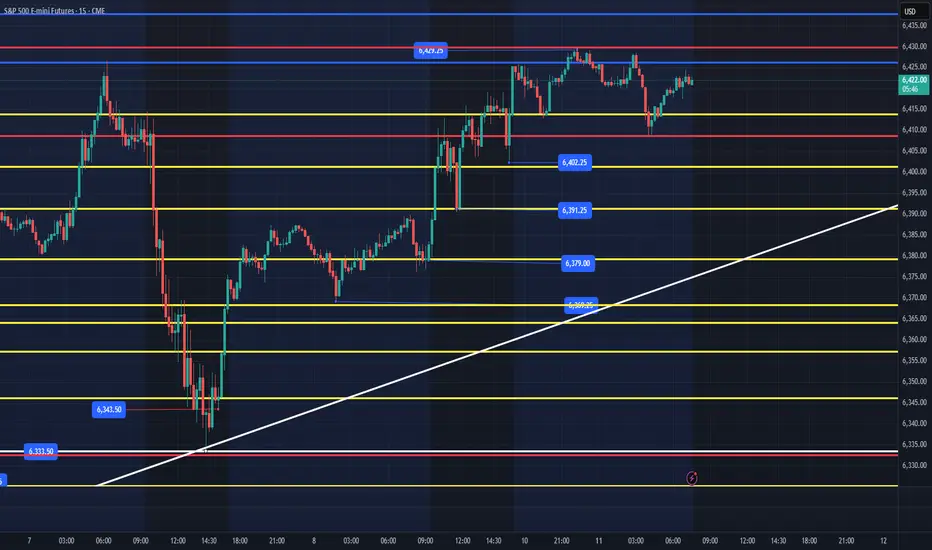
ES - August 11th - Daily Trade Plan7:30am EST - August 11th
I have posted my weekly trade plan that is available to read in the related publication section of this week daily plan posts.
I still believe that price can keep moving higher to my weekly targets of 6452, 6482. We have some economic numbers being released and its OPEX.
In the overnight session price dropped down to 6413 and bounced to 6430. When we came back down price was bought back up around 6408 and we put in a nice reclaim of the overnight low session level and rallied to 6425 around 7am.
I am looking for price to flush the 6402 level (possible 6397-99) and reclaim that level for a good 10pt+ move. I have marked the levels in yellow that I will be watching for a nice reaction to grab some points today. (6402, 6391, 6379) are the main levels I want to look for price to flush and reclaim. IF, price does break out before a pull back this am. You can look for a back test of the 6430 level as a potential entry on strength.
I will post more of an update around 10am once the NYSE opens and we see what price is trying to do in the first 30 mins.
ES Weekly Trading Plan - August 11th-15th, 2025We have some upcoming key events this week.
CPI - 8:30am EST - August 12th
PPI - 8:30am EST - August 14th
OPEX - EOD - August 15th
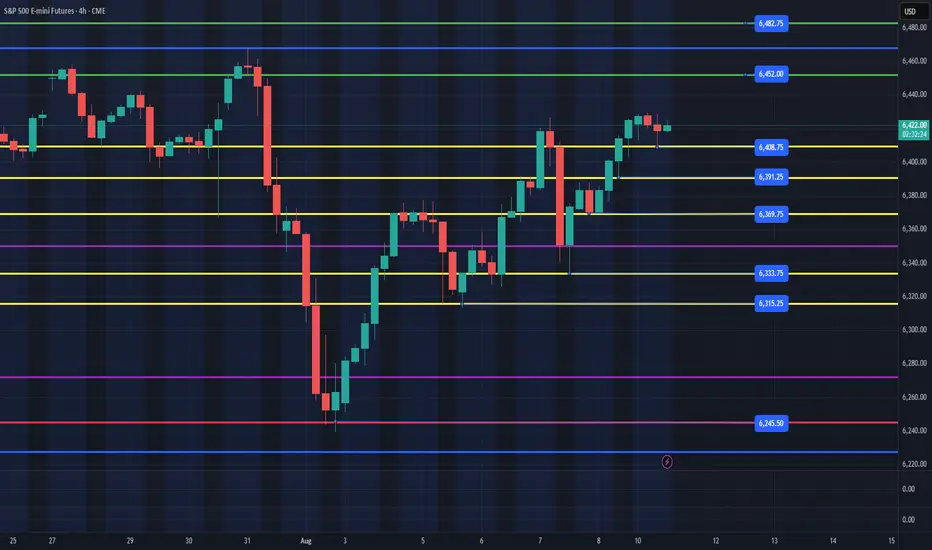
As you can see on the 4hr chart, we have a very simple and strong up trend that institutions have been buying at the yellow lines since we bottomed around 6240 August 1st.
IF, price is to continue to be bullish, we should see some fake outs this week and buyers should step in at the areas in yellow. IF, we lose the 6333 level, then the bullish structure will have changed to short term bearish, until we can retest the 6240 level and reclaim.
I still believe that price can hit the green levels (6452,6482) this week. Big Picture, we are still in an uptrend, and we should be looking for opportunities on the daily chart to find where the institutions may be stepping in to drive price higher.
Follow for my Daily Plan that I will post by 8am EST each day this week.
ES Futures — Week Ahead Playbook (Aug 11–15)Macro Drivers to Watch
Tue Aug 12 @ 8:30 AM ET — CPI (July)
Key inflation print; expect sharp vol expansion in NY AM.
Wed Aug 13 @ 2:00 PM ET — FOMC Minutes
Insight into Fed’s July 29–30 meeting tone.
Fri Aug 15 @ 8:30 AM ET — PPI (July) + Retail Sales (July)
Two high-impact releases within minutes.
Geopolitics:
US–China tensions over AI chip export controls & Russian oil tariffs
Possible Alaska summit with Trump, Putin, Zelenskyy Friday.
Bias & Structure
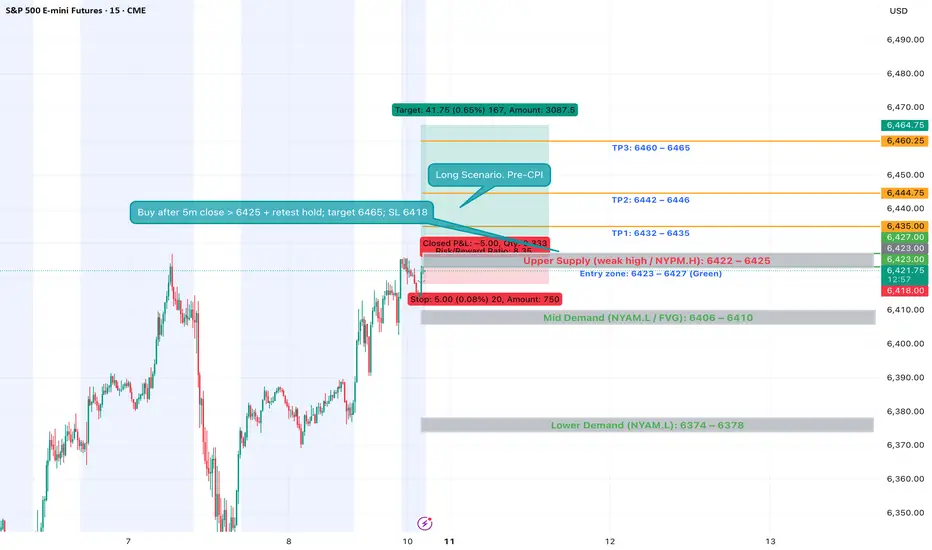
Trend (30m / 15m / 5m): Still bullish but pressing into 6415–6425 supply / weak-high zone.
Demand below: ~6410, ~6397, ~6386, ~6374.
Supply above: ~6425, ~6442–6446, ~6460–6465.
Setup 1 — Post-CPI Continuation Long
Trigger: First 5m close above 6422–6425 after CPI, then retest holds.
Entry: 6423–6427 (retest).
Invalidation: 5m close < 6418.
Targets:
TP1: 6432–6435
TP2: 6442–6446
TP3: 6460–6465
Notes: Needs bullish displacement, BOS hold, and Bookmap absorption on retest.
Setup 2 — Post-CPI Reversal Short
Trigger: Hot CPI or failed breakout → 5m close < 6406–6410, then retest from below.
Entry: 6406–6410.
Invalidation: 5m close > 6413–6415.
Targets:
TP1: 6388–6392
TP2: 6376–6378
TP3: 6358–6362
Notes: Needs trend flip on 30m/15m (CHoCH/BOS down) & heavy offer-side aggression.
S&P 500 (ES1!): Bullish! Look For Valid Buy Setups!In this video, we will analyze the following FX market for the week of Aug 11 - 15h:
S&P 500 (ES1!)
The S&P 500 rose Friday to close the week strong on a busy week of tariff updates and good earnings.
There is no reason to consider selling.
Wait for pullbacks to FVGs for high probability buys. Look for IRL to ERL, and repeat.
Enjoy!
May profits be upon you.
Leave any questions or comments in the comment section.
I appreciate any feedback from my viewers!
Like and/or subscribe if you want more accurate analysis.
Thank you so much!
Disclaimer:
I do not provide personal investment advice and I am not a qualified licensed investment advisor.
All information found here, including any ideas, opinions, views, predictions, forecasts, commentaries, suggestions, expressed or implied herein, are for informational, entertainment or educational purposes only and should not be construed as personal investment advice. While the information provided is believed to be accurate, it may include errors or inaccuracies.
I will not and cannot be held liable for any actions you take as a result of anything you read here.
Conduct your own due diligence, or consult a licensed financial advisor or broker before making any and all investment decisions. Any investments, trades, speculations, or decisions made on the basis of any information found on this channel, expressed or implied herein, are committed at your own risk, financial or otherwise.

Stock Index: S&P 500, Nasdaq & Dow Jones Weekly AnalysisBias For This Week:
ES: Bullish Up To $6,468.50
NQ: Bullish Up To $23,845
YM: Neutral
