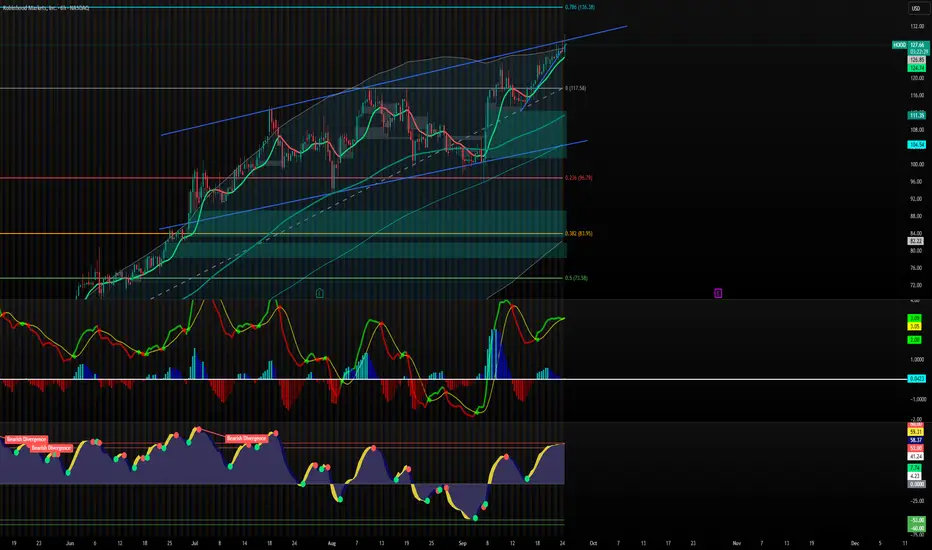
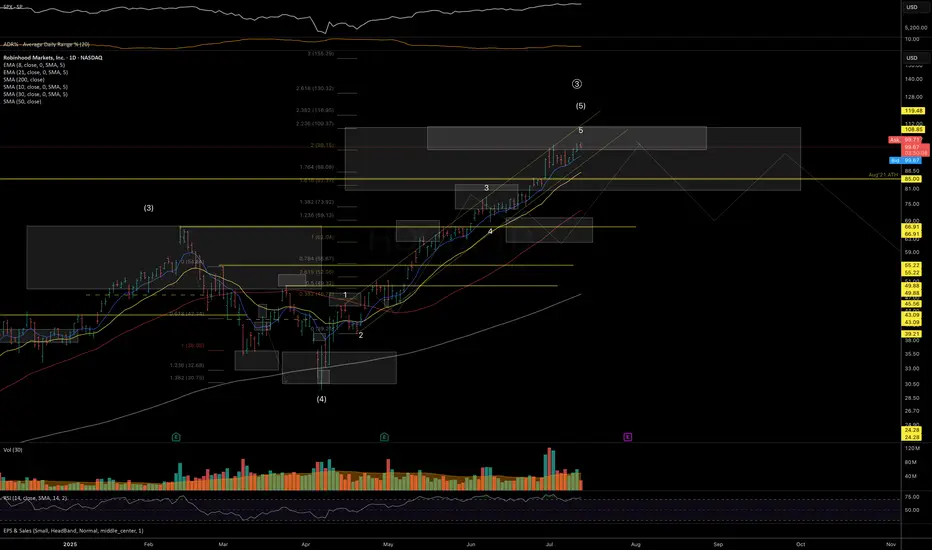
HOOD - Will it have a pullback ? Chart Breakdown
1. Price Action & Trend
Current price: ~128.19
The stock is moving inside a rising wedge channel (two converging upward blue lines).
Price is testing the upper resistance of the wedge — often a spot where momentum can stall or reverse.
Strong uptrend since late August, but this stee
Key facts today
Next report date
—
Report period
—
EPS estimate
—
Revenue estimate
—
37.96 MXN
29.42 B MXN
62.03 B MXN
744.36 M
About Robinhood Markets, Inc.
Sector
Industry
CEO
Vladimir Tenev
Website
Headquarters
Menlo Park
Founded
2013
ISIN
US7707001027
FIGI
BBG0139225P7
Robinhood Markets, Inc is a financial services platform, which engages in the provision of retail brokerage and offers trading in U.S. listed stocks and Exchange Traded Funds, related options, and cryptocurrency trading, as well as cash management, which includes debit cards services. The company was founded by Vladimir Tenev and Baiju Prafulkumar Bhatt in 2013 and is headquartered in Menlo Park, CA.
Related stocks
HOOD – TA for Sep 29HOOD – Slipping in a Channel as Gamma Points to Big Floors and Ceilings ⚠️
1-Hour Technical Outlook
Robinhood continues to grind inside a descending channel, with sellers controlling the short-term structure. Price is hovering near $121.8, caught between lower highs and the key $120.6 pivot. MACD i

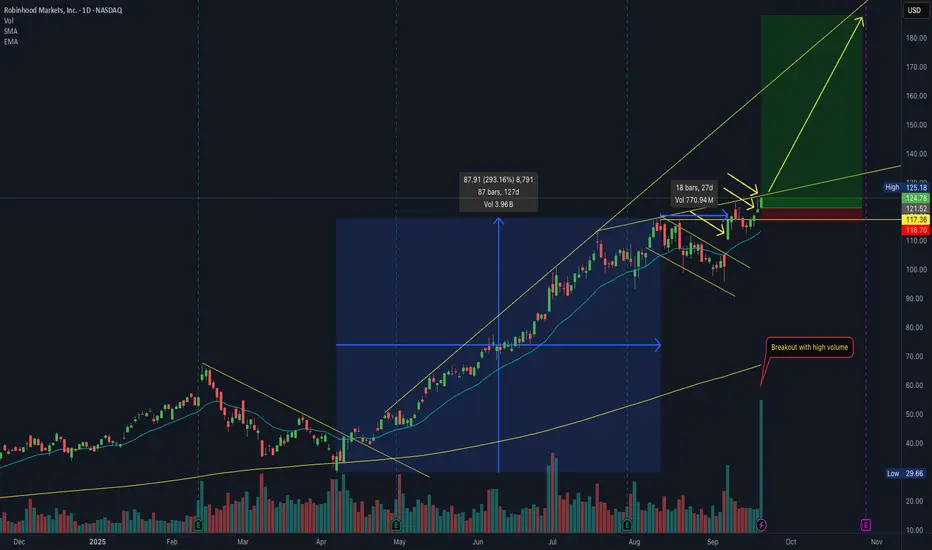
Potential Buy Setup – $HOOD Breakout on High VolumeKey points:
• Growth of 293% in the previous 4 months
• Consolidation phase of nearly 1 month after the growth, with low volume and respecting the EMA21
• Beginning of a flag breakout with average volume surging more than 50%
• Continuation breakout above the previous high with another volume surge
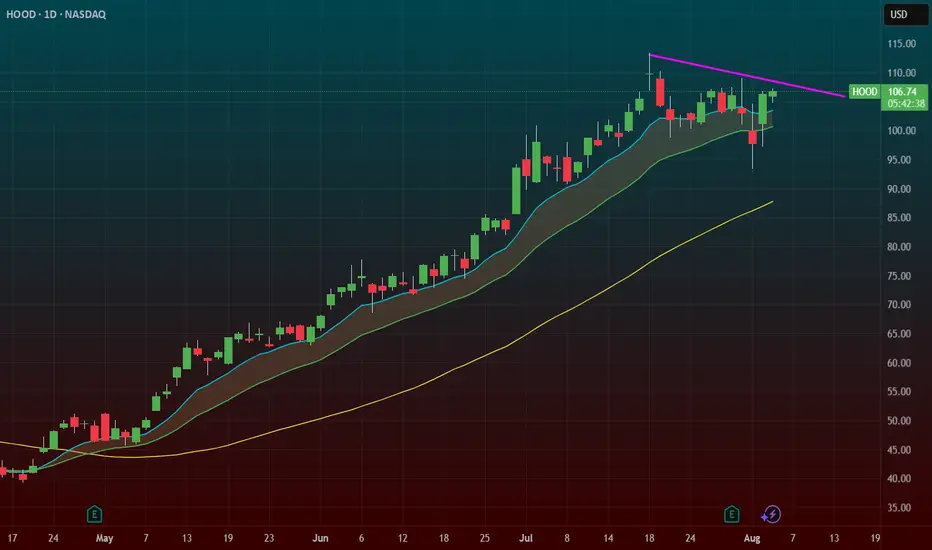
HOOD BUY SET UPHOOD has been on an uptrend lately with strong trading volume. It has broken out of an ascending triangle on Daily chart, supported by growth factors such as its upcoming S&P 500 inclusion, increased CRYPTO trading on its platform and the launch of Robinhood Ventures Fund I. Looking ahead to next we

$HOOD – Flag Breakout Setup with Post-Earnings Shake & BakeNASDAQ:HOOD – Hot Momentum + Crypto Tailwind + Flag Breakout in Motion
Robinhood ( NASDAQ:HOOD ) is setting up for a momentum breakout after delivering a perfect post-earnings shake & bake — and now it’s reclaiming key levels with force.
🔹 The Setup:
After earnings, NASDAQ:HOOD flushed under $1
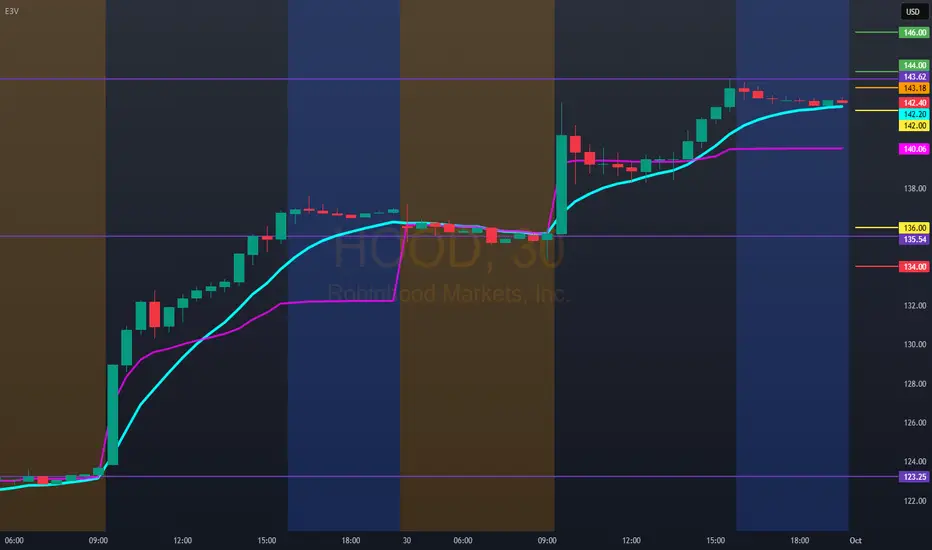
Hello trader, for tomorrow, 10/01/25, HOOD 143.18Bullish entry above 144.00/146.00 is overbought. Stop below VWAP.
Quick technical bearish entry below 142.00 to the 136.00 area. If there is a rejection in this area, the price could rebound, taking a bullish entry above VWAP. If it breaks 136.00, our bearish entry will reverse below 134.00.
Note:
Hood Plan Sept 30
Over 138.71 with volume → I’m riding it to 140.
Under 134.65 → I’m looking for 133.65.
Between 136–138 → just noise, I’ll chill.
🧠 Market feels shaky, so I’m not going all-in. Just keeping it light, take the quick wins, don’t overstay.
🐋 Big money is buying calls (bullish), but heavy sellers pa

Robinhood Markets, Inc. 1W NASDAQ NASDAQ:HOOD is exploring new highs. #HOOD is targeting $162.69, which is the target price based on the chart pattern. It's amazing how the crypto world is gaining more and more adoption every day. The top 5 digital currency exchanges (BNB, Coinbase, Robinhood, etc.) seem to be aiming for a price of

HOOD — In Key Macro Resistance ZonePrice has reached a major resistance zone, with the 110 level marking an ideal spot where downside pressure may begin to dominate and a mid-term top could start forming. Macro support for the macro-uptrend structure is at the 80–65 area.
Hedging near current levels may be prudent - especially ahead
Hood techincal support I see exhaustion of sales in the stock, possible buying opportunity, as it is in the balance of the structure.

See all ideas
Summarizing what the indicators are suggesting.
Neutral
SellBuy
Strong sellStrong buy
Strong sellSellNeutralBuyStrong buy
Neutral
SellBuy
Strong sellStrong buy
Strong sellSellNeutralBuyStrong buy
Neutral
SellBuy
Strong sellStrong buy
Strong sellSellNeutralBuyStrong buy
An aggregate view of professional's ratings.
Neutral
SellBuy
Strong sellStrong buy
Strong sellSellNeutralBuyStrong buy
Neutral
SellBuy
Strong sellStrong buy
Strong sellSellNeutralBuyStrong buy
Neutral
SellBuy
Strong sellStrong buy
Strong sellSellNeutralBuyStrong buy
Displays a symbol's price movements over previous years to identify recurring trends.
Curated watchlists where HOOD is featured.


Frequently Asked Questions
The current price of HOOD is 2,539.00 MXN — it has decreased by −2.99% in the past 24 hours. Watch Robinhood Markets, Inc. Class A stock price performance more closely on the chart.
Depending on the exchange, the stock ticker may vary. For instance, on BMV exchange Robinhood Markets, Inc. Class A stocks are traded under the ticker HOOD.
HOOD stock has risen by 7.18% compared to the previous week, the month change is a 31.21% rise, over the last year Robinhood Markets, Inc. Class A has showed a 456.80% increase.
We've gathered analysts' opinions on Robinhood Markets, Inc. Class A future price: according to them, HOOD price has a max estimate of 2,942.26 MXN and a min estimate of 1,250.46 MXN. Watch HOOD chart and read a more detailed Robinhood Markets, Inc. Class A stock forecast: see what analysts think of Robinhood Markets, Inc. Class A and suggest that you do with its stocks.
HOOD reached its all-time high on Sep 24, 2025 with the price of 2,373.00 MXN, and its all-time low was 138.00 MXN and was reached on Jun 16, 2022. View more price dynamics on HOOD chart.
See other stocks reaching their highest and lowest prices.
See other stocks reaching their highest and lowest prices.
HOOD stock is 3.57% volatile and has beta coefficient of 3.23. Track Robinhood Markets, Inc. Class A stock price on the chart and check out the list of the most volatile stocks — is Robinhood Markets, Inc. Class A there?
Today Robinhood Markets, Inc. Class A has the market capitalization of 2.27 T, it has increased by 12.32% over the last week.
Yes, you can track Robinhood Markets, Inc. Class A financials in yearly and quarterly reports right on TradingView.
Robinhood Markets, Inc. Class A is going to release the next earnings report on Oct 29, 2025. Keep track of upcoming events with our Earnings Calendar.
HOOD earnings for the last quarter are 7.88 MXN per share, whereas the estimation was 5.75 MXN resulting in a 36.94% surprise. The estimated earnings for the next quarter are 8.86 MXN per share. See more details about Robinhood Markets, Inc. Class A earnings.
Robinhood Markets, Inc. Class A revenue for the last quarter amounts to 18.55 B MXN, despite the estimated figure of 17.16 B MXN. In the next quarter, revenue is expected to reach 21.20 B MXN.
HOOD net income for the last quarter is 7.24 B MXN, while the quarter before that showed 6.88 B MXN of net income which accounts for 5.19% change. Track more Robinhood Markets, Inc. Class A financial stats to get the full picture.
No, HOOD doesn't pay any dividends to its shareholders. But don't worry, we've prepared a list of high-dividend stocks for you.
As of Oct 2, 2025, the company has 2.3 K employees. See our rating of the largest employees — is Robinhood Markets, Inc. Class A on this list?
EBITDA measures a company's operating performance, its growth signifies an improvement in the efficiency of a company. Robinhood Markets, Inc. Class A EBITDA is 30.37 B MXN, and current EBITDA margin is 38.82%. See more stats in Robinhood Markets, Inc. Class A financial statements.
Like other stocks, HOOD shares are traded on stock exchanges, e.g. Nasdaq, Nyse, Euronext, and the easiest way to buy them is through an online stock broker. To do this, you need to open an account and follow a broker's procedures, then start trading. You can trade Robinhood Markets, Inc. Class A stock right from TradingView charts — choose your broker and connect to your account.
Investing in stocks requires a comprehensive research: you should carefully study all the available data, e.g. company's financials, related news, and its technical analysis. So Robinhood Markets, Inc. Class A technincal analysis shows the buy rating today, and its 1 week rating is strong buy. Since market conditions are prone to changes, it's worth looking a bit further into the future — according to the 1 month rating Robinhood Markets, Inc. Class A stock shows the buy signal. See more of Robinhood Markets, Inc. Class A technicals for a more comprehensive analysis.
If you're still not sure, try looking for inspiration in our curated watchlists.
If you're still not sure, try looking for inspiration in our curated watchlists.