QQQ Gobble, Yelp, Cluck, Purr, Cackle, Cutt, Keekee!Thanksgiving week has a strong statistical pattern & historically, Monday-Tuesday shows normal volatility (often a continuation of the prior trend), Wednesday is a half-day with very little volume (small bounces) & Friday (also a half-day) is choppy with fake moves, low conviction & slow
Thanksgiving week is bullish during uptrends & during downtrends these shallow bounces fizzle out
The bounce ahead of the holiday fizzles out due to low volume & lack of buyers
Week after Thanksgiving usually gives a big directional move & usually down, or a continuation of the current downtrend
The moves next week tend to lack power & any bounce is not a true reversal, but the week after Thanksgiving (2-6 December) is when the real move happens & could be the window for the drop towards $568 to $560
Funds don’t reposition aggressively on holiday weeks
Low liquidity prevents trend continuation
Big red moves require volume, which returns first week of December
Early December is historically one of the most volatile periods each year
So this add confidence to the timeline of the expected move lower
QQQ will likely bounce next week to $598-$605 then the drop into $560 between 2-6 December supported by the fact that QQQ is still well below its 20d/50d MAs & losing trend support
If you want to trade, keep to small bullish scalps only & avoid heavy puts short-term since low volume kills momentum
Key upside is likely capped to $599-$605
After Thanksgiving is the best window to enter puts because the directional moves become strong with clear downside targets of $575 to $570 to $562 to $560
Thanksgiving delays the big leg down, but does not cancel it; in fact, the small expected bounce sets up the sharp drop the following week
Trade ideas

QQQ The Road Not TakenA trend reversal requires a higher high, followed by a higher low that holds & a second higher high - it needs that staircase
Sell volume should decline on dips & buy volume should rise on bounces
QQQ did see rise in volume on the reclaim of the 50d MA & that leans bullish, but we need to see if that continues into Monday-Tuesday
The bounce off the October low above the POC to the VAH usually leads back inside the range again
The market is not trending as participants reset inventory
There is a no structural higher-high sequence
Higher timeframe moving averages (20d/50d) still overhead/flat
No major volume climax that signals accumulation
This is exactly what we’d expect in the middle of a range
The bounce off VAL is meaningful, but the strength of the reclaim hasn't printed a higher low & QQQ hasn't broken above VAH with acceptance
Price needs to break above the VAH & consolidate above it (not just wicks/intraday spikes) to cause a trend reversal
Actual acceptance above value
Calling it a reversal leads to chasing the top & misses shorting the strongest part of the move
Price is testing the 4H downtrend line for the 4th time & downtrend lines become stronger each time they’re respected, but the 4th-5th hit is also where they often break, so this is a real inflection point - price is now at the perfect point to fail
This is not yet a confirmed trend reversal
QQQ is in a transitional phase with a potential reversal setup, contingent on holding a very specific level
The recent rally pushed above the prior swing lower-highs & that’s the first requirement of a reversal; however, we do not yet have a higher low
The pullback after breaking above those highs hasn’t printed a clean, confirmed higher low & until that happens, no one can classify this as a trend reversal
This is early-stage reversal behavior, not confirmation
This chart has one single number that tells you everything, the upper red shelf of the volume profile (~$620)
If QQQ closes above it & accepts, the trend reversal is active
If QQQ rejects it & slips back under the 50d MA
QQQ is at the doorstep of a trend reversal
Whenever 2 anchored VWAPs converge, it almost always precedes a breakout if buyers win the retest, or a rejection and full revisit of lows if sellers win
The 10 October AVWAP acted as resistance during the entire decline & is a “memory line” for sellers
QQQ just pressed into it again, but hasn't cleanly reclaimed it
The 21 November AVWAP is rising, respected & acting as support on the last two pullbacks, which is constructive
Momentum is supportive, not conclusive
RSI broke its own downtrend line, but hasn’t made a structural higher high & is sitting right under the midline resistance zone
Stochastic fast %K turned sharply upward, is overbought, but in emerging trends this stays overbought
It's not yet rolling over, so buyers still have short-term momentum
Volume on the bounce is higher than the prior 2 declining sessions which supported the reclaim of the short-term VWAP, not capitulation volume, but does not need to be for a structural inflection
The absence of heavy sell volume after tagging the 10 October VWAP is noteworthy
That VWAP usually triggers a strong sell reaction, but this time it didn’t
QQQ is directly between long-term sellers (10 October AVWAP) & newly established buyers (21 November AVWAP)
That’s how reversals start, but also how traps form
This is a decision point, not a trend
QQQ is right up against the boundary that will define the next 2 weeks
A break and close above 10 October AVWAP signals sellers are done
A break above $612-$614 (prior swing high) confirms structural reversal (higher high)
A retest 10 October AVWAP, hold, then push higher is the “acceptance” signal
Above that, bulls have full control and this becomes a trend reversal
Look for a sharp rejection off 10 October AVWAP, it's a classic continuation down move
Lose 21 November AVWAP on a close & this would confirm the bounce was just rotational
Break below $588-$590 kills the higher-low structure that is forming
Based on the 4H chart, it slightly favors the bullish side as of now because buyers are defending their AVWAP with real activity, sellers failed to slam price at the first test of their AVWAP, momentum flipped from negative to neutral-bullish & price is curling upward into resistance with higher lows, but a failure at the 10 October AVWAP turns this into an immediate downside rotation
If AVWAP breaks, entry on acceptance above 10 October AVWAP with a stop under 21 November AVWAP for a target back to $620 & maybe $628 (range highs)
If rejection triggers, short the rejection wick off 10 October AVWAP with a stop above AVWAP for a target $596 to $590 & maybe $583
It's a holiday week ahead of Thanksgiving & that context matters a lot for how you read every signal on your charts right now because holiday-week flows around Thanksgiving have very specific, repeatable market behaviors that can completely distort what looks like a trend reversal or breakdown
Liquidity is fake or thin & signals look stronger
Market depth is shallow
High-frequency participants step back
Dealers provide less size
Futures markets lead cash markets
Volume shrinks, but ranges don’t necessarily shrink
This creates exaggerated up-moves
A small amount of buying can march price up through multiple levels.
Exaggerated down-moves
A single aggressive seller or macro hedge can flush price 1-2% with no real follow-through
Neither is “real” since it’s the effect of thin books
So those VWAP interactions, those higher low attempts & even that 50d reclaim are all valid structurally, but they’re not confirmed until we see them in normal liquidity
This is why the reversal/rotation distinction is fuzzy
The market isn’t trading at full signal strength
Thanksgiving week historically favors upside drift
Indices tend to float upward into the holiday as funds dress books, shorts de-risk & dealers maintain positive gamma
No new major economic releases
No new institutional rebalance flows
This is not a “trend reversal” - it’s mechanical upward drift
QQQ fits this perfectly
A bounce off value
Grind up toward overhead VWAP resistance
Momentum oscillators improving
Volume profile resistance approached, not broken
This is classic pre-holiday digestion
The real test comes the week after Thanksgiving
The key levels (especially those anchored VWAPs) almost never resolve during this week
The real outcome shows up when liquidity returns, funds resume normal size, post-holiday rebalance flows hit, options positioning resets & macro traders put risk back on
If the breakout is real then it confirms next week
If it was fake then it rejects hard early next week
That’s why this week often produces false starts
Price is moving, but the information value is low - the moves are real, but the signal is not

AI Bubble? Or Risk of a Flash Crash.New Technology that is used too soon and or improperly used before it is fully tested and regulated is, historically, the cause of every prior Flash Crash.
Flash Crashes are not just on the 3 major indexes but also occur on individual stocks, Stock Derivatives, Sectors, and Industries.
New Technology Bubbles form at the END of a Long Term Great Bull Market.
This bull market is only 2+ years old and the technical patterns confirm: there is no bubble.
There is uncertainty, misuse of AI, AI mistakes and errors in analysis, AI misinterpretations, and AI making up an answer when it can't find data on that topic.
The sideways trend that the indexes and many stocks are in right now is a short term to intermediate term correction that is quickly patterning out any excessive speculation.
At this time speculation and gambling mode trading by retail groups and smaller funds managers has evporated.
The sideways trend is common. The stock market of today trends sideways more often than uptrending or downtrending.

QQQ Mean-ReversionEvery time QQQ reached the lower Bollinger band, a mean-reversion bounce followed this year
When price tags the lower band & doesn’t expand downward, it means the selling is losing momentum
The 20d MA is near $605 & the nearest magnet after a lower band tag
Price almost always returns to the middle band unless there is a trend breakdown (not yet the case)
There is a volatility expansion event (NVDA earnings maybe)
As of now, the bands aren't expanding, but stable, which means the chart favors mean-reversion rather than breakdown
The upper Bollinger band is near $620-$625 & aligns with the 10 October AVWAP & the 4H resistance around $617 & is the maximum price target if the bounce extends above the 20d MA
A bounce to $605-$610 isn’t just possible - it’s expected
Price almost always returns to the mean; unless, the trend breaks
Price still above the September/October high-low structure
The probability favors a bounce to $605-$610
Only one thing invalidates the mean-reversion bounce - A full body daily close below the lower Bollinger band which signals volatility expansion, trend transition & momentum breakdown

November 24 - November 28 2025I have recently identified an area of weakness in my trading style. Too often I find myself front-running trades by setting my bias based on where I think my Macro indicators are headed vs where they are positioned currently. Macro moves much slower than equities, so I should instead be looking for volatility setups that align with the current macro bias, and wait for confirmation. No longer should I try to catch the bottom or top, and instead should try to “ride the wave” as a surfer would, with the best entry being an inefficiency while the move is already underway. As a result, I think these Ideas should contain less speculative commentary and instead be more of a snapshot of where things are at heading into the new week, and for my bias to only shift when changes have already presented themselves.
1. Macro
Here, I want to make the point of what time of regime the market is currently in. The financial media is trying to spin the recent sell off as due to inflationary fears and suggestions that the AI bubble has burst. The latter point is debatable so I will not digress into that topic here, however based on what I am seeing, the inflation argument is the opposite of what the evidence shows, and instead the market is seeing lower inflation/growth, sparking fears (for now) that AI stock bets are misaligned with current macroeconomic factors, especially considering that political and trade turbulence that caused the Q1 crash are still present.
Right now, what is important to take away from this is that the dollar is catching a FX bid but is not rallying as it would if institutions were seeking it as a “safe haven”. The same can be said for TVC:GOLD , where rising real yields and falling inflation expectations have kept it flat. The hedge is still there but the buyers and sellers are currently in balance at this price level. $MOVE/VIX and the individual charts show what we already know: equities and bonds have been volatile, but equities significantly more as a proportion to the former. Next, the TVC:US10 and $US10/DXY provide further confirmation that treasuries are not seeing a “safe haven” rally either. TVC:US02Y fell at the end of last week and while the 5Y real yield ( TVC:US05Y -T5YIE) is above average, it will be important to see if it continues to weaken or will goes on to make higher highs, as it will set the tone for the rest of the Macro regime.
Going back to my point about falling inflation expectations being the underlying cause of what is pushing up real yields, the 5Y breakeven chart FRED:T5YIE shows that the downtrend in inflation expectations that began 10/31 has coincided with volatility pressure.
My commodity index (avg of corn, cotton, copper, and aluminum vs DXY) and NYMEX:CL1! also contradict the argument that inflation is making a comeback. Falling commodities i this environment provides further confirmation that growth is stalling.
My current assessment is that the market is risk-off, but the risk aversion is concentrated in equities due to growth concerns. While rate cuts can help boost growth, the rate cut-bet is not what is driving the market. The market needs evidence that growth is increasing in order to snap out of its rut.
2. FX
On FX based on what I currently see (no speculation), the market is risk-off - so the market is seeking safety/liquidity. TVC:DXY has outperformed the other currency indices this month, while US 2Y bond yields are moving lower compared to other “funding” countries. This signals that USD is in fact acting as a safe-haven and the market is expecting lower rates in the US in the future.
The way I’m seeing this tie back into Macro is that the market is expecting lower nominal yields in the near future and is seeking liquidity in USD. The Fed will likely cut into lower growth, but the market will still be risk-averse if falling growth/inflation outpaces falling nominal yields (which could cause real yields FRED:DFII10 to continue rising).
3.Risk
Not much to add here. Pressure continues in private-credit, which is high-risk and highly leveraged. This is definitely a driver of the sell off which does not make the headlines often. IMO private credit could one day act as a major accelerator for market turmoil if bankruptcies are increasing. With rates set to come down and growth declining, this could push private credit to seek higher yields from even riskier bets. $XLK/XLP illustrates the risk-off activity we have been seeing.
4. Bias
Since I’m trying to focus these Ideas on Macro and FX analysis, I’ll have more to say about my short-term analysis in Minds. What I am seeing here on the CME_MINI:NQ1! 1h Renko chart with monthly VWAP overlaid is that the market is very weak in November, as we already know. This pattern seems reminiscent of December 2024. With the Macro picture looking so bad for growth, I think a rise back to ATH would require a major VIX compression.
+-+-+-+-+-+-+-+-+-+-+-+-+-+-+-+-+-+-+
Conclusion: It is important to understand what is driving sentiment in the market, and what I have outlined here shows that it is not rising inflation, as some would like to make us believe. Instead, we should expect weak growth to continue and the Fed to cut interest rates to drive up demand. This creates poor conditions for high-growth bets on tech/AI, especially if disinflation outpaces nominal yields falling. If the Macro/FX/Credit structure stays the same this week, I will only treat daily short-volatility (bullish) positioning to be part of a larger reversion higher (temporary). Long volatility (bearish) days that align with current macro conditions (also bearish for equities), will provide the most profitable trading opportunities.

QQQ Momentum Play: QuantSignals V3 Sees Sharp DownsideQQQ | QuantSignals Katy 1M Prediction (2025-11-21)
Current Price: $595.17
Predicted Close: $582.79 (-2.08%)
30-min Target: $584.69 (-1.76%)
Trend: Bearish
Confidence: 73.9%
Volatility: 16.8%
Trade Signal
Direction: PUT (SHORT)
Entry: $595.17
Target: $585.26
Stop Loss: $604.10
Expected Move: -2.08%
Summary: 1 trade signal generated from 1 successful analysis.
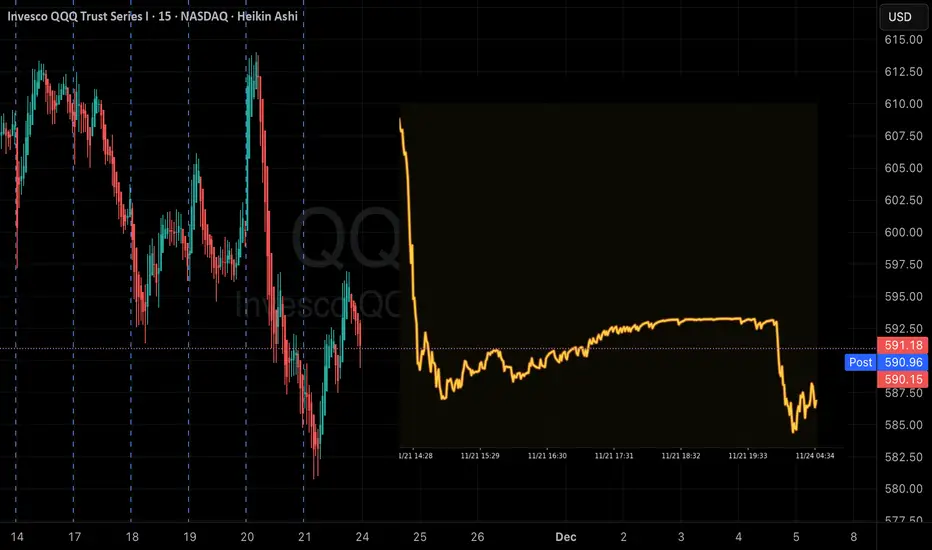
QQQ Liquidation FlushToday was a liquidation flush & the opening price action wasn’t a bounce attempt, since it largely occurred after-hours rather than during regular trading hours
• The failed push was simply a backtest of broken intraday moving averages & not the bounce to the 20d MA that's expected, but today's drop sets the stage now
• The bounce was initially expected from the level that price hit today (~$583)
• The market needed this flush to generate real bounce conditions, so the bounce expectation remains because the real signal just fired
The daily Bollinger band breakdown has a very high mean reversion probability
• When QQQ closes a full red candle outside the lower Bollinger band, a reflex bounce occurs within 1-2 sessions almost ~85% of the time & today was the breakdown day
• The bounce almost never happens on the breakdown candle, but comes immediately after, so we're on schedule
Intraday indicators didn’t actually show bounce conditions until the last hour
• 15m Stoch is curled up after the close
• 1H RSI at ~32
• 1H candle bodies are extended from 1H 20 MA by 3%
• 4H Stoch is basically 0
These are the conditions that produce the bounce
• We now have oversold momentum, a completed flush, a proper lower band break, a perfect touch of the 100d MA, capitulation volume & structure completion (wave a likely ended today)
Today wasn’t the bounce, but the setup, so the expected bounce remains to $603-$612 with a high probability of hitting it before the next major leg lower
• Now to 27 November 27 into 3 December (NEVER SHORT A DULL TAPE - Thanksgiving week)
• 3 December to 20 December (tax-loss selling & liquidity pockets produce the broader correction)
• Final low into mid-late December, then a strong Q1'26 rebound
Monthly is overbought & starting macro reversal
⬇
Weekly's momentum turning into a multi-week correction
⬇
Daily lost 20d MA & Bollinger breakdown signals trend shift
⬇
4H/1H VWAP resistance & declining MAs suggests bounces will fail
⬇
Intraday completed wave a flush into first support so everything is aligned & nothing contradicts anything else
Short-term (next 5-10 days)
• 70% probability
• Bounce to $603-$612
• Rejection
• Move down into $555-$570
• Within 1-3 days
• Late November into early December
Today wasn’t the bounce, but the flush into the bounce
• After-hours price action (around $583-$585) hit the exact lower Bollinger band, so that is where bounces begin, not where they end
• If QQQ opens anywhere above $585 tomorrow, your upside window is bounce target = $603 to $612 (these are the 1H/4H resistance & the 20d MA retest) creates a clean 3-5% snap which is perfect for short-term calls
• Invalidated if QQQ closes below $580-$583
• Calls are a good idea for a bounce, not a swing with an expiry 6 December & strikes $600, $605 & $610 for an expected peak before rejection anywhere from $603-$612, but don't overstay
After the bounce, the most straightforward option place is directions with puts
• $580 strike with an expiry 20 December (monthly) because $580 is right inside the target area of $555-$570 so gives room for theta decay since the expected decline is expected to last 2-3 weeks
• Avoids weekly expiries that get crushed by time decay
• You get IV expansion as price drops
A higher risk/reward strategy is a put spread if you want defined risk & better capital efficiency, so buy a $590 put & sell a $560 put with a 20 December expiry
• $590 is the current breakdown level
• $560 is the projected low of wave c
• Profit if QQQ lands anywhere ≤$560 into December OPEX
• Captures maximum value if $555-$570 target hits
An ultra safe hedge with less stress is $600 puts with a 16 January expiry (monthly)
• This one is for lower IV entry, more time for the correction to fully complete & survives a bigger bounce (even if it pushes to $612-$616)
$580P 20 December expiry is the best match for the projected correction's timing & target
(IF QQQ CLOSES BELOW $580, THIS INVALIDATES THE EXPECTED BOUNCE & THE CORRECTION BEGINS IMMEDIATELY)

QQQ bullish then bearish?i think were in a topping proccess somthing to watch out for we are already seeing the reasons to be bullish evaporate i think we could possibly take out the high but the aftermath will be brutal! wdy think??

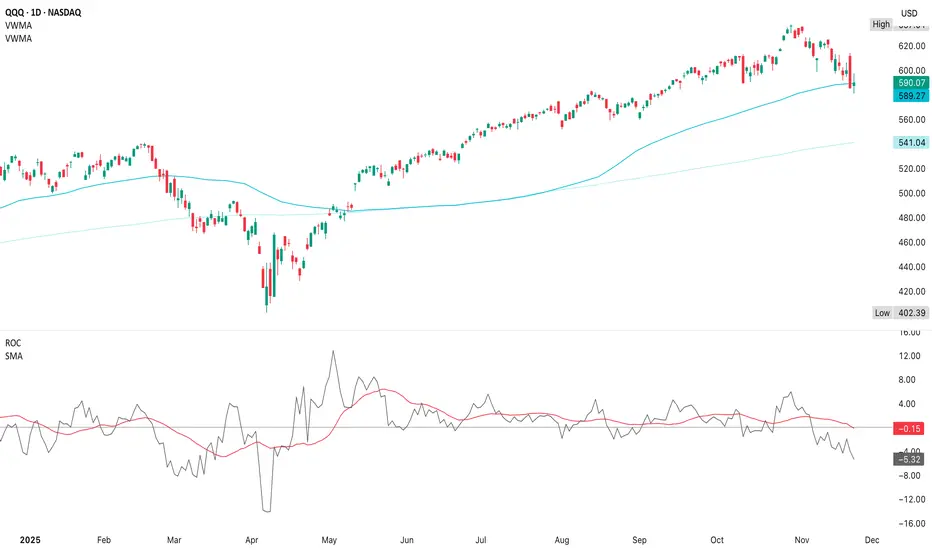
QQQ (21 November)VWMA is like an EMA, but weighted by volume, so it tells you what price the heavy money is actually paying & it exposes trend shifts earlier than simple moving averages
The 20d VWMA is curling down which shows that the short-term trend has firmly turned bearish
This downturn began well before the breakdown
The 50d VWMA is flattening, slightly bending down so the medium-term trend is now losing momentum
When 20d crosses below 50d VWMA (if it happens), that’s a trend-change confirmation
This aligns with the multi-timeframe weakness in stochastics rolling over on daily & 4H & RSI making lower highs
ROC is trending below its signal line which signals that this isn’t just a dip, but that momentum is deteriorating across multiple layers
ROC is extremely useful for measuring acceleration; rather than, direction
ROC has been trending under the signal line for about 2 weeks & is now below zero, indicating negative momentum
No bullish divergence appears yet (price lows not rising vs ROC lows rising)
The ROC signal line is sloping down which signals sustained weakness
There are only 2 reasons for VROC to spike this hard (unusual ahead of Thanksgiving) & spikes above 100% only occur near major turning points, both tops & bottoms
Capitulation into a low
Institutional rotation before another leg lower
This is the opposite of a bottoming structure
Current ROC behavior matches early-cycle pullback phases from February 2020, September 2021, April 2022 & March 2024
Each of these periods saw a continued drift lower, lower highs on oscillators & price returning to mid-range support levels
Looking at earlier timeframes, initial support is $586-$589
$573-$576 is highly probable if the oversold bounce fails
$558-$563 is weekly support & $540-$545 is less likely, but possible in a deeper correction (50wk MA)
Given VWMA downtrend & ROC weakness, the path of least resistance is still down to the $573-$576 or $560 area unless a catalyst interrupts the selling
Historically, when ROC breaks below zero & VWMA is rolling over, the pullback usually extends 2-4 weeks
Price tends to form a lower low or retest the first low before recovering
Bounce attempts during this period are weak (exactly what we saw this week)
Thanksgiving week usually has lighter volume that contribute to false moves & NFP data the following week is a a major event into the December FOMC, so expect a weak bounce ($598-$605) in the next 3-5 trading days with a pullback lower into early/mid December
The true reversal likely only after a vol spike & ROC divergence
This is not yet bottoming behavior, momentum is declining, the short-term bounce attempts are corrective, not impulsive, so the next logical destination remains $573-$576 & then $560
Price may push higher to $605-$612 which means we see a sharper sell-off in December
Until ROC flattens, ROC offers a bullish divergence, price reclaims 20d VWMA & stoch/RSI turn up on the daily, QQQ is still in the middle of a corrective leg down; instead of a real, tradable reversal
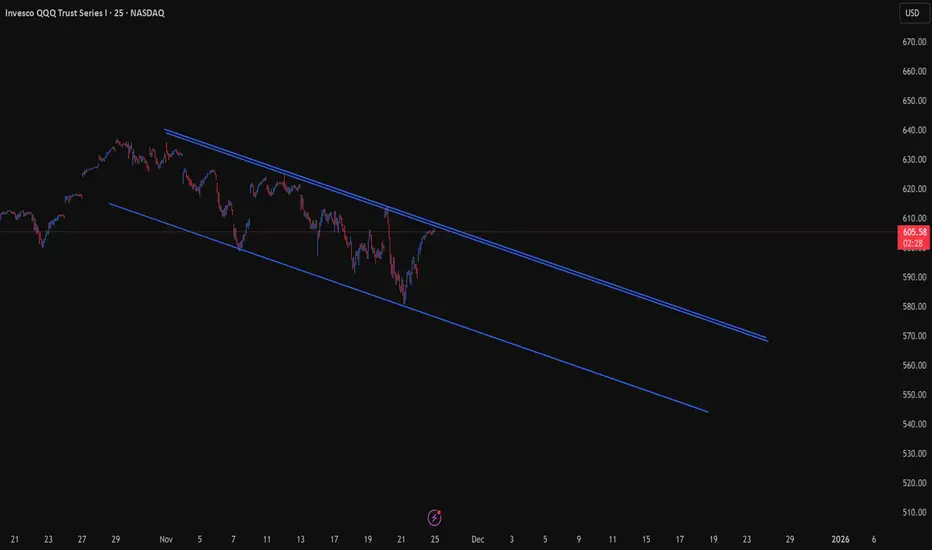
The Geometry of the Week: QQQ Inside the Declining ChannelThis week’s market map centers on a single dominant structure —
a perfect declining parallel channel guiding QQQ through the entire November decline.
Price is now rallying back into the upper rail, the same geometric boundary that rejected every advance this month.
This rail rises at a 1×2 natural angle, meaning:
1 trading day = $2 of vertical movement
A classic slope in fast corrective markets.
1. What Must Happen for the Market to Rise
For QQQ to reclaim strength and retest the November highs, one condition must be met:
QQQ needs a daily close above the upper rail of the declining channel.
Nothing less.
This angle is the gatekeeper.
Without a close above, upside follow-through is limited.
And if price rejects off the trendline?
→ The geometry remains intact
→ The downtrend holds
→ Lower prices become the natural next step
In geometric markets, rejection at the angle is the signal.
2. Compass Reading for the Week
Primary Trend: Down
Secondary Move: Counter-trend rally
Market Location: Testing upper rail resistance
Key Zone: 606-608
Bias: Watch for daily close above or rejection at the angle.
Market Knots Reading — Bull vs. Bear Bias
🔵 Bullish Bias
What the bulls can build a case from:
1. Acceleration is Positive
Acceleration has flipped above zero and is holding there.
This is the earliest sign of internal energy returning.
→ Trend force is rising
→ Short-term conditions favor continuation upward.
2. Speed Is Rising From the Lows
Speed has made a clear higher low and is now climbing toward the mid-range.
→ The market is gaining internal velocity
→ Bulls are defending the short-term structure
3. Price Is Rising Cleanly Within the Channel
On the 50-min view, price is stair-stepping upward and respecting short-term support.
→ Short-term bias: Up
Bull Case Summary:
Acceleration > 0 + rising Speed =
Bulls have the initiative going into the next rail test.
🔴 Bearish Bias
What the bears can counter with:
1. Speed Still Below the October Highs
Even at 125, Speed is far below the momentum peaks seen earlier.
→ The current rally remains weaker than the prior thrusts
→ Internal strength is not matching price strength
2. Rising Into a Major Structure
Price is pushing directly into the upper parallel rail.
→ This is where rallies have consistently failed
→ Bears control the geometry, even if bulls control the short-term motion
3. Acceleration Is Positive But Weak
Acceleration is above zero but not expanding aggressively.
→ This is not “trend breakout” force
→ It’s counter-trend lift inside a broader downtrend
Bear Case Summary:
Speed < November peaks + Weak Acceleration =
Rally may exhaust at the upper rail and fail.
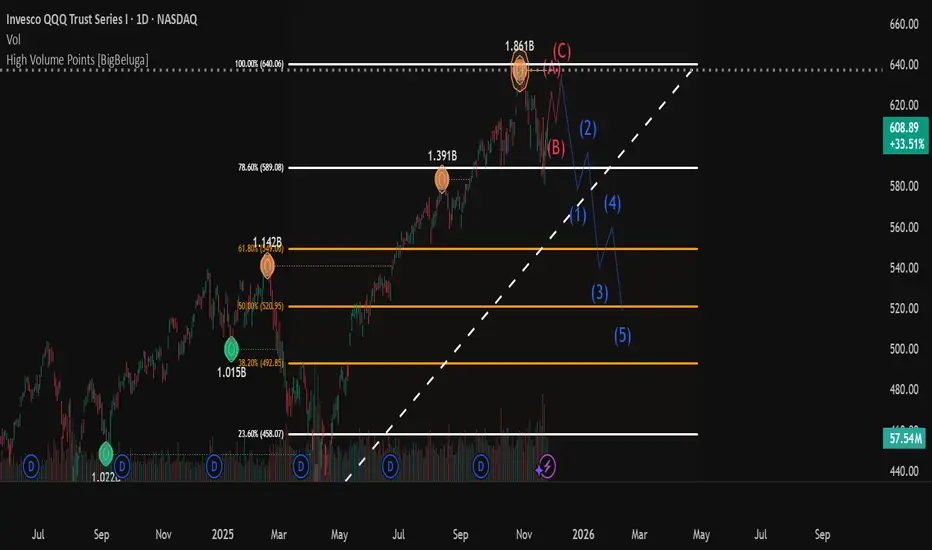
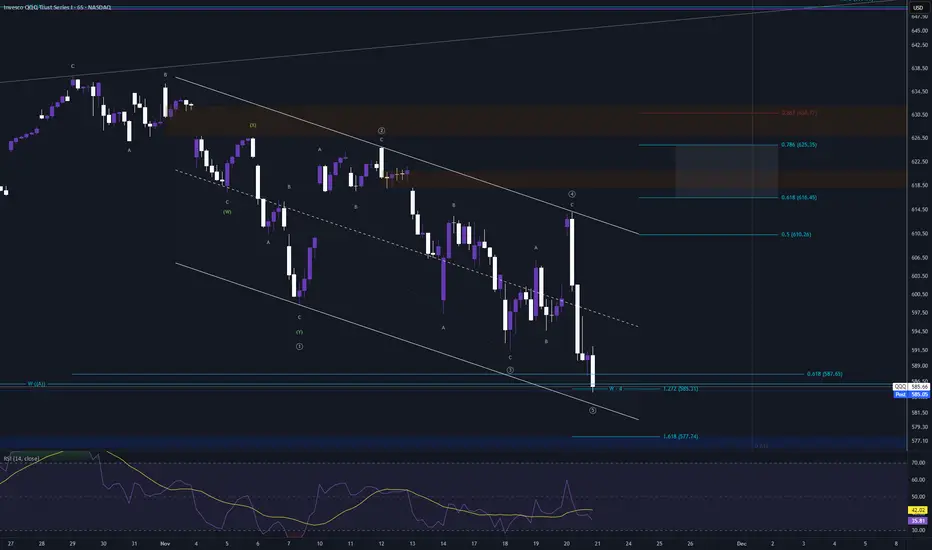
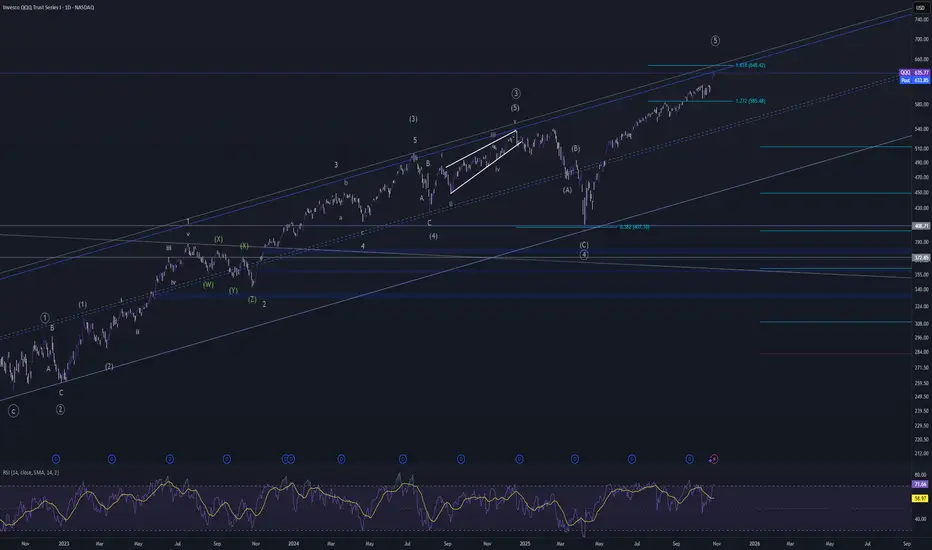
QQQ Bearish Path (Preferred unless $614 breaks)There are 2 competing (4) scenarios
1. (4) Already Bottomed at ~$586
The market tagged the 78.6% retrace (~$586.8)
Price immediately launched into a strong impulsive rebound
Volume confirmed it was real demand, not just a short-cover spike
20d MA is now being tested (~$614)
If reclaimed, this is a strong confirmation of Wave (5) beginning
This would project Wave (5) toward the 123.6–138.2% extensions or a price of (~$692-$726)
2. (4) Extends Lower Toward ~$560
Retest of trendline from 2024 lows
Major structural support ($555-$565)
This scenario remains valid unless QQQ closes above $614 (20d MA) & then holds above $596 on a retest
If that happens, the deeper Wave (4) becomes much less likely
(4) may already be completed because the bounce off $586 was fast, impulsive & clean
QQQ reclaimed short-term moving averages with a steep angle
RSI & Stoch made strong bullish divergences at the low
This behavior is more typical of the end of a Wave (4) correction than of a mid-cycle pullback
If QQQ rejects $614, fails to break $620, price drops & breaks $589 & especially breaks $586, then the deeper (4) target at $558-$565 becomes the primary path
That level coincides with 50% retracement of the entire Wave 3, anchored VWAP from the April low & major volume shelf
Both are valid, but market structure currently favors the upper (4) unless broken

Weekly QQQ (NQ-US100) Outlook - Prediction (23 NOV)Weekly QQQ (NQ-US100) Outlook - Prediction
📊 Market Sentiment
Market sentiment is driven by fear at the moment. In my opinion, we are trading inside a bearish zone. Unless we get meaningful data or positive news, I expect the market to continue declining. Core PPI will be released on Tuesday at 08:30, which could create a minor bullish reaction; however, I personally do not think this will shift the overall sentiment. PPI is not a strong catalyst for a major sentiment change, so bearish conditions are likely to remain in play.
📈 Technical Analysis
Price ran the 613 level strongly and reversed aggressively on Thursday after NVDA earnings. This move trapped the bulls and filled institutional put positions. As I mentioned on Thursday evening, a weak bounce was possible and that is exactly what occurred.
📌 Outlook – Prediction
Scenario 1 (Bearish Scenario):
I believe this scenario is more likely to play out. I expect price to retrace toward 559. If we see strong bullish momentum on Monday, I will likely become more cautious with my puts.
Scenario 2 (Bullish Scenario):
If price shows strong momentum on Monday and reprices toward 614, then I will consider buying calls around 606, targeting all-time highs afterward.
Follow me for daily SPY–QQQ updates. I will update the idea based on evolving price action.
💬 For detailed insights and broader market context, please check my Substack link in profile.
⚠️ For educational purposes only. This is not financial advice.

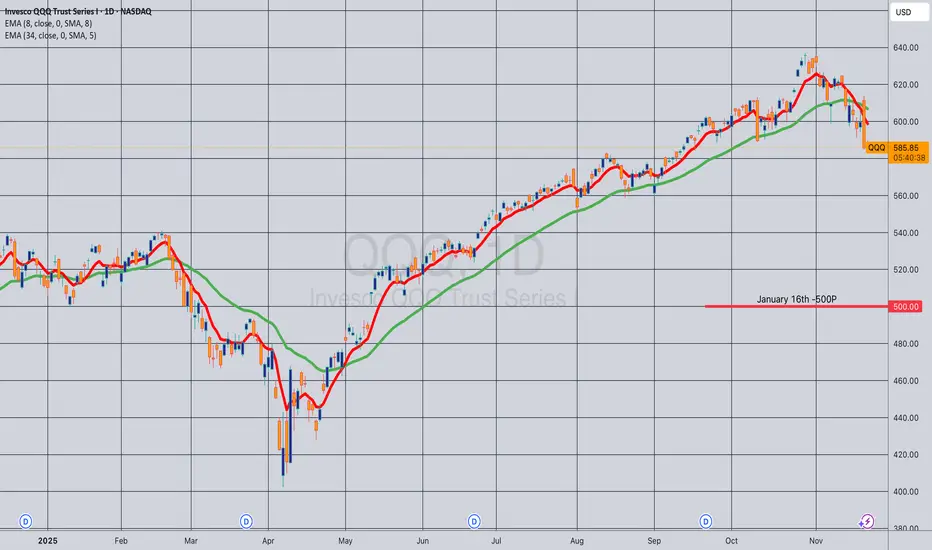
Opening (IRA): QQQ January 16th -500P... for a 5.22 credit.
Comments: My SPY position is becoming somewhat of a spaghetti works, so opting to open a run in the Q's instead, targeting the strike paying around 1% of the strike price in credit.
Will look to add/ladder out at intervals, assuming I can get in at strikes better than what I currently have on.
QQQ ATH in for awhileIn a related posted, looked at ATH on Oct 29th. That has held so far. Now looking at the next phase. It looks like we have a 3-3-3-3-3 leading diagonal.
I'm looking for a pop anywhere from 610 to 625, maybe get the first bear gap, maybe both? It depends on how the first pullback My assumption is 616 at least, gives bulls a breakout, potential retest, then drop from there. Possibly test the bear gap at 626.
Marking this as a short for beginning of Dec after.
How the next couple weeks go!
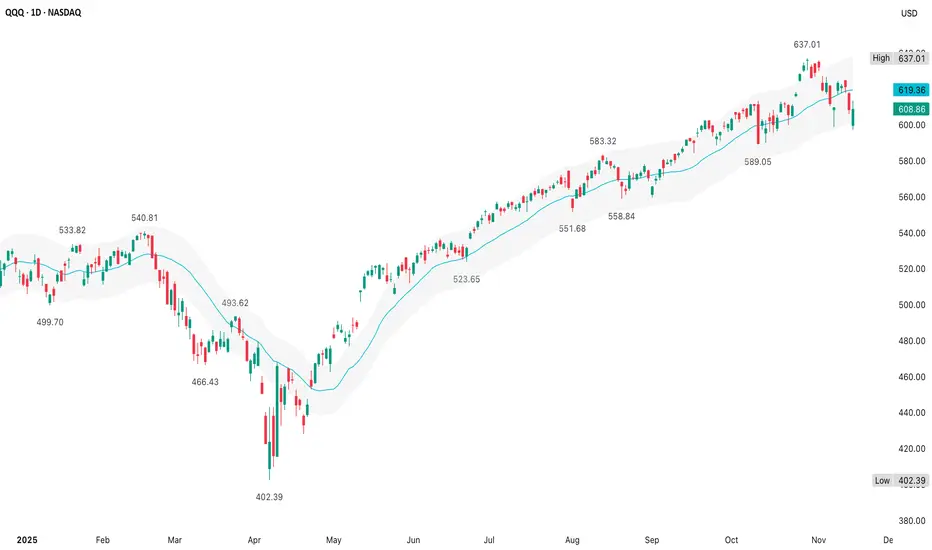
QQQ (14 November)The +/- 3% envelope with the 20d MA works well for mean-reversion strategies since it clearly shows inflection points where price may snap back toward the average
How far is price from its 20d MA & is price near extremes of the 3% bands?
Bollinger Bands adjust dynamically with volatility
Price rarely lives beyond ±3% of the 20d MA for long
Bias is short when the 20d MA is falling & price is above the upper band
Bias is long when the 20d MA is rising & price is below the lower band
After the April low at $402.39, the 20d MA's slope turned positive
In strong uptrends, price stays between the 20d MA & the upper band & occasionally tags the upper band (June to October)
In strong downtrends, price stays between the 20d MA & the lower band & occasionally tags the lower band
QQQ followed a solid trend from April to November's $637 high
This marked a high probability risk of mean-reversion
When QQQ hit the low around $588-$589, the 20d MA was still up around ~$610
So we see a mirror-image on the downside stretch where the upside pushed beyond +3% & then a downside break beyond −3%, which is the kind of behavior that occurs when a strong trend finally exhausts - then corrects hard
The move from ~$615-$637 was extended, so a good place to stop chasing longs
The move from ~$615-$588 was also extended, so a good place to stop chasing shorts & expect a bounce back toward the 20d MA, which is exactly what's happening when QQQ bounced back toward ~$615
However, the current bounce is weak & is stretched relative to the bounce (+3.5% above the 20d MA, then −3.5% below the 20d MA, then back toward the 20d MA) - it's a full snap from upper to lower band & now a mean-reversion toward the 20d MA
Either price reclaims the upper half of the channel & the trend resumes, or the 20d MA continues to rollover & any rallies the 20d MA/upper band are short entries which signals a trend change
The odds of another big push back to $637 without a reset are now lower & it's possible the trend now shifts from strong uptrend to corrective/trend down
Price rebounded from below the lower band back near the 20d MA, but rallies from the lower band back to the 20d MA are often short entries, not buy-the-dip opportunities
This lines up with a $620 fail thesis
Treat rallies back toward the 20d MA/upper band as suspect unless the 20d MA turns decisively higher again
If the 20d MA rolls over & price fails near $620, QQQ's near-term direction has changed from an uptrend to a downtrend
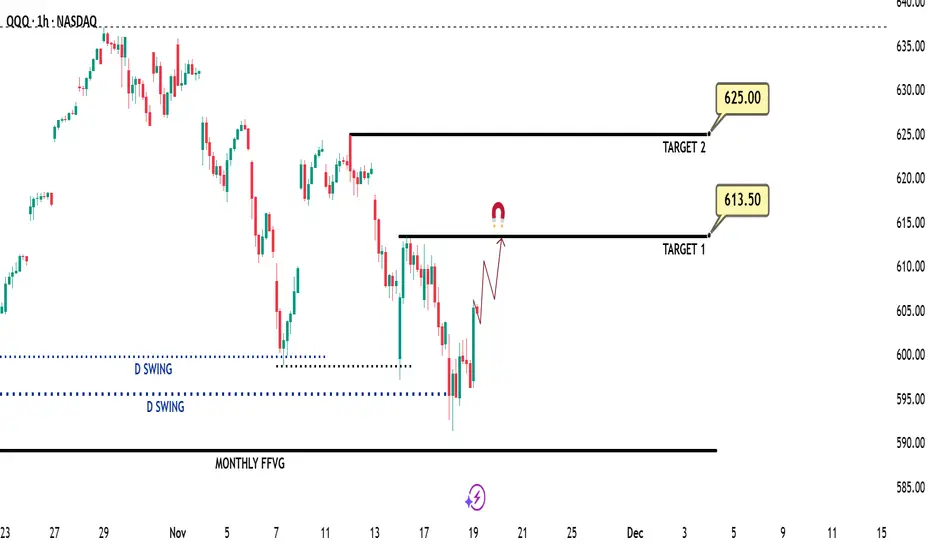
Daily QQQ (US100-NQ) Outlook - Prediction (19 NOV)Daily QQQ (US100-NQ) Outlook - Prediction (19 NOV)
📊 Market Sentiment
Market sentiment appears bearish right now, in my opinion. The FED may pause rate cuts in December, which has contributed to recent selling pressure and possible hedging flows. However, with the U.S. government reopening last week, we will begin receiving updated economic data again. If employment data weakens and CPI comes in low or stable, it could trigger renewed bullish momentum.
NVDA earnings will be released today after market close. If NVDA beats expectations, this could trigger an impulsive bullish move for both QQQ and SPY. If earnings miss, that may create strong bearish sentiment across the market.
📈 Technical Analysis
Price tapped the 595.5 level and bounced cleanly from there. A strong bullish candle close has appeared on NQ, indicating solid upward momentum for the day.
📌 Game Plan – Prediction
I am buying calls targeting 613.5 first. I will also keep a runner for a potential move toward 625 in case NVDA reports strong earnings. That could generate significant bullish momentum, potentially pushing price toward new all-time highs. My runner is positioned for that potential after hours continuation.
💬For detailed insights and broader market context, please check my Substack link in profile.
⚠️ For educational purposes only. This is not financial advice.
QQQ finally topping out?Getting near the top of the channel since 2022. The 161.8% extension of the drop down to April is right above today's high as well. Market is overbought with bearish divergence on the daily, weekly, and monthly. Maybe 1 more high???
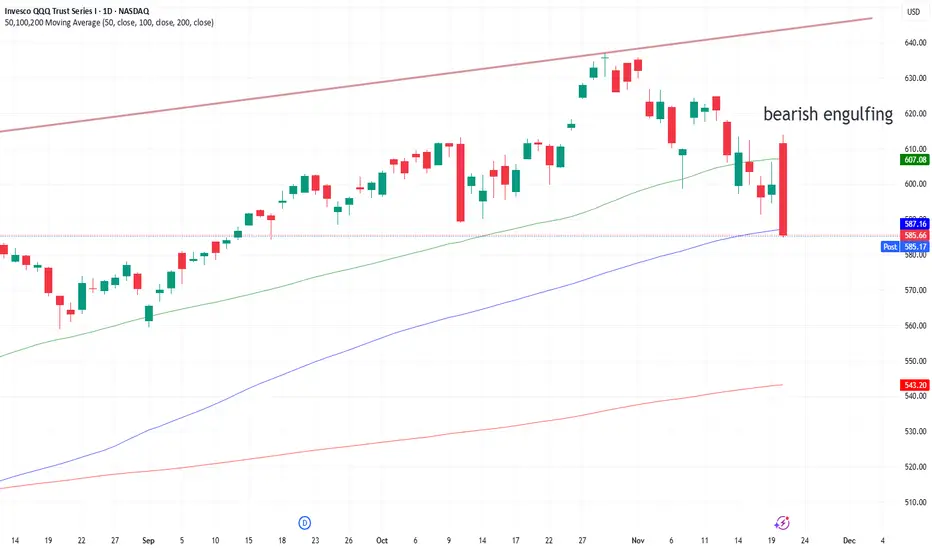
QQQ bearish engulfing with close below 100 DMAThere should be continued follow-through on the sell-off from this level. $540 is a support level from Pre-April 2025 highs.
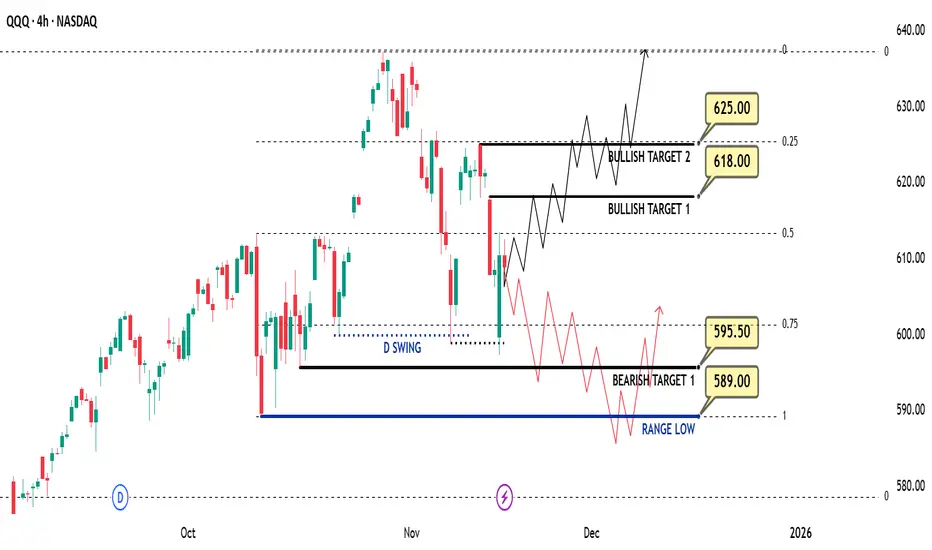
Weekly QQQ (US100-NQ) Outlook - Prediction (16 NOV)Weekly QQQ (US100-NQ) Outlook - Prediction (16 NOV)
📊 Market Sentiment
Market sentiment appears bearish right now, in my opinion. The FED may pause rate cuts in December, which has contributed to recent selling pressure and possible hedging flows. However, with the U.S. government reopening last week, we will start receiving updated economic data again. If employment data weakens and CPI comes in low or stable, it could trigger a renewed bullish momentum.
NVDA will report earnings this Wednesday after market close. I will be watching closely in my view, if NVDA were to miss expectations, QQQ and SPY could see a strong retracement. However, I think this is unlikely. I expect solid earnings growth and believe the AI cycle continues to support upside.
Additionally, U.S. Treasury Secretary Scott Bessent stated that the Trump administration aims to finalize its trade agreement with China by Thanksgiving (November 27). This could add further bullish sentiment to the market.
📈 Technical Analysis
The market showed a strong bounce on Friday after tapping the 599 level. RSI has also reset, meaning price is no longer overbought. We remain inside the weekly range, and price has reached the 0.75 max discount zone for the second time.
📌 Game Plan – Prediction
Bullish Scenario (Black Line):
I think this scenario is more likely. I want to see price close a 4H candle above 613. If that happens, I will be targeting 618 next. Price may run 618, pull back slightly, then eventually push toward 625 and potentially all-time highs around 637.
Bearish Scenario (Red Line):
If we see strong selling on Monday, I will assume price may follow the bearish path. In that case, I expect a move toward 595.5 and then the range low at 589. From there, we could see a bounce and a reclaim of 595.5.
💬For detailed insights and broader market context, please check my Substack link in profile.
⚠️ For educational purposes only. This is not financial advice.
Market Condition, Trading Conditions and StrategiesHere are some important terms for traders to understand.
Market Condition refers to the overall long-term trend, where we are in the CYCLE of the Stock Market.
Trading Conditions are identified and traded by using the day over day and week over week trends and trendline patterns within that Cycle.
Strategies relate to a specific trading style based on the current Market Condition and the Trading Condition(s) within that particular Market Condition.
The Market is in a Moderately Uptrending Market Condition at this time. Trading conditions vary from sideways trends to Velocity runs, to minor corrections.
The market is choppy and sideways. Volatile markets have huge white and black candles that change abruptly from one day to the next based upon WHO IS CONTROLLING price.
In the sideways trend we’re experiencing now, different market participants are taking different actions:
Professional Traders are mostly trading to the upside.
There are also smaller funds managers with less than $3 billion in assets under management, aka Retail Side Asset Managers.
There are fewer retail investors and retail traders are mostly sidelined right now since they are worried.
There is some minor Dark Pool rotation to lower inventories of specific stocks in the NASDAQ 100 index, which impacts the QQQ ETF.
Understanding the dynamics of the Stock Market helps you trade with confidence, making decisions based on real market conditions instead of retail news—which is always late and often drives manipulative activity.

QuantSignals V3 | QQQ Short-Term Downside OpportunityQQQ QuantSignals V3 – 0DTE PUT Trade (2025-11-19)
Trade Signal:
Direction: BUY PUTS (Short)
Strike Price: $598.00
Entry Price: $0.04–$0.05 (mid $0.04)
Target 1: $0.08 (100% gain)
Target 2: $0.12 (200% gain)
Stop Loss: $0.02 (50% risk)
Expiry: 2025-11-19 (same-day)
Position Size: 2% of portfolio
Confidence: 68% (Medium)
Market Analysis:
Trend: Katy AI predicts bearish trajectory despite composite BUY CALL signal
Price Action: $602.62 declining toward $599.59 (-0.50%)
Technicals: RSI overbought at 87.1, EMA alignment bullish but multi-timeframe divergence bearish, VWAP support at $598.72
Options Flow: Put/Call Ratio 1.25, unusual activity at $603 put, max pain at $598
News Sentiment: Neutral; no strong directional catalysts
Volatility: High due to 0DTE time decay and overbought conditions
Competitive Edge:
Katy AI’s detailed prediction shows consistent short-term downside
Entry at max pain strike captures natural gravitational pull
Morning session entry (9:35–11:00 ET) aligns with predicted momentum fade
Tight stop loss mitigates extreme 0DTE gamma/time decay risk
Risk Notes:
High-risk trade due to 0DTE expiry
Monitor actively; close positions at target or stop without hesitation
RSI extreme overbought and high volume indicate potential reversal
QQQ rally to 700Chart is about as simple as can be. If the COVID rally can do it, then the AI rally can to.
