$RKT Elliott Wave Setup — Wave (3) of 5 LoadingNYSE:RKT
Elliott Wave Setup — Wave (3) of 5 Loading
Daily | $21.65
Count:
✅ (1) Complete — Nov
✅ (2) Complete — ABC to $17
🔄 (3) In Progress → $29-30
📍 (4) Projected → $23-24
🎯 (5) Terminal → $39.60
Levels:
❌ $17.00 — Invalidation
⚠️ $21.41 — Channel support
📍 $21.65 — Current (0.5 fib)
🔼 $24.88 —
Rocket Companies, Inc. Class A
No trades
Next report date
—
Report period
—
EPS estimate
—
Revenue estimate
—
1.70 MXN
612.35 M MXN
97.26 B MXN
841.42 M
About Rocket Companies, Inc.
Sector
Industry
CEO
Varun Krishna
Website
Headquarters
Detroit
Founded
1985
IPO date
Aug 6, 2020
Identifiers
3
ISIN US77311W1018
Rocket Cos., Inc. engages in the provision of a suite of services related to homeownership and other personal financial transactions. It operates through the following segments: Direct to Consumer and Partner Network. The Direct to Consumer segment consists of performance marketing and direct engagement through the Rocket Mortgage App. The Partner Network Segment focuses on partnerships with premier consumer-focused organizations, brokers and mortgage professionals who leverage the platform and scale to provide mortgage solutions to clients. The company was founded by Daniel Gilbert in 1985 and is headquartered in Detroit, MI.
Related stocks

$RKT to $25?Hello Traders!
NYSE:RKT Setting up for a nice breakout
Has support right underneath at about $20.60
I have my price target at equal highs at 24.50
Really steep trendline here and made a perfect pullback to the support at 20.60
This will definitely be on my watchlist the next few days!

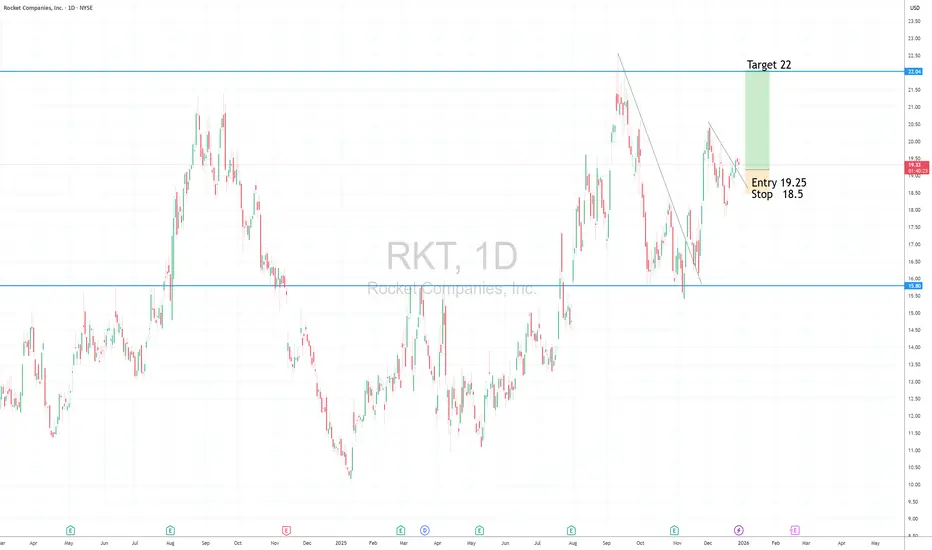
RKT Longtrendline break + retest
Long entry 19.25
Stop 18.5
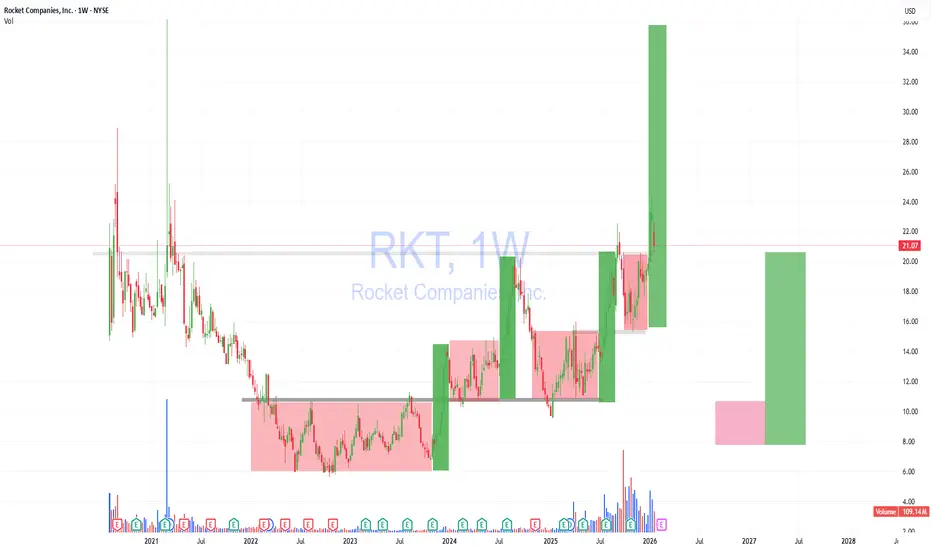
Target 22, 30(Weekly chart target)
Risk management is much more important than a good entry point.
I am not a PRO trader.
In my trading plan, the Max Risk of each short term trade should be less than 1% of an account.
RKT: What are you seeing?
RKT
.
Instead of overcomplicating technical analysis, the market is really just a few candlestick patterns like these.
.
US STOCKS- WALL STREET DREAM- LET'S THE MARKET SPEAK!
RKT Monthly Chart AnalysisCurrent Setup:
Price: $23.24 (+20.04% current month)
Testing critical resistance zone: $20.14-$21.47 (prior accumulation range acting as supply)
Clean breakout above multi-year consolidation base (~$10-$11 floor)
Technical Structure:
Bullish Case:
Fib retracement from 2021 highs shows price recla

8:23 AM RKT 15m Analysis8:23 AM
RKT 15m Analysis
Structure: Descending wedge/falling wedge after impulsive move up into supply zone (24.34). Classic continuation pattern forming within the prior bullish displacement.
Key Levels:
Supply: 24.34 (prior high, marked resistance)
Demand: 23.64 (green zone, unfilled FVG from t

RKT Daily Chart AnalysisCurrent Setup:
Price at $23.44, +3.40% on the session
Just broke above the "Premium" zone (~$23.44 horizontal) and tagged "Weak High" resistance
Pre-market showing $23.50
SMC Structure:
Multiple CHoCH (Change of Character) and BOS (Break of Structure) confirmations through 2025
Strong Low establi

RKT | Ascending Triangle Apex + $789K Options Flow = Breakout INYSE:RKT
Macro Structure (4H)
RKT has been compressing in an ascending triangle since mid-2025. We're now at the apex — a resolution is imminent.
Structure:
Higher lows: $8 → $14 → $16 → $22
Resistance: $25-26 (tested and rejected 3x)
Current: $23.45 (coiling at upper bound)
Rising trendline suppor

RKT Rocket Companies Options Ahead of EarningsIf you haven`t bought RKT before the previous earnings:
Now analyzing the options chain and the chart patterns of RKT Rocket Companies prior to the earnings report this week,
I would consider purchasing the 13usd strike price Calls with
an expiration date of 2026-1-16,
for a premium of approximate

RKT - Rocket Companies - $22.70 PTLooking at $22.70 Retest / Price Target for RKT based on the continued bullish movement and breaking through previous levels or resistance at the $19.78 Price Level. We need to confirm support above that level first before moving forward, which justifies the potential for consolidation on the lower

See all ideas
Summarizing what the indicators are suggesting.
Neutral
SellBuy
Strong sellStrong buy
Strong sellSellNeutralBuyStrong buy
Neutral
SellBuy
Strong sellStrong buy
Strong sellSellNeutralBuyStrong buy
Neutral
SellBuy
Strong sellStrong buy
Strong sellSellNeutralBuyStrong buy
An aggregate view of professional's ratings.
Neutral
SellBuy
Strong sellStrong buy
Strong sellSellNeutralBuyStrong buy
Neutral
SellBuy
Strong sellStrong buy
Strong sellSellNeutralBuyStrong buy
Neutral
SellBuy
Strong sellStrong buy
Strong sellSellNeutralBuyStrong buy
Displays a symbol's price movements over previous years to identify recurring trends.
QULN6243436
Rocket Companies, Inc. 7.125% 01-FEB-2032Yield to maturity
6.14%
Maturity date
Feb 1, 2032
QULN6216411
Rocket Companies, Inc. 6.5% 01-AUG-2029Yield to maturity
5.47%
Maturity date
Aug 1, 2029
See all RKT bonds
LSPU
Multi Units Luxembourg SICAV - Amundi Core S&P 500 Swap D USDWeight
0.45%
Market value
125.40 M
USD
SP5G
Multi Units Luxembourg SICAV - Amundi Core S&P 500 Swap Daily Hedged to GBP DWeight
0.45%
Market value
125.40 M
USD
LYSPH
Multi Units Luxembourg SICAV - Amundi Core S&P 500 Swap Daily Hedged to CHF DWeight
0.45%
Market value
125.40 M
USD
LU2266995542
Multi Units Luxembourg SICAV - Amundi Core S&P 500 Swap S CapitalisationWeight
0.45%
Market value
125.40 M
USD
SP5C
Multi Units Luxembourg SICAV - Amundi Core S&P 500 Swap C-EURWeight
0.45%
Market value
125.40 M
USD
Explore more ETFs
Frequently Asked Questions
The current price of RKT is 362.47 MXN — it has decreased by −1.12% in the past 24 hours. Watch Rocket Companies, Inc. Class A stock price performance more closely on the chart.
Depending on the exchange, the stock ticker may vary. For instance, on BMV exchange Rocket Companies, Inc. Class A stocks are traded under the ticker RKT.
RKT stock has fallen by −11.38% compared to the previous week, the month change is a 4.30% rise, over the last year Rocket Companies, Inc. Class A has showed a 64.76% increase.
We've gathered analysts' opinions on Rocket Companies, Inc. Class A future price: according to them, RKT price has a max estimate of 440.92 MXN and a min estimate of 299.82 MXN. Watch RKT chart and read a more detailed Rocket Companies, Inc. Class A stock forecast: see what analysts think of Rocket Companies, Inc. Class A and suggest that you do with its stocks.
RKT stock is 1.13% volatile and has beta coefficient of −0.30. Track Rocket Companies, Inc. Class A stock price on the chart and check out the list of the most volatile stocks — is Rocket Companies, Inc. Class A there?
Today Rocket Companies, Inc. Class A has the market capitalization of 1.01 T, it has decreased by −2.87% over the last week.
Yes, you can track Rocket Companies, Inc. Class A financials in yearly and quarterly reports right on TradingView.
Rocket Companies, Inc. Class A is going to release the next earnings report on Feb 19, 2026. Keep track of upcoming events with our Earnings Calendar.
RKT earnings for the last quarter are 1.28 MXN per share, whereas the estimation was 0.82 MXN resulting in a 55.75% surprise. The estimated earnings for the next quarter are 1.45 MXN per share. See more details about Rocket Companies, Inc. Class A earnings.
Rocket Companies, Inc. Class A revenue for the last quarter amounts to 29.42 B MXN, despite the estimated figure of 30.64 B MXN. In the next quarter, revenue is expected to reach 39.82 B MXN.
RKT net income for the last quarter is −2.27 B MXN, while the quarter before that showed −33.48 M MXN of net income which accounts for −6.68 K% change. Track more Rocket Companies, Inc. Class A financial stats to get the full picture.
As of Jan 30, 2026, the company has 14.2 K employees. See our rating of the largest employees — is Rocket Companies, Inc. Class A on this list?
EBITDA measures a company's operating performance, its growth signifies an improvement in the efficiency of a company. Rocket Companies, Inc. Class A EBITDA is 19.44 B MXN, and current EBITDA margin is 26.80%. See more stats in Rocket Companies, Inc. Class A financial statements.
Like other stocks, RKT shares are traded on stock exchanges, e.g. Nasdaq, Nyse, Euronext, and the easiest way to buy them is through an online stock broker. To do this, you need to open an account and follow a broker's procedures, then start trading. You can trade Rocket Companies, Inc. Class A stock right from TradingView charts — choose your broker and connect to your account.
Investing in stocks requires a comprehensive research: you should carefully study all the available data, e.g. company's financials, related news, and its technical analysis. So Rocket Companies, Inc. Class A technincal analysis shows the neutral today, and its 1 week rating is buy. Since market conditions are prone to changes, it's worth looking a bit further into the future — according to the 1 month rating Rocket Companies, Inc. Class A stock shows the strong buy signal. See more of Rocket Companies, Inc. Class A technicals for a more comprehensive analysis.
If you're still not sure, try looking for inspiration in our curated watchlists.
If you're still not sure, try looking for inspiration in our curated watchlists.