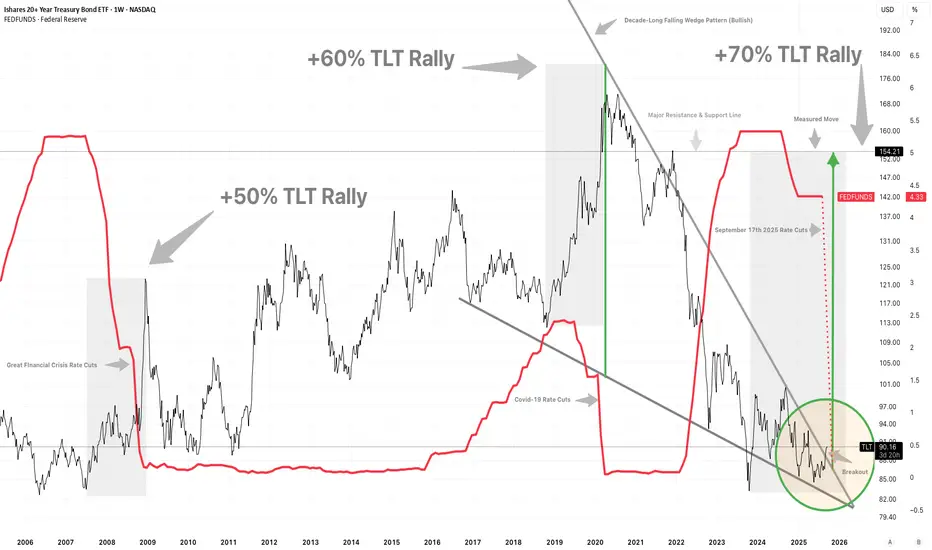
Why Now is the Best Time to Load Up on T-BillsIn 2025, investors have a unique opportunity to capitalize on high yields from Treasury Bills (T-Bills) as interest rates hover at their highest levels in years. With indications that the Federal Reserve may soon start cutting rates, now could be the ideal time to invest in T-Bills through the TLT E
Key stats
About iShares 20+ Year Treasury Bond ETF
Home page
Inception date
Jul 22, 2002
Structure
Open-Ended Fund
Replication method
Physical
Dividend treatment
Distributes
Distribution tax treatment
Ordinary income
Income tax type
Capital Gains
Max ST capital gains rate
39.60%
Max LT capital gains rate
20.00%
Primary advisor
BlackRock Fund Advisors
Distributor
BlackRock Investments LLC
ISIN
US4642874329
While taking a different approach from our benchmark, TLT effectively captures the far end of the Treasury curve in a liquid package. Exclusively holding bonds with 20+ years to maturity, TLT isby designvery sensitive to long-term interest-rate movements. The fund has higher duration than our benchmark, which holds bonds in the 10- to 30-year range. The fund changed its underlying index from the Barclays US 20+ Year Treasury Bond Index to the ICE US Treasury 20+ Year Index on March 31, 2016. This change did not alter the fund's exposure in a meaningful way. TLT is a great choice for investors who want long-term Treasury exposure.
Related funds
Classification
What's in the fund
Exposure type
Government
Stock breakdown by region
Top 10 holdings
Bonds may begin their generational breakout on Trump's Gas PriceTrump has said that gas is going back below $2.00/gal. We know from recent history that Trump is not to be faded. This deflationary movement may send bonds soaring
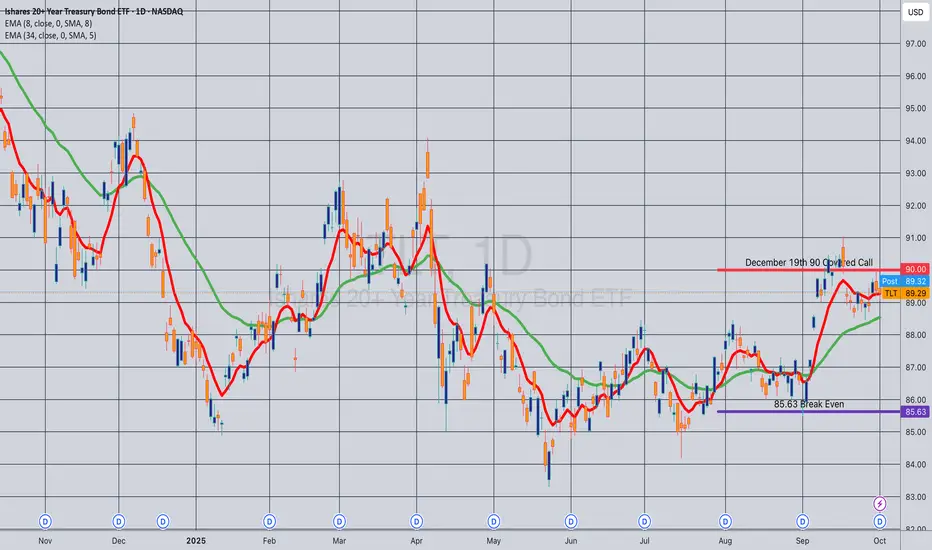
UPDATE: TLT December 19th 90 Covered CallsThis is a continuation of a long-running TLT covered call setup that I started out in April of 2025 (See Post Below) with my current break even shown which I'm doing an update on.
I've generated 6.50 ($650) in free cash flow to date in short call premium + dividends on a buying power effect that wa
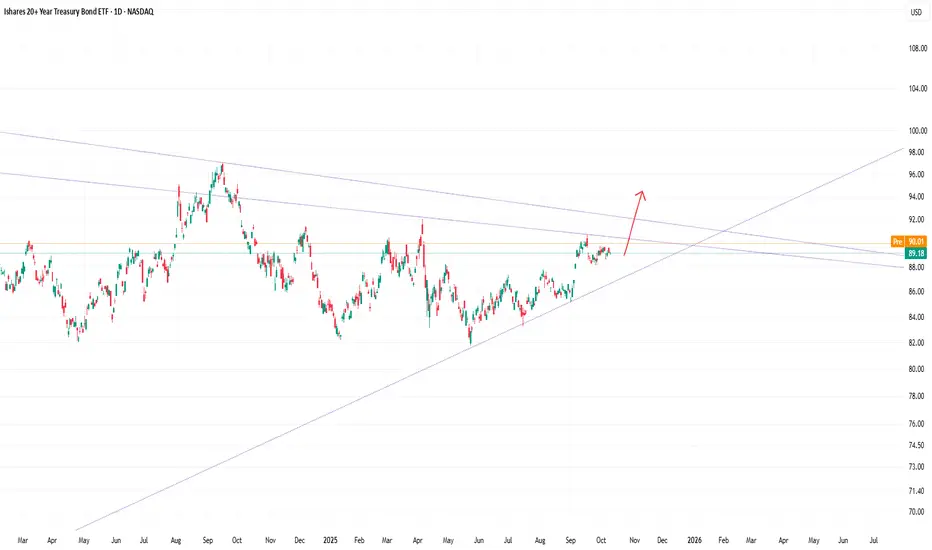
TLT current levels and possible way forwardSetup an arc as a potential forecasting tool to model the future price action of the TLT 20 year treasury bond.
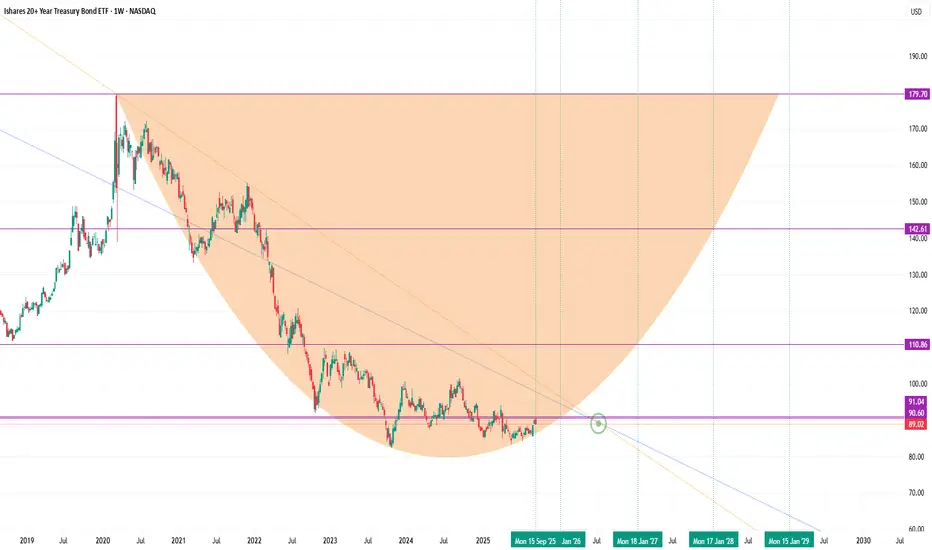
TLT to 110 as FED cut cycle beginsExtended duration bond proxies like TLT are trading at all time lows due to the high interest rates in the US the last few years. With the FED turning dovish, and labor market starting to crack, this trend is likely to reverse. TLT is a good bet here, more leverage can be gained with a 3x ETF like T

TLT TimeRate cuts start this Wednesday, September17th, 2025.
Polymarket odds are now strongly in favor of 3 rate cuts in 2025. CME Fedwatch probability is now at 70% for 3 cuts by December 10th.
Economic data, especially employment, has strongly confirmed the start of a full rate-cutting cycle beginning
Long TLT/SPY📌 Bonds Explained: What They Are, How They Work & Key Risks
Bonds are one of the oldest and most important financial instruments in global markets. They are used by governments, corporations, and institutions to raise money, and by investors to earn income, diversify portfolios, and manage risk.
A

Opening (IRA): TLT November 21st -83P... for a 1.02 credit.
Comments: Looking to pick up additional shares at 83 or below. Targeting the strike and duration that pays around 1% of the strike price in credit.

TLT Long Here or CloseI expect TLT to rally this summer since rate cuts are more likely then not
TP1 91
TP2 96

$TLT bull run is beginning; Top trade idea for 2026- Anticipated Federal Reserve Rate Cuts are coming. People think for the good reason but it is actually for the wrong reason. Fed is too late !
- Treasury yields are falling after being stubborn for years
- NASDAQ:TLT would be safe haven for the recession we are tipping into 2026
- Market is all t

See all ideas
Summarizing what the indicators are suggesting.
Oscillators
Neutral
SellBuy
Strong sellStrong buy
Strong sellSellNeutralBuyStrong buy
Oscillators
Neutral
SellBuy
Strong sellStrong buy
Strong sellSellNeutralBuyStrong buy
Summary
Neutral
SellBuy
Strong sellStrong buy
Strong sellSellNeutralBuyStrong buy
Summary
Neutral
SellBuy
Strong sellStrong buy
Strong sellSellNeutralBuyStrong buy
Summary
Neutral
SellBuy
Strong sellStrong buy
Strong sellSellNeutralBuyStrong buy
Moving Averages
Neutral
SellBuy
Strong sellStrong buy
Strong sellSellNeutralBuyStrong buy
Moving Averages
Neutral
SellBuy
Strong sellStrong buy
Strong sellSellNeutralBuyStrong buy
Displays a symbol's price movements over previous years to identify recurring trends.
Frequently Asked Questions
An exchange-traded fund (ETF) is a collection of assets (stocks, bonds, commodities, etc.) that track an underlying index and can be bought on an exchange like individual stocks.
TLT trades at 1,676.000 MXN today, its price has risen 0.44% in the past 24 hours. Track more dynamics on TLT price chart.
TLT net asset value is 1,674.62 today — it's risen 1.49% over the past month. NAV represents the total value of the fund's assets less liabilities and serves as a gauge of the fund's performance.
TLT assets under management is 933.04 B MXN. AUM is an important metric as it reflects the fund's size and can serve as a gauge of how successful the fund is in attracting investors, which, in its turn, can influence decision-making.
TLT price has risen by 0.63% over the last month, and its yearly performance shows a −9.65% decrease. See more dynamics on TLT price chart.
NAV returns, another gauge of an ETF dynamics, showed a 5.84% increase in three-month performance and has decreased by −3.52% in a year.
NAV returns, another gauge of an ETF dynamics, showed a 5.84% increase in three-month performance and has decreased by −3.52% in a year.
TLT fund flows account for −146.20 B MXN (1 year). Many traders use this metric to get insight into investors' sentiment and evaluate whether it's time to buy or sell the fund.
Since ETFs work like an individual stock, they can be bought and sold on exchanges (e.g. NASDAQ, NYSE, EURONEXT). As it happens with stocks, you need to select a brokerage to access trading. Explore our list of available brokers to find the one to help execute your strategies. Don't forget to do your research before getting to trading. Explore ETFs metrics in our ETF screener to find a reliable opportunity.
TLT invests in bonds. See more details in our Analysis section.
TLT expense ratio is 0.15%. It's an important metric for helping traders understand the fund's operating costs relative to assets and how expensive it would be to hold the fund.
No, TLT isn't leveraged, meaning it doesn't use borrowings or financial derivatives to magnify the performance of the underlying assets or index it follows.
In some ways, ETFs are safe investments, but in a broader sense, they're not safer than any other asset, so it's crucial to analyze a fund before investing. But if your research gives a vague answer, you can always refer to technical analysis.
Today, TLT technical analysis shows the buy rating and its 1-week rating is neutral. Since market conditions are prone to changes, it's worth looking a bit further into the future — according to the 1-month rating TLT shows the sell signal. See more of TLT technicals for a more comprehensive analysis.
Today, TLT technical analysis shows the buy rating and its 1-week rating is neutral. Since market conditions are prone to changes, it's worth looking a bit further into the future — according to the 1-month rating TLT shows the sell signal. See more of TLT technicals for a more comprehensive analysis.
Yes, TLT pays dividends to its holders with the dividend yield of 3.68%.
TLT trades at a premium (0.05%).
Premium/discount to NAV expresses the difference between the ETF’s price and its NAV value. A positive percentage indicates a premium, meaning the ETF trades at a higher price than the calculated NAV. Conversely, a negative percentage indicates a discount, suggesting the ETF trades at a lower price than NAV.
Premium/discount to NAV expresses the difference between the ETF’s price and its NAV value. A positive percentage indicates a premium, meaning the ETF trades at a higher price than the calculated NAV. Conversely, a negative percentage indicates a discount, suggesting the ETF trades at a lower price than NAV.
TLT shares are issued by BlackRock, Inc.
TLT follows the US Treasury 20+ Year Index. ETFs usually track some benchmark seeking to replicate its performance and guide asset selection and objectives.
The fund started trading on Jul 22, 2002.
The fund's management style is passive, meaning it's aiming to replicate the performance of the underlying index by holding assets in the same proportions as the index. The goal is to match the index's returns.