Sanctions and Their Role in the Global Market1. Understanding Sanctions
Sanctions are restrictions placed by one country or a group of countries on another nation or entity to enforce international laws or influence political or economic decisions. They are often used as alternatives to military intervention, serving as diplomatic or economic pressure tools. Sanctions can be applied for various reasons — to punish aggression, prevent nuclear proliferation, counter terrorism, or respond to human rights violations.
The key players in imposing sanctions are major economic and political blocs such as the United Nations (UN), the European Union (EU), and powerful individual nations like the United States. The U.S., for instance, uses the Office of Foreign Assets Control (OFAC) to design and enforce sanctions globally.
2. Types of Sanctions
Sanctions come in several forms, each targeting different aspects of an economy or government operation. The most common types include:
Economic Sanctions:
These restrict trade and financial transactions. Examples include import and export bans, restrictions on investments, or freezing of assets. Economic sanctions are intended to weaken a nation’s economic stability.
Trade Sanctions:
Trade restrictions can prevent the export of critical goods like oil, technology, or weapons. For instance, sanctions on Iran’s oil exports have significantly limited its main source of revenue.
Financial Sanctions:
These target banking systems, financial institutions, and access to international payment systems like SWIFT. Russia, for example, faced severe financial isolation after its 2022 invasion of Ukraine.
Travel and Visa Sanctions:
These restrict the movement of political leaders, business executives, or individuals associated with illicit activities.
Military Sanctions:
These include arms embargoes that prevent the sale or supply of weapons and military technology.
Sectoral Sanctions:
These are targeted at specific sectors, such as defense, energy, or finance, to maximize economic pressure while minimizing collateral damage.
3. Objectives of Sanctions
The main goal of sanctions is to influence the behavior of governments or organizations without direct conflict. Their objectives include:
Deterring Aggression:
Sanctions can discourage military invasions or aggressive policies by raising the economic costs of conflict.
Promoting Human Rights:
Countries imposing sanctions often aim to pressure regimes accused of human rights abuses to change their policies or release political prisoners.
Preventing Nuclear Proliferation:
Sanctions against nations like North Korea and Iran are designed to stop the development of nuclear weapons programs.
Countering Terrorism:
Sanctions can block financial channels and assets used by terrorist groups.
Maintaining Global Stability:
Sanctions can be part of a coordinated global response to maintain international peace and uphold the rules-based order.
4. Mechanisms and Enforcement
Sanctions are typically implemented through laws, executive orders, or international agreements. Enforcement mechanisms include:
Asset Freezes: Preventing access to money or property held in foreign accounts.
Export Controls: Blocking the sale of critical goods, technology, or services.
Financial Restrictions: Limiting a country's access to international capital markets or payment systems.
Secondary Sanctions: Penalizing third-party countries or companies that do business with the sanctioned nation.
Monitoring compliance is crucial. Organizations such as the Financial Action Task Force (FATF) help track illegal financial activities and ensure that sanctions are effectively enforced.
5. Impact on the Global Market
The effects of sanctions ripple through the global economy, influencing trade balances, currency values, and market confidence. The impact varies based on the size and integration of the targeted country into the global market.
a. Trade and Supply Chains
Sanctions often disrupt global supply chains. For instance, sanctions on Russia and Iran have affected oil and gas supplies, driving up energy prices worldwide. Similarly, export restrictions on high-tech goods to China have reshaped global semiconductor and electronics markets.
b. Energy Markets
Energy is one of the most affected sectors. Russia’s sanctions after the Ukraine conflict caused global oil and gas price surges, forcing Europe to seek alternative energy suppliers. The Organization of the Petroleum Exporting Countries (OPEC) also faces indirect pressure when sanctions alter global energy supply and demand dynamics.
c. Financial Markets
Financial sanctions can restrict global capital flow. When large economies face sanctions, investors often move funds to safer markets, affecting currency exchange rates and global liquidity. For example, the freezing of Russian foreign reserves shook confidence in the global financial system and led to a rethinking of foreign reserve management by other nations.
d. Currency and Inflation
Countries under sanctions often experience currency depreciation due to restricted foreign investment and reduced exports. This leads to inflation and reduced purchasing power. Conversely, global markets can see inflation spikes when critical exports like oil or metals are restricted.
e. Global Business and Investment
Multinational corporations often have to withdraw from sanctioned regions to avoid penalties. For example, Western companies left Russia in 2022, leading to billions in losses. At the same time, other countries—like China, India, and Turkey—sometimes step in to fill trade gaps, reshaping global business networks.
6. Winners and Losers of Sanctions
Sanctions do not impact all players equally.
Losers:
The sanctioned nation’s economy typically suffers severe downturns—loss of exports, unemployment, and financial isolation. Ordinary citizens bear the brunt of inflation and shortages.
Winners:
Competing countries may benefit by capturing markets vacated by the sanctioned nation. For example, when Western countries stopped buying Iranian oil, Asian importers received discounted rates.
Some nations, particularly those with large domestic markets or resource independence, can mitigate sanctions' effects. Russia and Iran, for example, have developed parallel financial systems and strengthened ties with non-Western economies.
7. Geopolitical and Strategic Consequences
Sanctions also alter geopolitical alliances. Countries facing sanctions often form new partnerships to bypass restrictions. The growing trade between Russia, China, and Iran illustrates the emergence of an alternative economic bloc.
Furthermore, sanctions can accelerate de-dollarization—efforts by countries to reduce reliance on the U.S. dollar in international trade. This trend threatens to reshape the structure of global finance in the long term.
8. Criticisms and Limitations
While sanctions aim to promote peace and justice, they often have unintended consequences. Critics argue that:
Humanitarian Impact: Sanctions can lead to shortages of food, medicine, and essentials, harming civilians more than political elites.
Limited Effectiveness: Some regimes adapt through smuggling, black markets, or new alliances, reducing the intended pressure.
Global Economic Distortion: Sanctions can destabilize global markets, raising costs for consumers worldwide.
Political Misuse: At times, sanctions are used to advance national interests rather than collective global welfare.
9. The Future of Sanctions in a Multipolar World
As global power becomes more multipolar, sanctions may evolve from unilateral tools into complex, multilateral strategies. The rise of alternative payment systems, digital currencies, and regional alliances is challenging traditional sanction mechanisms.
Future sanctions are likely to become more targeted, using data analytics and AI to precisely identify and restrict individuals or companies, minimizing collateral damage. Digital finance, blockchain monitoring, and trade transparency will shape how sanctions are enforced.
10. Conclusion
Sanctions are a central instrument of global diplomacy and economic policy. They influence trade routes, investment flows, and geopolitical alignments across the world. While they serve as a non-violent means to uphold international norms, their ripple effects on the global market can be profound—affecting everything from oil prices to inflation and financial stability.
The challenge for the international community is to design sanctions that are strategic, humane, and effective, achieving political goals without destabilizing the world economy. In an era of interconnected markets, the role of sanctions will continue to grow—reflecting not only power politics but also the evolving architecture of the global financial and trade system.
Trade ideas

Short??Being the long term trend is up I wouldn’t short this. I’m being patient for a big correction that will widen this channel for the last wave of the long term trend. $96 area is what I’m looking for. Stay patient and don’t fall for the short term momentum swings.

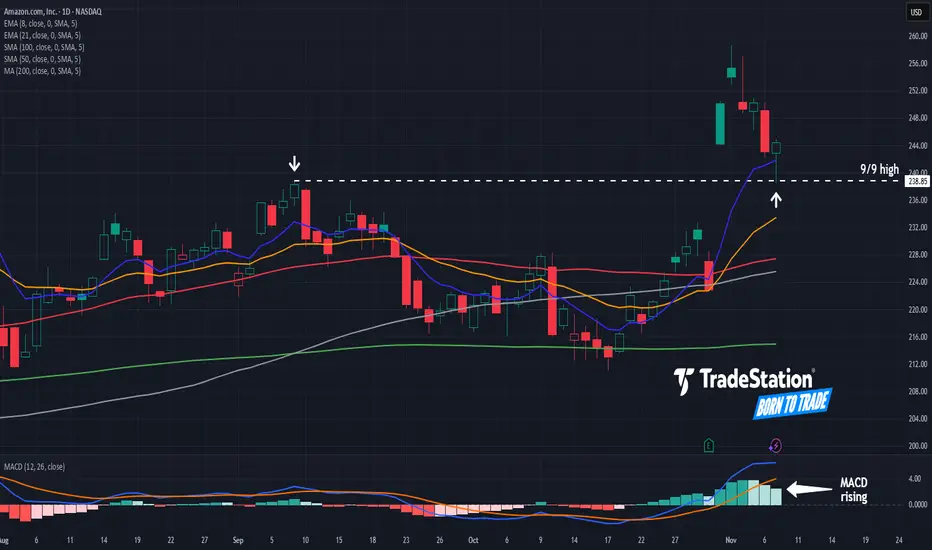
Amazon.com Pulls Back After Earnings BreakoutMomentum from strong earnings propelled Amazon.com to new highs last week, and now it’s pulled back.
The first pattern on today’s chart is the September 9 high of $238.85. The e-commerce and cloud-computing giant tested and held that level last Friday. Has old resistance become new support?
Second, the 8-day exponential moving average (EMA) recently crossed above the 21-day EMA. MACD is also rising. Those signals may reflect short-term bullishness.
Next, AMZN touched its 200-day simple moving average (SMA) less than a month ago. The 50-day SMA and 100-day SMA are also relatively close. Notice how the faster SMAs are above the slower SMAs. That may suggest its long-term trend is getting bullish again.
Last, AMZN is an active underlier in the options market. (Its average daily volume of 977,000 contracts ranked fourth in the S&P 500 last month, according to TradeStation data.) That could help traders take positions with calls and puts.
TradeStation has, for decades, advanced the trading industry, providing access to stocks, options and futures. If you're born to trade, we could be for you. See our Overview for more.
Past performance, whether actual or indicated by historical tests of strategies, is no guarantee of future performance or success. There is a possibility that you may sustain a loss equal to or greater than your entire investment regardless of which asset class you trade (equities, options or futures); therefore, you should not invest or risk money that you cannot afford to lose. Online trading is not suitable for all investors. View the document titled Characteristics and Risks of Standardized Options at www.TradeStation.com . Before trading any asset class, customers must read the relevant risk disclosure statements on www.TradeStation.com . System access and trade placement and execution may be delayed or fail due to market volatility and volume, quote delays, system and software errors, Internet traffic, outages and other factors.
Securities and futures trading is offered to self-directed customers by TradeStation Securities, Inc., a broker-dealer registered with the Securities and Exchange Commission and a futures commission merchant licensed with the Commodity Futures Trading Commission). TradeStation Securities is a member of the Financial Industry Regulatory Authority, the National Futures Association, and a number of exchanges.
Options trading is not suitable for all investors. Your TradeStation Securities’ account application to trade options will be considered and approved or disapproved based on all relevant factors, including your trading experience. See www.TradeStation.com . Visit www.TradeStation.com for full details on the costs and fees associated with options.
Margin trading involves risks, and it is important that you fully understand those risks before trading on margin. The Margin Disclosure Statement outlines many of those risks, including that you can lose more funds than you deposit in your margin account; your brokerage firm can force the sale of securities in your account; your brokerage firm can sell your securities without contacting you; and you are not entitled to an extension of time on a margin call. Review the Margin Disclosure Statement at www.TradeStation.com .
TradeStation Securities, Inc. and TradeStation Technologies, Inc. are each wholly owned subsidiaries of TradeStation Group, Inc., both operating, and providing products and services, under the TradeStation brand and trademark. When applying for, or purchasing, accounts, subscriptions, products and services, it is important that you know which company you will be dealing with. Visit www.TradeStation.com for further important information explaining what this means.
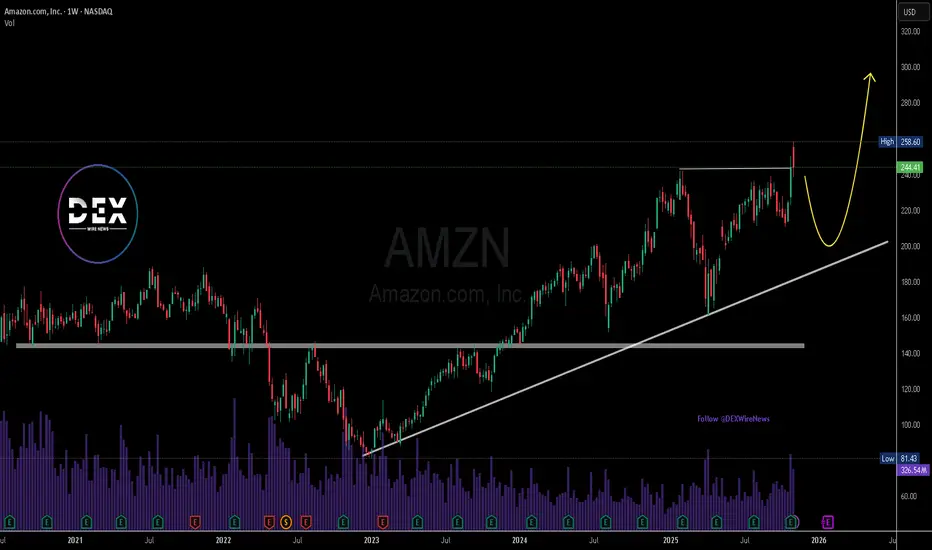
Amazon’s Golden Cup — Ready to Soar or Fall Back?A clear Cup and Handle pattern has formed, signaling a potential bullish continuation. The stock recently broke above key resistance around $244 and is now pulling back to retest that breakout level.
Short-Term View (1–3 weeks):
• If price holds above $244 and shows strength, upside momentum is likely to resume.
• Short-term target: $265–$270
• Stop-loss: below $230
Long-Term View (2–6 months):
• A confirmed breakout of this pattern could lead to a strong upward move.
• Long-term target: $290–$310
• If price loses the $227–$230 support zone, the bullish setup weakens, and a drop toward $200 could follow.
Summary:
AMZN is at a key retest zone after breaking a long-term resistance. Holding above $244 would likely confirm the bullish trend, while failure to sustain that level might trigger a deeper correction.

Emerging Markets vs. Developed Markets1. Definition and Core Characteristics
Developed markets, also known as advanced economies, are countries with high per capita income, diverse industrial bases, mature financial systems, and stable governance. Examples include the United States, Japan, Germany, the United Kingdom, Canada, and Australia. These nations typically exhibit consistent GDP growth, low unemployment, high standards of living, and robust infrastructure.
Emerging markets, on the other hand, refer to nations transitioning from developing to developed status. They possess fast-growing economies, rising income levels, improving infrastructure, and expanding industrial sectors. Examples include India, China, Brazil, South Africa, Indonesia, and Mexico. Although they experience higher growth potential, they also face greater economic and political risks compared to developed economies.
2. Economic Growth and Development Patterns
A defining difference between emerging and developed markets lies in their growth trajectories.
Developed Markets:
Growth in these economies is steady but slower, usually ranging between 1–3% annually. Since they already have established industries and saturated markets, economic expansion is mainly driven by innovation, technology, and services rather than basic infrastructure or manufacturing.
Emerging Markets:
These economies grow at a much faster pace, often 5–8% per year or more. Growth is fueled by industrialization, urbanization, and rising domestic consumption. For instance, India’s growing middle class and digital revolution are major drivers of its economic expansion. However, such rapid growth is often accompanied by volatility, due to political instability, fluctuating currencies, or changes in foreign investment trends.
3. Industrial and Sectoral Composition
Developed economies are service-oriented, with a significant share of GDP coming from finance, healthcare, technology, and education. For example, the U.S. economy is dominated by companies like Apple, Google, and Microsoft that symbolize the knowledge economy. Manufacturing remains important but is often outsourced to lower-cost regions.
Emerging economies, meanwhile, are production-driven, focusing on manufacturing, agriculture, and resource extraction. However, a gradual transition toward services and technology is underway. Countries like China and India are prime examples of economies moving from manufacturing-led growth to innovation-led development, with increasing emphasis on digitalization and sustainability.
4. Income Levels and Living Standards
One of the clearest distinctions between these two market types is per capita income.
Developed Markets:
These countries have high per capita GDP, often exceeding $40,000, accompanied by strong social welfare systems, high literacy rates, and excellent healthcare. The Human Development Index (HDI) is consistently high, reflecting better living standards and longer life expectancy.
Emerging Markets:
Per capita income is significantly lower, ranging between $5,000 and $15,000. However, income levels are rising rapidly due to economic reforms and industrial growth. Although inequality remains a concern, urbanization and globalization are improving access to education, healthcare, and employment opportunities.
5. Financial Markets and Investment Opportunities
Developed markets have deep, liquid, and mature financial systems, with stable currencies, advanced stock exchanges, and well-regulated banking sectors. Investors in developed markets usually enjoy lower risks but modest returns. For example, investing in the U.S. S&P 500 index offers steady long-term growth and low volatility.
Emerging markets, conversely, provide higher risk and higher reward opportunities. Their stock markets are often less efficient, meaning prices may not fully reflect all available information. This creates potential for outsized returns, especially for informed or institutional investors. However, challenges like currency volatility, regulatory unpredictability, and political risk can cause abrupt market swings.
For instance, while investing in Indian or Brazilian equities may yield double-digit returns during expansion phases, sudden policy shifts or inflation spikes can quickly erode gains.
6. Political and Institutional Stability
Developed nations usually maintain stable political systems, transparent legal frameworks, and efficient governance. Investors trust these systems because of predictable policies, strong property rights, and low corruption levels. This stability enhances long-term economic confidence.
In emerging markets, political and institutional environments are often less stable. Corruption, weak legal enforcement, and unpredictable regulations can pose serious risks. Nevertheless, many emerging economies are actively implementing reforms to strengthen democratic institutions, promote transparency, and attract foreign direct investment (FDI).
7. Infrastructure and Technology
Infrastructure is another area of sharp contrast.
Developed Economies:
Have world-class infrastructure — from advanced transport networks and reliable power supply to high-speed internet and digital governance. Technology adoption is widespread, and industries are at the forefront of innovation, artificial intelligence, and green technology.
Emerging Economies:
Often struggle with infrastructure gaps such as inadequate roads, unreliable electricity, or limited internet penetration, though rapid progress is visible. Countries like India and Indonesia are investing heavily in digital public infrastructure, renewable energy, and smart cities, aiming to bridge the gap with developed nations.
8. Demographics and Labor Markets
Emerging markets generally have younger populations with larger labor forces, providing long-term growth potential. This “demographic dividend” can be a major advantage if coupled with education and skill development. India, for example, is expected to have one of the youngest workforces in the world, fueling economic productivity for decades.
In contrast, developed countries face aging populations and shrinking labor pools, which pose challenges for social security systems and economic sustainability. These countries rely increasingly on automation, immigration, and productivity gains to offset demographic decline.
9. Global Trade and Integration
Developed markets dominate global trade, contributing a significant portion of global exports and imports. Their economies are highly integrated through multinational corporations and global supply chains.
Emerging markets are catching up fast, playing an increasingly crucial role in global trade. China’s rise as the “world’s factory” is a prime example. Moreover, emerging economies are forming regional alliances (like BRICS) to promote trade cooperation and reduce dependency on Western markets.
10. Risks and Challenges
While developed markets offer stability, they face slow growth, market saturation, and low interest rates, which limit investment returns. Political populism and high public debt in some regions (like the EU or Japan) also pose long-term challenges.
Emerging markets, on the other hand, face macroeconomic volatility, currency risks, political uncertainty, and dependency on global capital flows. External shocks—such as rising U.S. interest rates or global recessions—can trigger capital flight, weakening their currencies and economies.
11. Opportunities and Future Outlook
The future growth engine of the world economy is expected to come from emerging markets. With young populations, digital transformation, and expanding consumer bases, these nations are set to drive global demand for goods and services. By 2050, emerging economies like India, China, and Indonesia are projected to rank among the world’s largest economies.
However, developed markets will continue to lead in innovation, research, and governance, providing technological leadership and financial stability. The ideal global investment strategy may thus combine the stability of developed markets with the growth potential of emerging ones.
12. Conclusion
In summary, the contrast between emerging and developed markets lies not only in income and infrastructure but also in growth dynamics, risks, and opportunities. Developed markets represent stability, maturity, and innovation, while emerging markets symbolize growth, transformation, and potential. Together, they form a balanced ecosystem in the global economy — one driving advancement through stability, the other through dynamism and change.
For investors and policymakers alike, the key is to understand both sides — to appreciate the security of developed markets while harnessing the growth of emerging ones. In the decades ahead, the synergy between these two worlds will shape the future of global finance, trade, and prosperity.
AMZN : Bulls Taking a Pause Before the Next Leg Up!Amazon’s recent surge has hit a temporary Pause, forming a healthy pullback phase. If structure remains intact, another bullish wave could follow soon. Key levels to watch: 238–240 for a potential continuation setup.
Disclosure: We are part of Trade Nation's Influencer program and receive a monthly fee for using their TradingView charts in our analysis.

Amazon.com, Inc. ($AMZN) Expands Low-Cost Bazaar ServiceAmazon.com, Inc. (Nasdaq: NASDAQ:AMZN ) is making a bold move into the global low-cost e-commerce space. The retail giant announced the expansion of its Amazon Bazaar service — known as “Haul” in the U.S. — to 14 new international markets, intensifying competition with Shein and PDD Holdings’ Temu.
The service targets value-driven shoppers by offering ultra-cheap goods like $10 dresses, $5 accessories, and $2 home items, with a focus on emerging markets such as Nigeria, the Philippines, Hong Kong, Saudi Arabia, and Taiwan. The expansion builds on Bazaar’s earlier success in Mexico and the UAE, signaling Amazon’s strategy to tap into the fast-growing global demand for low-cost online retail amid weaker consumer sentiment.
This move comes as U.S. import tariffs under the Trump administration pressure household budgets, particularly for low-income groups. By diversifying into affordable goods, Amazon aims to defend its e-commerce dominance against Chinese platforms that have captured younger, price-sensitive consumers through viral marketing and social commerce. Analysts note that this pivot could enhance Amazon’s total addressable market and bolster revenue from international operations in 2026.
Technically, Amazon’s stock remains in a strong uptrend, trading near $244.41, slightly below its recent high of $258.60 market this week. The weekly chart shows consistent higher lows supported by a long-term ascending trendline from early 2023. The $220–$225 zone now serves as key support, with potential for a short-term pullback before resuming the rally toward the $300 level.
Momentum remains positive, with volume strength confirming investor interest following strong Q3 earnings. A sustained move above $260 could trigger a fresh bullish leg, extending Amazon’s dominant run as both a tech and retail powerhouse.
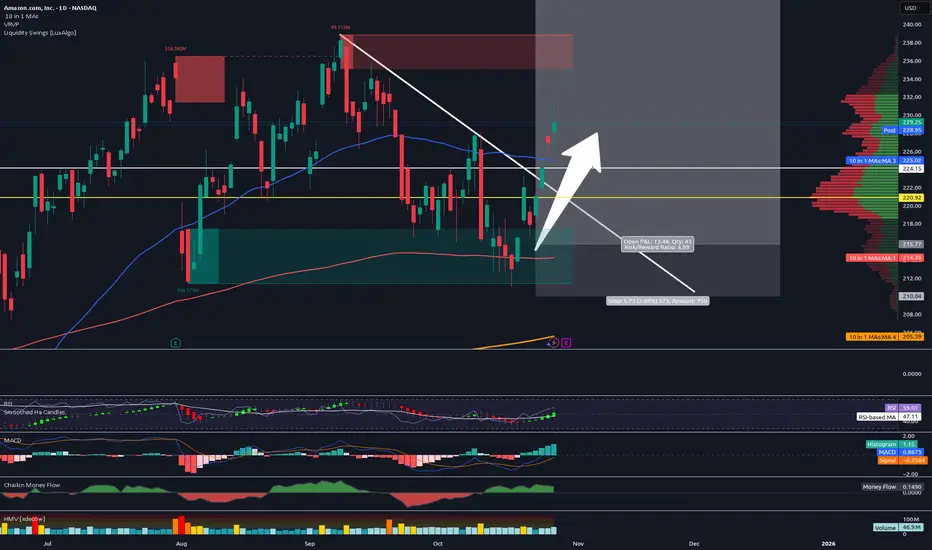
Sold Half Amazon - Raised Stops - Halfway to Final Target!Trading Fam,
We are halfway to my final target. I've been trading safe lately. So, I decided to sell half here, capture some profit, and raise my stops to $225, ensuring we're all in the money on this trade.
Congrats to those who followed me. We are 14 wins for the last 14 trades with an avg. of 33% profit per trade. Since implementing my new indicator just over a year ago, I continue to improve trade accuracy with each trade. Experience is growing and so are our wallets. Our portfolio is up 69% since we started with the indicator! Those are incredible stats for any trader, nevermind someone like me who just learned how to trade liquidity!
You guys know where to find me and all of my trades. 100% free to all of my followers.
✌️Stew
Global Currency Trends and Challenges1. The Dynamics of Global Currency Trends
Currencies fluctuate continuously due to multiple factors including interest rates, inflation, trade balances, and investor sentiment. In recent years, global currency trends have reflected the broader transitions in the world economy:
a. The Strength of the U.S. Dollar (USD):
The U.S. dollar continues to dominate as the world’s primary reserve currency, accounting for about 58% of global foreign reserves. Its dominance is supported by the stability of the U.S. economy and the depth of its financial markets. However, the dollar’s strength often creates challenges for emerging markets as it raises the cost of imports and foreign debt repayment.
b. The Rise of the Chinese Yuan (CNY):
China has made consistent efforts to internationalize the yuan (renminbi). Through trade settlements, central bank swap agreements, and inclusion in the IMF’s Special Drawing Rights (SDR) basket, the yuan has become an increasingly influential currency in Asia and beyond. The Belt and Road Initiative further enhances its role in regional trade.
c. The Euro’s Resilience (EUR):
Despite political fragmentation and energy crises, the euro remains the second most traded and held currency. The European Central Bank (ECB) has strengthened its credibility through unified monetary policies, although economic disparities among EU member states still pose challenges to its long-term stability.
d. Emerging Market Currencies:
Currencies like the Indian Rupee (INR), Brazilian Real (BRL), and Indonesian Rupiah (IDR) are gaining attention as their economies expand. Yet, these currencies often face volatility due to external factors such as oil prices, foreign investment flows, and geopolitical tensions.
2. Key Global Currency Trends Shaping the Future
a. Shift Toward De-Dollarization:
Many nations are reducing their dependence on the U.S. dollar for trade settlements and reserves. Countries such as Russia, China, and India are increasingly using local currencies for bilateral trade. The establishment of regional payment systems like the BRICS Pay initiative signals a long-term effort to diversify away from dollar dominance.
b. Digital and Central Bank Digital Currencies (CBDCs):
The introduction of digital currencies is transforming how money circulates globally. China’s digital yuan pilot, the European Central Bank’s digital euro project, and the U.S. discussions around a digital dollar show that CBDCs are becoming integral to future monetary systems. They promise faster transactions, greater transparency, and lower cross-border costs but also raise privacy and cybersecurity concerns.
c. Volatility Amid Global Uncertainty:
Geopolitical conflicts, such as the Russia–Ukraine war and Middle East tensions, continue to affect currency markets. These events drive investors toward “safe-haven” currencies like the U.S. dollar, Swiss franc (CHF), and Japanese yen (JPY), increasing volatility in emerging markets.
d. Inflation and Interest Rate Cycles:
Central banks across the globe are battling inflation through aggressive rate hikes. The U.S. Federal Reserve’s monetary tightening has strengthened the dollar, while other currencies have weakened comparatively. Such divergence in interest rate policies creates significant volatility in Forex markets and impacts global capital flows.
e. Technological Integration and Algorithmic Trading:
Advanced analytics and artificial intelligence have changed how currency trading operates. Algorithmic and high-frequency trading (HFT) dominate modern Forex markets, improving liquidity but sometimes amplifying short-term volatility.
3. Major Challenges Facing Global Currencies
a. Inflationary Pressures:
Post-pandemic recovery spending and geopolitical disruptions have triggered persistent inflation across major economies. Currency depreciation is often both a symptom and a cause of inflation, creating a feedback loop that destabilizes developing economies. For example, high inflation in Argentina and Turkey has severely eroded the value of their local currencies.
b. Sovereign Debt and Fiscal Imbalances:
Excessive government borrowing, especially in developing nations, can undermine currency stability. Investors demand higher returns to offset perceived risks, leading to capital flight and exchange rate depreciation. Countries with high external debt face added challenges when the dollar strengthens, as it raises the cost of servicing foreign liabilities.
c. Currency Wars and Competitive Devaluations:
Some nations deliberately devalue their currencies to make exports more competitive, leading to “currency wars.” While this may temporarily boost exports, it can trigger retaliatory devaluations by other nations and disrupt global trade equilibrium.
d. Geopolitical Fragmentation:
Trade conflicts, sanctions, and regional disputes have made currency management more complex. For instance, sanctions on Russia have accelerated the shift toward non-dollar settlements. Similarly, tensions between the U.S. and China have influenced exchange rate policies and investor confidence in Asian markets.
e. The Digital Currency Disruption:
While digital currencies offer efficiency, they also threaten the traditional banking system. Decentralized cryptocurrencies like Bitcoin and Ethereum challenge the authority of central banks, while CBDCs raise questions about data security, financial surveillance, and cross-border regulatory coordination.
4. Regional Perspectives on Currency Challenges
a. North America:
The U.S. dollar’s global dominance remains, but its high value has hurt American exporters. Canada and Mexico, heavily tied to U.S. trade, face indirect pressures from U.S. interest rate policies.
b. Europe:
The eurozone’s challenge lies in maintaining economic cohesion. Energy dependency, especially on imports, continues to pressure the euro. The U.K. pound has also faced volatility post-Brexit due to trade uncertainty.
c. Asia-Pacific:
Asian economies are at the center of global currency evolution. China’s controlled yuan regime, India’s managed float system, and Japan’s ultra-loose monetary stance make the region diverse and influential. However, regional currencies remain vulnerable to U.S. policy changes and commodity price shocks.
d. Latin America and Africa:
These regions experience chronic currency instability due to high inflation, low reserves, and political risks. However, some nations are exploring local currency trade and digital payment systems to stabilize transactions and reduce reliance on the dollar.
5. The Way Forward: Managing Currency Stability
To navigate the future of global currencies, coordinated strategies are essential:
a. Strengthening Monetary Cooperation:
International institutions like the IMF and World Bank must enhance collaboration among central banks to stabilize currency markets during crises.
b. Promoting Transparent Policies:
Countries should maintain credible fiscal and monetary policies to attract investor confidence and reduce speculative volatility.
c. Managing the Digital Transition:
As CBDCs become more common, global frameworks must ensure interoperability, privacy protection, and cyber resilience.
d. Diversification of Reserves:
Central banks are gradually increasing holdings in gold, the euro, and the yuan to balance their portfolios against dollar fluctuations.
Conclusion
Global currency trends reflect the dynamic balance of economic power, technological progress, and geopolitical change. While the U.S. dollar remains dominant, the rise of digital currencies and regional trade systems is reshaping the international monetary landscape. Challenges like inflation, debt, and political tension will continue to test the stability of global currencies. The future will likely see a more diversified, digital, and interconnected currency system — one that demands cooperation, innovation, and adaptability from all nations involved.

Amazon Wave Analysis – 6 November 2025
- Amazon reversed from resistance area
- Likely to fall to support level 0.8000
Amazon recently reversed from the resistance area between the resistance level 250.00, upper daily Bollinger Band and the resistance trendline of the daily up channel from April.
The downward reversal from this resistance area started the active short-term ABC correction 2.
Given the strength of the resistance level 250.00 and the overbought daily Stochastic, Amazon can be expected to fall to the next support level 240.00.

$AMZN with a bullish outlook following its earnings #StocksThe PEAD projected a bullish outlook for NASDAQ:AMZN after a positive over reaction following its earnings release, with an expected accuracy of 75%.

AMZN — Gap, Pullback, and the Next Leg Toward $285?After a strong post-earnings gap higher, NASDAQ:AMZN is now pulling back toward a key technical zone — the anchored VWAP and the low-volume node (LVN).
In volume profile terms, LVNs often act as springboards for price. Because they represent areas of low trading activity, liquidity is thin — meaning when price revisits these zones, it often rejects quickly as buyers or sellers step in to defend the prior imbalance.
Currently, AMZN’s structure shows:
Price retesting anchored VWAP support from the October swing low
LVN just below acting as potential demand pocket (~$240–$245)
Upside channel intact, targeting the $285 zone if this pullback holds
A bounce from this region would confirm continuation within the ascending channel — aligning with the broader re-rating theme after solid Q3 earnings momentum.
Key Levels:
Support: $240–$245 (LVN / anchored VWAP)
Resistance: $270, then $285
Bias: Bullish continuation

20+ Stocks for November: Your Ultimate Investing Radar📅 October is wrapped up, and a new month always means a new chapter on the charts.
Monthly closes reveal which breakouts are real, not temporary spikes, but clear signs that investors are willing to pay higher prices than before.
📊 I’m looking for those moments where the market proves it has changed its mind — when former resistance finally turns into support, and timing starts creating an edge.
That’s one of the biggest strengths of technical analysis: we don’t hope it moves, we see the action on the chart.
-----------------------------------
🔍 Over the past days, I’ve done another full round of research:
I scanned through both the Nasdaq 100 and S&P 500 , and also handpicked a few strong setups from Europe.
In total, you’ll find 20+ stocks today — each with its own description and plan.
I know that sounds like a lot, but there are quite a few of you here already 🙏, and every investor has a different strategy.
So don’t feel you have to study everything… just scan the names: if something catches your eye, stop and dig in.
If not, scroll on. You don’t need to cover them all.
📣 The purpose of my work is simple:
"to give you good, technically correct ideas — ones that avoid the classic mistakes that come from buying at the wrong time."
…and when you combine that with your own fundamental homework, your success rate might turn out surprisingly green.
-----------------------------------
🧭 November radar
In today’s post, you’ll find both breakout setups and corrections that have reached strong support zones.
I’ll also go through the major indices, explaining:
“why it might be smarter to take half positions instead of going all in.”
☕ So grab your coffee… and let’s kick off with 10 breakout ideas!
👇
Amazon (AMZN)
No need for a long introduction here. When a member of the Magnificent Seven delivers a clean breakout, it’s a signal you don’t want to ignore.
📈 For those who regularly add to their Mag7 holdings or rotate between them monthly, Amazon would be my pick this time.
While META’s recent correction isn’t a bad zone either, technically speaking, AMZN shows the stronger setup right now.
-----------------------
Dell Technologies (DELL)
Dell Technologies is one of the largest IT companies in the U.S., providing computers, servers, and cloud infrastructure solutions.
Over recent quarters, Dell has gained solid momentum — especially from AI server demand, which helped lift margins thanks to its higher-value infrastructure products.
Revenue also came in above expectations in the latest report, boosting investor confidence and pushing the stock to new highs.
📈 From a technical perspective, the breakout is clear:
The $150 resistance, which had held for almost a year and a half, finally gave way in October.
The structure is now open to the upside, and the chart shows clear strength.
The decision is simple: enter now, wait for a deeper retest, or just keep it on your radar — your call.
-----------------------
Nokia (OMXHEX: NOKIA)
A few weeks ago, I mentioned that Nokia was setting up for a potential breakout, and look at that, it actually did.
The company announced a collaboration with NVIDIA, which triggered the long-awaited move higher, breaking through its previous resistance zone.
The €5.5 level mentioned earlier is now history, and the monthly close above it confirms the breakout’s validity.
Whether you enter immediately, wait for a retest, or skip it because it doesn’t fit your style — again, your call. Technically valid!
-----------------------
Steel Dynamics (STLD)
Steel Dynamics ranks among the largest steel producers in the U.S., known for using recycled steel and low-emission production methods.
With a P/E of 20 (forward ~12), the company benefits from U.S. infrastructure investments and the broader manufacturing uptrend.
Recent quarterly results have been steady, the balance sheet is strong, and cash flow remains solid, supporting potential future growth.
📈 Technical setup:
This chart checks every box of a classic breakout play:
..........
🧭 Full radar and extended notes are available on my main page — you’ll find it easily.
All the best,
Vaido

Opportunities in the Rising Global Market1. Expanding International Trade and Investment
One of the foremost opportunities in a rising global market is the expansion of international trade and investment. Globalization has blurred borders, allowing businesses of all sizes to reach international customers. Emerging economies such as India, Vietnam, Indonesia, and several African nations are becoming production and consumption hubs, offering both low-cost manufacturing and growing middle-class demand.
Foreign Direct Investment (FDI) flows are increasing as companies seek to diversify their operations beyond traditional centers like the U.S. and China. This diversification opens up opportunities in logistics, infrastructure, and supply chain development, especially in countries with favorable policies for international investors.
2. Technology and Digital Transformation
Digital transformation is one of the most powerful drivers of global market growth. Technologies like artificial intelligence (AI), blockchain, the Internet of Things (IoT), and cloud computing have revolutionized how businesses operate and interact with customers.
Startups and established enterprises alike are leveraging digital platforms to reach global audiences with minimal infrastructure costs. E-commerce, digital payments, and fintech innovations have made it easier than ever to transact across borders. For instance, digital wallets and international payment gateways are facilitating seamless trade for small and medium-sized enterprises (SMEs), opening doors to customers worldwide.
Moreover, the rise of remote work has globalized the labor market. Skilled professionals can now collaborate with international organizations, creating a new ecosystem of cross-border employment and outsourcing.
3. Emerging Market Growth
Emerging markets are becoming the new engines of global economic expansion. Nations in Asia, Latin America, and Africa are seeing significant urbanization, industrialization, and consumer spending growth. As these economies mature, they present vast opportunities in sectors such as construction, retail, renewable energy, and healthcare.
India, for example, is expected to become the world’s third-largest economy in the next decade, supported by its technology sector, demographic advantage, and infrastructure push. Similarly, Africa’s youthful population and resource-rich landscape make it a promising destination for global investors looking for long-term growth.
4. Sustainable and Green Investments
Sustainability has become a major theme in global economic growth. Investors and corporations are increasingly focusing on environmental, social, and governance (ESG) principles. Governments are introducing incentives and regulations to promote clean energy, carbon reduction, and sustainable practices.
The renewable energy sector—solar, wind, hydrogen, and electric mobility—presents some of the fastest-growing investment opportunities worldwide. Green finance, which supports projects aligned with climate goals, is also gaining traction. Investors are channeling funds into sustainable infrastructure, green bonds, and clean technology startups.
This global shift towards sustainability not only supports the environment but also creates profitable ventures for businesses adapting early to green transitions.
5. Financial Market Expansion
Global financial markets have become more interconnected and accessible than ever before. Stock exchanges, commodities markets, and derivatives platforms are now open to international participants through digital trading systems. This interconnection provides investors with multiple instruments to diversify portfolios and manage risk effectively.
The rise of global indices, exchange-traded funds (ETFs), and offshore platforms like GIFT Nifty in India have given retail and institutional investors exposure to global equities, bonds, and commodities. This interconnectedness means that opportunities once limited to specific regions—like U.S. tech stocks or European industrial firms—are now open to global participants.
6. Innovation in Consumer Markets
Consumer behavior is changing rapidly, driven by digitization, cultural shifts, and rising disposable incomes. Global consumers are demanding better products, personalized experiences, and sustainable choices. This shift is creating opportunities for innovation across industries—from fashion and food to healthcare and entertainment.
Brands that adapt to multicultural markets and leverage data analytics to understand global consumers can build strong international presence. Moreover, the rise of influencer marketing, cross-border e-commerce, and global logistics networks has allowed even small brands to compete with global giants.
7. Infrastructure and Smart Cities
The growing demand for advanced infrastructure is fueling global investment in smart cities, transportation, and utilities. Governments around the world are investing in modernizing public infrastructure to support economic expansion.
From metro systems and high-speed rail networks to digital infrastructure like 5G connectivity and data centers, the opportunities are vast. Construction, real estate, and technology companies are finding immense potential in building sustainable urban environments.
8. Healthcare and Biotechnology
The COVID-19 pandemic underscored the importance of global healthcare resilience. As a result, investment in biotechnology, pharmaceuticals, telemedicine, and digital health platforms has surged.
Countries are increasing healthcare spending to improve public health systems and preparedness for future challenges. Startups developing advanced diagnostic tools, vaccines, and AI-based medical solutions are attracting international capital. Cross-border collaborations in healthcare research and innovation are also on the rise, creating a truly global medical ecosystem.
9. Education and Skill Development
Globalization has increased the demand for skilled professionals who can work across industries and geographies. This trend has opened new opportunities in education technology (EdTech), online learning, and skill development platforms.
Students from developing nations are seeking international education and professional certification, fueling cross-border education partnerships. Businesses offering global upskilling solutions, remote training, and language learning platforms are seeing tremendous growth.
10. Tourism, Culture, and Lifestyle Industries
As global mobility increases, tourism, cultural exchange, and lifestyle industries are bouncing back strongly. Digital platforms have transformed how people plan and experience travel, leading to the rise of global hospitality startups and online tourism platforms.
Cultural exports—such as entertainment, fashion, and culinary arts—are finding global audiences through digital streaming and social media. Countries promoting cultural tourism and creative industries are seeing higher economic and employment growth.
11. Geopolitical Realignments and Trade Shifts
Global politics and trade agreements are reshaping markets. Regional trade pacts like the Regional Comprehensive Economic Partnership (RCEP) and bilateral agreements are opening new trade corridors. Businesses that understand these shifts and align their strategies accordingly can capture early-mover advantages.
Moreover, the diversification of supply chains away from single countries (like China) is creating new opportunities for nations such as India, Vietnam, and Mexico. These supply chain realignments are encouraging global manufacturing partnerships and investments in logistics hubs.
12. The Digital Asset and Fintech Revolution
Digital finance is transforming global monetary systems. Cryptocurrencies, blockchain-based assets, and central bank digital currencies (CBDCs) are introducing new ways to invest and transfer value.
Fintech companies are expanding cross-border payment solutions, digital lending, and decentralized finance (DeFi) systems. These innovations are fostering inclusion by bringing unbanked populations into the financial system, creating opportunities in both developed and emerging economies.
Conclusion
The rising global market presents a landscape of unprecedented opportunities for those prepared to adapt, innovate, and think globally. Technology, sustainability, and cross-border collaboration are driving the next phase of economic growth.
Businesses that embrace digital transformation, investors who diversify globally, and governments that promote inclusive development stand to benefit the most. As globalization evolves, success will depend not only on capital and innovation but also on resilience, adaptability, and ethical governance.
In essence, the world economy is moving toward greater integration, inclusivity, and digital empowerment—making this one of the most exciting eras for global growth and investment.

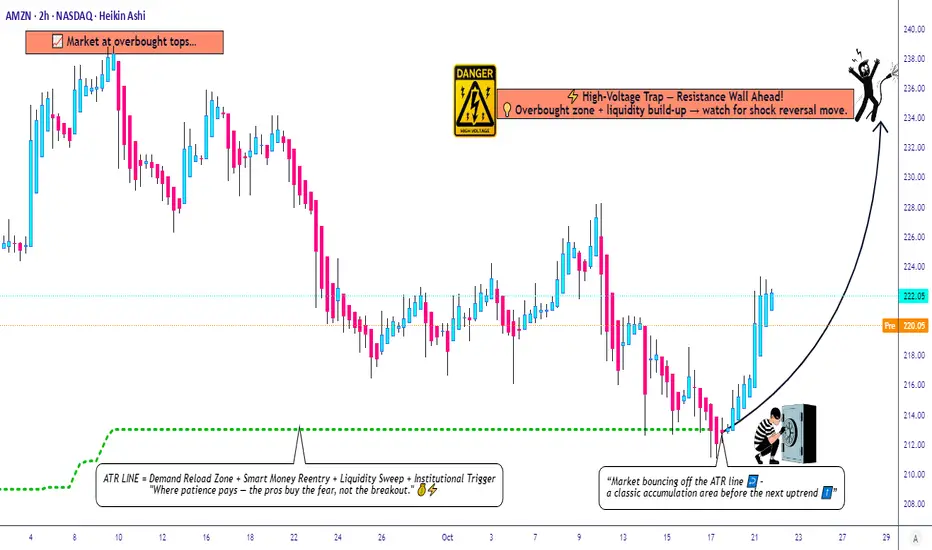
Amazon’s Hidden Pullback Opportunity – Smart Risk, Smart Entry🎯 AMZN: The "Thief's Playbook" — Stealing Profits Like a Wall Street Ninja
📊 Asset Overview
AMAZON.COM INC (NASDAQ: AMZN) — The E-Commerce Titan & Cloud King 👑
Strategy Type: Swing/Day Trade — Bullish Pullback Setup
Confirmation Tool: ATR (Average True Range) ✅
🎭 The "Thief Strategy" Explained
Listen up, Thief OG's! 🦹♂️ This ain't your grandma's single-entry trade. We're using layered limit orders — think of it like setting multiple traps to catch money at different price levels. Professional? Yes. Legal? Absolutely. Stylish? You bet! 😎
🔥 Entry Zones — The Multi-Layer Trap
The Thief's Ladder Entry Method:
You've got options, trader! Pick your poison:
Option 1: Aggressive Single Entry
Jump in at current market price (~$220-$225 zone)
Option 2: The Layered "Thief" Method 🎯
Set multiple buy limit orders to scale in:
Layer 1: $220
Layer 2: $218
Layer 3: $216
Layer 4: $214
Why layer? Because markets don't move in straight lines, baby! This lets you average down if price dips while maintaining a solid risk profile. Add more layers based on your risk appetite! 🍰
🛑 Stop Loss — Protecting Your Loot
Thief's Emergency Exit: $210 🚨
⚠️ IMPORTANT DISCLAIMER:
Dear Ladies & Gentlemen (my fellow Thief OG's), I'm NOT telling you to blindly follow my stop loss. This is MY risk management. YOU manage YOUR money. Trade at your own risk — this is entertainment with charts, not financial advice! 🎲
🎯 Target Zone — Where We Cash Out
⚡ High-Voltage Trap Alert — Resistance Wall Ahead! ⚡
Target Price: $235 🎯💵
Why this target?
💡 This zone shows classic signs of:
Strong resistance from previous price action 🧱
Overbought conditions brewing (RSI warming up) 📈
Liquidity build-up (big money sitting here) 💰
Potential "bull trap" zone → smart money escapes here! 🪤
My advice? When price hits $235, secure your profits! Don't get greedy.
⚠️ ANOTHER DISCLAIMER:
Dear Thief OG's, this is MY target based on MY analysis. You do YOU. Take profits when YOU feel comfortable. Your money, your rules, your risk! 💪
🔗 Related Assets to Watch
Keep an eye on these correlated movers — they can give you early signals for AMZN's direction:
📦 E-Commerce & Tech Giants:
NASDAQ:TSLA (Tesla) — Tech sentiment leader; when tech rallies, AMZN often follows 🚗⚡
NASDAQ:MSFT (Microsoft) — Cloud competitor (Azure vs AWS); inverse correlation sometimes kicks in ☁️
NASDAQ:GOOGL (Alphabet) — Ad spending indicator; strong Google ads = strong consumer spending = bullish for AMZN 🔍
NYSE:WMT (Walmart) — Retail competitor; if WMT struggles, AMZN often benefits 🛒
📊 Market Indices:
NASDAQ:QQQ (Nasdaq 100 ETF) — AMZN is heavily weighted here; QQQ direction = AMZN direction 📉📈
AMEX:SPY (S&P 500 ETF) — Overall market health check; risk-on = AMZN rallies 🇺🇸
💵 Market Sentiment Indicators:
TVC:VIX (Volatility Index) — Low VIX = calm markets = bullish for growth stocks like AMZN 😌
TVC:DXY (US Dollar Index) — Weak dollar = bullish for mega-cap tech stocks 💵📉
The Correlation Play: If you see NASDAQ:QQQ breaking higher + TVC:VIX dropping + tech stocks rallying → high probability AMZN follows the party! 🎉
🧠 Key Technical Points
✅ ATR Confirmation: Volatility is in the "sweet spot" — not too choppy, not too sleepy
✅ Pullback Structure: Classic bullish retracement setting up
✅ Risk-Reward: Solid 2:1+ ratio with layered entries
✅ Volume Profile: Watching for confirmation on breakout
⚠️ Legal Disclaimer — Read This Twice! 📢
THIS IS THE "THIEF STYLE" TRADING STRATEGY — JUST FOR FUN & EDUCATIONAL ENTERTAINMENT! 🎭
I am NOT a financial advisor. This is NOT financial advice. This is a trading idea based on technical analysis, shared for educational and entertainment purposes only.
❌ Do NOT risk money you can't afford to lose
❌ Do NOT trade based solely on this idea
❌ Do your own research (DYOR)
❌ Past performance ≠ future results
✅ Trade responsibly and manage your risk
You are 100% responsible for your own trading decisions. I'm just a chart nerd sharing ideas with the community! 🤓📊
💬 Final Thoughts from Your Friendly Neighborhood Chart Thief
Markets are a game of patience, discipline, and calculated risks. The "Thief Strategy" is about being strategic, not reckless. Set your traps, manage your risk, and let the market come to you! 🕸️💰
Stay sharp, stay profitable, and remember: the best trades are the ones you plan, not the ones you chase! 🏃♂️💨
✨ If you find value in my analysis, a 👍 and 🚀 boost is much appreciated — it helps me share more setups with the community!
#AMZN #Amazon #StockMarket #SwingTrading #DayTrading #TechnicalAnalysis #BullishSetup #LayeredEntry #ThiefStrategy #TradingIdeas #ATR #ResistanceZone #TakeProfit #RiskManagement #NASDAQ #TechStocks #PullbackTrading #PriceAction #SupportAndResistance #TradeSmart
Trade safe, trade smart, and let's get this bread! 🍞💸
AMAZON flashing a massive 5-year Sell Signal.More than 5 months ago (May 28, see chart below), we gave a strong buy signal on Amazon Inc. (AMZN), which last Friday hit our $255 Target:
This time we come across a massive Sell Signal on the 1W time-frame as the price hit (and is so far being rejected on) the 5-year Higher Highs trend-line that started back on the August 31 2020 Top.
We can see that during that period of time, Amazon had started a Triple Top formation that eventually led to the final rejection and the start of the 2022 Bear Cycle. Until we can talk about such a correction, we can expect at least a pull-back to its 1W MA50 (blue trend-line) as all of those 2020/21 rejections did. As a result, our medium-term Target on Amazon is $220.
Notice also the similarities between the 1W RSI sequences between the two fractals (2020/21 and 2024/25), both forming Lower Highs patterns.
-------------------------------------------------------------------------------
** Please LIKE 👍, FOLLOW ✅, SHARE 🙌 and COMMENT ✍ if you enjoy this idea! Also share your ideas and charts in the comments section below! This is best way to keep it relevant, support us, keep the content here free and allow the idea to reach as many people as possible. **
-------------------------------------------------------------------------------
💸💸💸💸💸💸
👇 👇 👇 👇 👇 👇

Amazon: Break Through ResistanceAmazon shares recently surged decisively above the resistance level at $242.52. This strong rally has pushed the beige wave V significantly higher. For now, we see further upside potential for this move, until the broader wave (V) in blue is complete.

AMAZONAMAZON has done exactly what we expected, now we will wait for correction to finish in this week for further upside.
Disclosure: We are part of Trade Nation's Influencer program and receive a monthly fee for using their TradingView charts in our analysis.

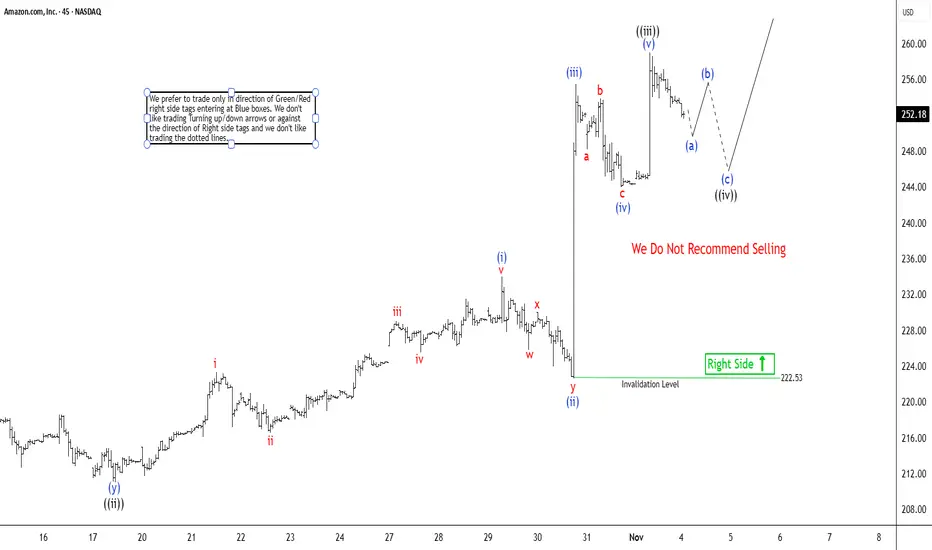
Amazon (AMZN) Impulse Pattern Remains IncompleteThe Short-Term Elliott Wave outlook from the October 11, 2025 low remains constructive, unfolding as a five-wave impulsive structure. From that low, wave ((i)) advanced and concluded at $222, followed by a corrective pullback in wave ((ii)), which bottomed at $211.03, as illustrated in the 45-minute chart. Subsequently, the stock began nesting higher within wave ((iii)), suggesting a bullish continuation.
From wave ((ii)), wave i terminated at $223.32, and wave ii retraced to $216.52. A strong rally in wave iii reached $228.98, while wave iv produced a shallow dip to $225.54. The final leg, wave v, extended to $234, thereby completing wave (i) of a higher degree. The ensuing pullback in wave (ii) unfolded as a double three corrective structure, ending at $222.53. Within this sequence, wave w declined to $225.85, wave x rebounded to $230.45, and wave y completed the correction at $222.53. This marked the conclusion of wave (ii) in the higher degree count.
The stock then resumed its upward trajectory in wave (iii), reaching $255.55. A modest retracement in wave (iv) ended at $243.98, followed by a final push in wave (v) to $259, completing wave ((iii)). Currently, wave ((iv)) is in progress, correcting the cycle from the October 17 low. As long as the pivot at $222.53 remains intact, the pullback is expected to find support in the 3, 7, or 11 swing sequence, paving the way for further upside.
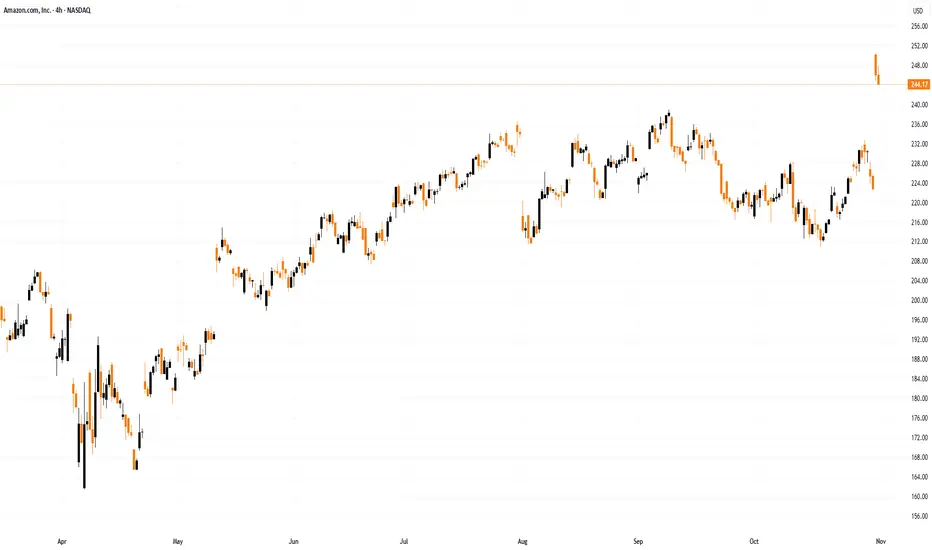
Anatomy of a Breakaway Gap & What Happens NextAMZN is an excellent example of a Breakaway gap due to improvement of the company's fundamentals. The prior fundamental level is clearly defined on the chart and easy to see. The new fundamental level has not yet been fully established and will begin to form over the next few weeks.
Even if there is a Flash Crash, the fundamental lows of the previous level are very strong support.
What to watch for in the stock price action over the next few weeks:
1. Dark Pool accumulation in the Buy Zone.
2. Pro Trader nudges.
3. Speculative trading by Smaller funds managers.

AMZN - The next few yearsBefore, I claimed AMZN could propel to 700 USD or 800 USD - This is not correct.
Scenario 1:
AMZN reaches around 320 USD (1.618 fib extension), touching the upper purple channel rail, to then break down from the small purple channel
Scenario 2:
AMZN FBOs to the upside of the small purple channel and retargets the upper band of the light blue channel and 2.618 fib extension
What happens after both scenarios?
AMZN will collapse to the volume node and ONLY horizontal support of 5-6 USD
Not financial advice.

Amazon (AMZN) Shares Reach $250 for the First TimeAmazon (AMZN) Shares Reach $250 for the First Time
As the chart shows, Amazon (AMZN) shares rose to a record high on Friday, reaching the $250 mark for the first time. This came after the publication of a strong earnings report:
→ Revenue: $180.2 billion (up 13% year on year).
→ Earnings per share (EPS): actual = $1.95, forecast = $1.56 (a 25% beat).
Investor sentiment was further boosted by the following:
→ AWS (Amazon Web Services) revenue grew by 20% year on year, despite competition from Microsoft Azure and Google Cloud.
→ Amazon issued a confident outlook for the crucial holiday (fourth) quarter.
Technical Analysis of Amazon (AMZN) Chart
When analysing the chart on 24 September, we:
→ used AMZN share price fluctuations to construct an upward channel (shown in blue);
→ noted early signs of weakness.
Subsequently, the price reached a low at point A – where the bulls found support from the lower boundary of the channel and the August low (in fact, there was a false bearish breakout) – and made a successful attempt to resume the uptrend.
The two red candles on Friday suggest that the initial reaction to the report may have been overly optimistic (as confirmed by the RSI indicator). Therefore, it is possible that a corrective move will follow – for example, towards the support area that includes:
→ the median line of the current channel;
→ the previous all-time high of $242;
→ the September high around $238;
→ the 0.382 Fibonacci retracement level of the A→B impulse, around $235.
This article represents the opinion of the Companies operating under the FXOpen brand only. It is not to be construed as an offer, solicitation, or recommendation with respect to products and services provided by the Companies operating under the FXOpen brand, nor is it to be considered financial advice.
Venture capital’s impact on the global trade marketHow VC affects global trade: the mechanisms
Financing innovation that changes traded goods and services.
VC funds back high-growth firms that commercialize new technologies — cloud computing, advanced manufacturing, fintech, biotech, logistics automation, and more. When those firms scale, they create new tradable goods and services (SaaS, precision-manufactured components, platform-enabled logistics). This changes the composition of trade: more intangible flows (software, data services, algorithms) and more niche high-value physical goods replace or complement traditional commodity exports.
Accelerating cross-border platformization.
Many VC-backed companies are platforms (marketplaces, payment networks, cloud providers) whose value increases rapidly with scale and cross-border adoption. Platforms reduce transaction costs for international trade — matching buyers and sellers, enabling payments, providing reputational signals, and coordinating logistics. As platforms spread, they lower entry barriers for SMEs to sell abroad, boosting smaller-scale cross-border commerce and diversifying trade flows.
Transforming supply chains and logistics.
VC funds startups that digitize procurement, inventory, freight matching, customs compliance, and last-mile delivery. Innovations such as real-time tracking, AI-driven demand forecasting, and digital freight marketplaces make supply chains more responsive and efficient, enabling just-in-time and cross-border manufacturing models that wouldn’t be feasible earlier. This increases the volume and complexity of trade while reducing friction and cost.
Enabling services trade and digital exports.
VC concentrates in sectors with low marginal-cost reproduction (software, digital media, professional services delivered online). This encourages countries and firms to export services rather than only goods. Digital exports scale quickly and change balance-of-trade dynamics: countries with strong VC ecosystems often become net exporters of digital services, platform access, and intellectual property.
Shifting where value is captured.
VC incentives — fast growth, winner-take-most dynamics — tend to cluster value capture into a handful of global hubs (Silicon Valley, Shenzhen, Berlin, Bengaluru). This concentration affects trade patterns: components and raw inputs might be sourced globally, but design, IP, and high-margin services concentrate in VC hubs, shifting where trade-related revenue accrues.
Mobilizing global capital and cross-border investment.
VC syndicates, limited partners, and crossover investors operate internationally. Cross-border VC flows channel capital into emerging markets, enabling local firms to scale for export and import substitution. Conversely, outbound VC by multinationals can seed ecosystems abroad that later integrate into global production networks.
Regional patterns and asymmetries
VC’s trade effects are uneven. Advanced economies with deep VC ecosystems tend to export high-value services, software, and specialized capital goods, while importing raw materials and standardized manufactured goods. Emerging markets often receive VC that helps them move up the value chain (e.g., fintech in Africa enabling cross-border remittances, or manufacturing startups in Southeast Asia adding localized tech to global supply chains). However, the scale and type of VC differ: early-stage consumer apps proliferate in populous markets, while deep-tech VC concentrates where research and IP protection exist.
Risks, distortions, and unintended consequences
Concentration and monopoly power.
VC’s “go big fast” model favors market concentration. Dominant platforms can extract rents, distort trade by locking sellers into their ecosystems, and raise barriers for competitors from other countries.
Short-termism and fragility.
Chasing growth sometimes prioritizes market share over sustainable trade relationships or resilient supply chains. VC-backed firms that expand rapidly but lack stable unit economics can fail, disrupting cross-border networks they had come to enable.
Uneven benefits and inequality.
Regions without VC access may be relegated to low-value segments of global value chains. Even within countries, VC-backed growth can widen gaps between digitally integrated exporters and traditional exporters.
Regulatory arbitrage and data flows.
VC-backed platforms often operate across jurisdictions with differing data, privacy, and competition rules. This can create regulatory tensions that affect trade in digital services and cross-border data transfers.
Overreliance on external capital.
Countries that depend on foreign VC inflows for digital export growth may be vulnerable to cyclical capital flows. A sudden retrenchment in global VC can stall export-oriented startups and compress trade.
Policy implications and responses
Invest in complementary assets.
Governments wanting to maximize trade benefits from VC should strengthen research institutions, IP frameworks, digital infrastructure, and skills training. These make local startups more likely to scale into export-capable firms.
Support inclusive access to VC and alternatives.
Programs to broaden investor access (local LPs, public co-investment, blended finance) can reduce regional disparities and keep value capture local. Supporting later-stage finance domestically helps startups mature without forced early exits.
Regulate to preserve competition and resilience.
Antitrust and data-governance policies should balance innovation incentives with prevention of monopolistic platform dominance that can distort trade. Similarly, policies encouraging supply-chain diversification and transparency improve resilience against startup failures.
Promote standards and cross-border agreements.
Trade agreements and harmonized digital regulations (data portability, e-invoicing, digital ID) reduce friction for VC-enabled cross-border services and platforms.
Mitigate risks of capital volatility.
Macroprudential tools, sovereign wealth participation in funds, or public venture vehicles can dampen boom-bust cycles that otherwise cascade into trade disruptions.
Conclusion
Venture capital significantly reconfigures global trade by financing innovations that change what is traded, how trade is organized, and who captures its value. Its power to accelerate platformization, digitization, and supply-chain optimization brings opportunities for growth, diversification, and inclusion — but it also concentrates value, introduces fragility, and can amplify inequalities without careful policy design. For countries and firms, the goal should be to harness VC’s dynamism while building institutions, regulations, and financing structures that spread benefits, preserve competition, and shore up the resilience of the global trade networks VC helps create.
