Ford is a great long term holdFord has survived through everything for hundreds of years. They are one of the longest surviving companies out there and are still doing great! With the new CEO Jim Farley they are undoubtedly due to break out here soon and see new highs. Ford has completely changed their entire lineup to EV in a years time and have already proven these cars are capable to stand up to the competition. I am very bullish on Ford long term and I think they will continue to climb as the sales come in for the new EV lineup. There is also a new Ford Maverick being produced which will be a fully electric truck at around $20,000! Absolutely incredible. I have full faith in Ford to pull through in the race for electric vehicles as they always have. The stock is considerably undervalued currently and my price target is $25.
Trade ideas

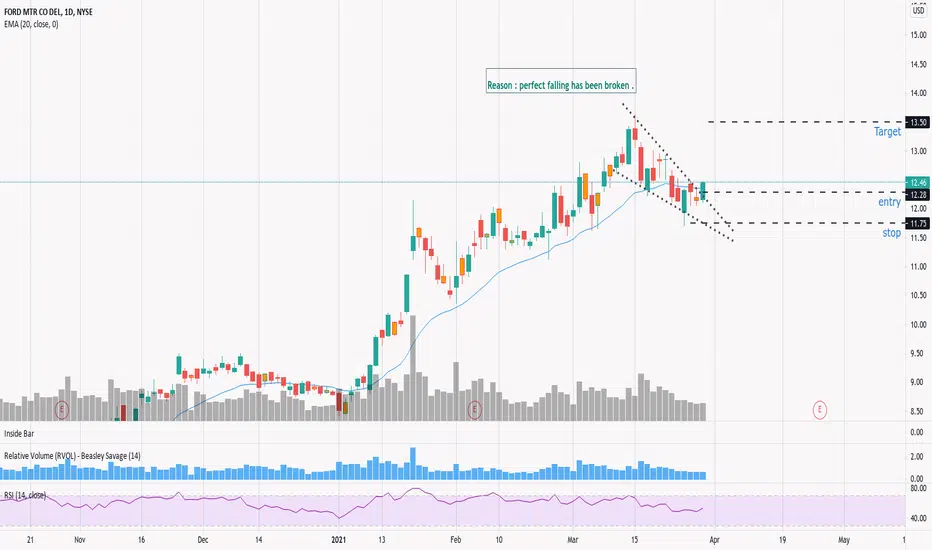
Ford potential pennant, continuation of long-term upward trendFord has been in a long-term uptrend since its lows in March 2020. With a new, dynamic CEO, and huge EV investment, the legacy car maker is highly underappreciated. The trend has slowed recently and a pennant has begun to form as a result of narratives around the chip shortage which was addressed at the last earnings. However, the price action over the last couple of months are beginning to draw the pennant and last time the 50 day moving average was touched - as happened today - we saw a bounce within the pennant configuration. I would expect the long-term uptrend to continue, and in the short-term would see a bounce from this level. Breakout imminent, either into- or post-earnings at the end of this month. Watching closely over next few days for pattern confirmation.

Opinion on FordAnother vehicle company that could move up but i am not as confindent in this one right now.
looks to be consolidating in the symmetrical triangle.
no position. Awaiting to see if it breaks the triangle and goes down.
will maybe consider entry on breakout and re test of support levels.
first price target of 12.50 and 13 if bull holds.
personally not a fan of car plays since i think the EV field has more potential, but F has shown promise in that field.
not financial advice. DYOR.

FORD MTR CO DEL 15MNBullish BAT for SCALPING Strong POTENTIAL REVERSAL ZONE
price need to follow Green Trend line & hit target
If price Breaks Red Trend line is where EXIT before SL hits
POTENTIAL BUY

FORD MTR CO DEL 1HRBULLISH BAT
price need to follow Green Trend line & hit target
If price Breaks Red Trend line is where EXIT before SL hits
POTENTIAL BUY

F / FORD LONG POSITION
PRICE 12.5 $
TP 36.17$
STOP LOSE 1 50% / 11.63 $
STOP LOSE 1 50% / 10.30 $
GOOD LOCK

F LongPrice has been printing higher highs and higher lows on the 1hr time frame. 12.50 support and 200ema (gray) seems to be holding support pretty well. Entry zone at 12.56 - 12.37 zone.
There is still a chance for price to go lower at 12.03 to form double bottom (bullish) and 11.73 is the last support. Break this for a bearish sentiment.

F: Bullish Flag (32%), Ascending Triangle (67%)Primary Target (short term)
Bullish Flag, confirmed (32%)
PT = 14.50$
Secondary Target (Long term):
Ascending Triangle, confirmed (67%)
PT = 15.94$

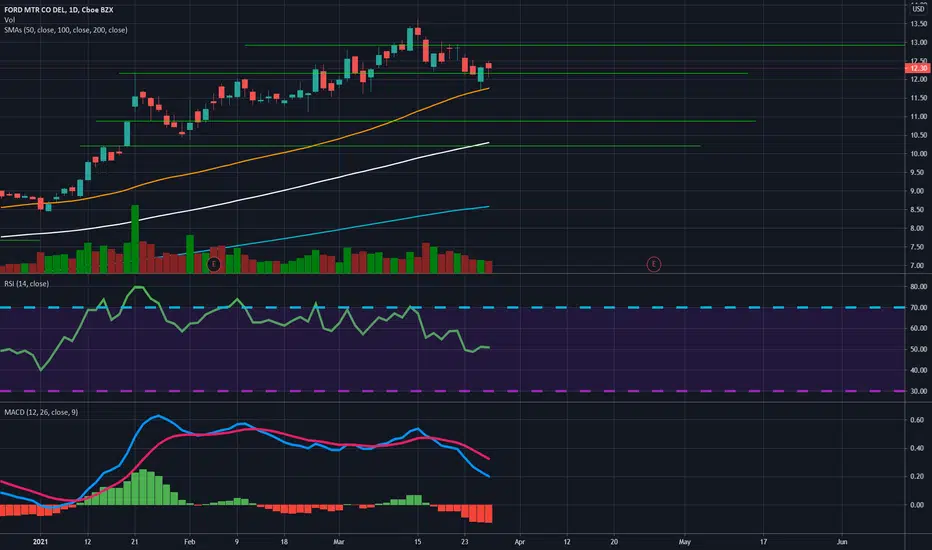
Ford Testing resistance. Long on Ford and looking at the daily chart you can see that ford is testing resistance right now, and the MACD is about to turn green. RSI is steady starting to point up and Earnings are not that far off. Passed thru a dealer and saw the mustang Mach E. doesnt really look like a mustang but its okay. Would not be surprised to hear something about the chip shortage affecting there production. Either way i see this running into the twenties in the coming year.

Ford - Short Term Bearish1) Bearish divergence (white lines).
2) Falling wedge failed breakout (couldn't break above the .382 fib).
3) 9EMA crossing below the 21EMA (bearish indicator).
I think we'll fall to around 11.60-11.11.70. This is the 51EMA as well as the support we bounced off of on 3/25. If we bounce off this level, I'll go long. It'd be a nice double bottom.
I will not short Ford. I'm just waiting for a long entry, and the daily chart says that this is not the time.

FORDTuesday, 30 March 2021
13:46 PM (WIB)
When Mr. Joe Bidden announced the needs for Electrical Vehicles in USO (Universal Service Obligation) scale projection, and Ford with General Motors win this project, I start to purchase Ford when the price still at $10. So I want to add more purchase when the timing is right for Ford. And will keep them alive for 5 or even 10 years from now. In Retrospective, I am a big fan of Ford. So this will be historical movement for my own investment.
Best regards,
RyodaBrainless
"Live to Ride and Ride to Live"

F Daily looks like a bounce off support. F looks like it is bouncing off support which is the 50 sma line. With recent news of a chip shortage affecting many automakers we could see a short down fall, but i expect this to go higher with the change of focus into EVs. MACD is in the red while the RSI is steady. Ford Bronco looks nice.
Bearish Divergence for Ford Ford has diverged significantly from the ascending channel it's been in, so I wouldn't be surprised if we see a retracement back into the channel.
We perfectly hit the 50d MA, but whether we break through that is the important thing to note. Watch out for it.
Bearish divergence on the daily too, which is bearish. Momentum seems to be flipping.
10% drop from here is on the table.

Ford MotorIf we could get a small retrace on Ford I would take a swing at 10-11 level, expecting to see $23 at a minimum in a year or two.
Thanks for looking.

$F - Target$F – Looking for a dip and consolidation for entry. The fib 0.382 should land close to the EMA and vol profile support – seems like a logical place to bounce and catapult through previous highs. Let's find out!
NYSE:F


Buy &FThe best possible price for this stock.
I'm here with 100 shares now, plan to double my position.
Ford Motor free cash flow for the quarter ending December 31, 2020 was 18,527.00, a year-over-year.
Ford Motor free cash flow for the twelve months ending December 31, 2020 was , a year-over-year.
Ford Motor annual free cash flow for 2020 was $18.527B, a 85.14% increase from 2019.
Ford Motor annual free cash flow for 2019 was $10.007B, a 38.28% increase from 2018.
Ford Motor annual free cash flow for 2018 was $7.237B, a 34.49% decline from 2017.
The PE ratio is a simple way to assess whether a stock is over or under valued and is the most widely used valuation measure. Ford Motor PE ratio as of March 19, 2021 is 31.29

Ford ($F) $16 target - long term down trend break out.Price Target - $16
Overshoot target area - $18
I have been long since below $6.
———————————————————
How to read my charts?
- Matching color trend lines shows the pattern. Sometimes a chart can have multiple patterns. Each pattern will have matching color trend lines.
- The yellow horizontal lines shows support and resistance areas.
- Fib lines also shows support and resistance areas.
- The dotted white lines shows price projection for breakout or breakdown target.
Disclaimer: Do your own DD. Not an investment advice.

F - very good looking chartIn addition to it's nice bullish chart F just got an upgrade from Barlays with $16 target
I'm long.

F: Watch out this Triple-Support level! (H, D and W charts)Hello traders and investors! Let’s do a complete Multi Time Frame Analysis ( MTFA ) on Ford today, and analyze the hourly, daily and weekly charts.
First, in the 1h chart, we have a clear short-term bear trend . The moment it did a lower high and it lost the green line at $ 13.06, it started a pullback. The black line was completely ignored, and it went straight to the red line around $ 12.37, which is a much more reliable support level , and I’ll explain why in one minute.
Before we talk about the daily chart, keep in mind that the odds are that F will bounce back up to the area around the 21 ema and the black line next.
Now, the daily chart:
The thing is, in the daily chart, the trend is still clearly bullish , and the short-term bear trend could be just a pullback to its 21 ema again, or to the purple trendline.
See the red line here again? The reason why it is a more reliable support level is because it is near the other two support levels mentioned above in the daily chart. We are talking about a Triple-Support area , and it won’t be easy to F lose this area without stronger bearish patterns.
So far, all we can assume is that this is a pullback, and since we are near a support level, it could be an opportunity to buy, if the buy signs are triggered, of course.
But F must not lose this support level, as if it does, it might do a pullback in the weekly chart:
F is near 2018’s top level, which is a resistance we must keep our eyes on. If it loses the Triple-Support area in the daily chart, then it is easy to imagine F dropping back to its 21 ema in the weekly chart.
But as long as it holds itself near its supports, then the trend will just persist. Just keep your eyes open around and be prepared. If this analysis helped you in some way, please, support it with your like , and remember to follow me to keep in touch with my daily studies!
Thank you very much!

FORD nearing resistanceFord nearing resistance on the hourly and daily. Should go down towards support. If NYSE:F goes to or over 13.48 it may fly as that is the long term resistance/support.

Is the Run Done?COO sells 90,000 shares on 3/10...
Ford recalls 2.6 million vehicles...
Ford warns of potential loss due to extended chip shortages...
Ford announces 2 billion offering...
MACD crossing signal...
