FIG to close the gap at $65Everything lines up. We're at resistance, right now. Fibs look good, trendlines look good, and volume looks good. looking for 12% up from here.
Next report date
—
Report period
—
EPS estimate
—
Revenue estimate
—
0.19 USD
−732.12 M USD
749.01 M USD
50.40 M
About FIGMA INC
Sector
Industry
CEO
Dylan Field
Website
Headquarters
San Francisco
Founded
2012
ISIN
US3168411052
FIGI
BBG00BLZ2CD1
Figma, Inc. is an AI-powered design platform that enables seamless collaboration across the entire product development lifecycle. Its products include FigJam, Figma Slides, Figma Design, Figma Draw, Dev Mode, Figma Sites, Figma Buzz and Figma Make. The company was founded by Dylan Joseph Field and Evan Darrow Wallace in 2012 and is headquartered in San Francisco, CA.
Related stocks

Figma Wave 5 Sell-Off or Bullish Breakout Incoming?High-Probability Setup in Motion, Eyes on the Drop Zone! Figma’s recent price action confirms a developing 5-wave corrective structure, currently deep in the wave 3 leg within a descending channel. The structure remains valid while price stays below the descending trendline, which has consistently a

Is it Asana 2.0?- Similar to NYSE:ASAN , NYSE:FIG has a good product, customer friendly, good UI/UX, easy to use.
- Valuation is out whack because IPO frenzy
- Things I like is their growth which 40%+ yoy but my concern is that the technical addressable market isn't huge for design space in general.
- Their
Slow accumulation - Slow & Steady wins the RaceI like this below $58, but that doesn't make it an optimal entry, below $40 is what i'm after. This is an expensive stock by all valuation metrics. 69x Price to Sales. It wouldn't be right to look at P/E but it's at 1754, sounds like a bad joke, right?
But let's look at it another way. Q2 Revenue i

FIGMA Earnings BEAR PLAY--Put $63 for 200%+?
## ⚠️ FIG Earnings Bear Play 🚨 | High Risk 💣 High Reward 🎯 (2025-09-03)
📉 **Thesis:** FIG has strong revenue growth but *massive losses + heavy leverage*. Options flow shows **huge put OI at \$60** → market leaning bearish. Stock at **52-week lows** with weak momentum.
📊 **Trade Setup (Weekly Ear

FIG Figma Options Ahead of EarningsAnalyzing the options chain and the chart patterns of FIG Figma prior to the earnings report this week,
I would consider purchasing the 85usd strike price Calls with
an expiration date of 2025-10-17,
for a premium of approximately $2.67.
If these options prove to be profitable prior to the earnings
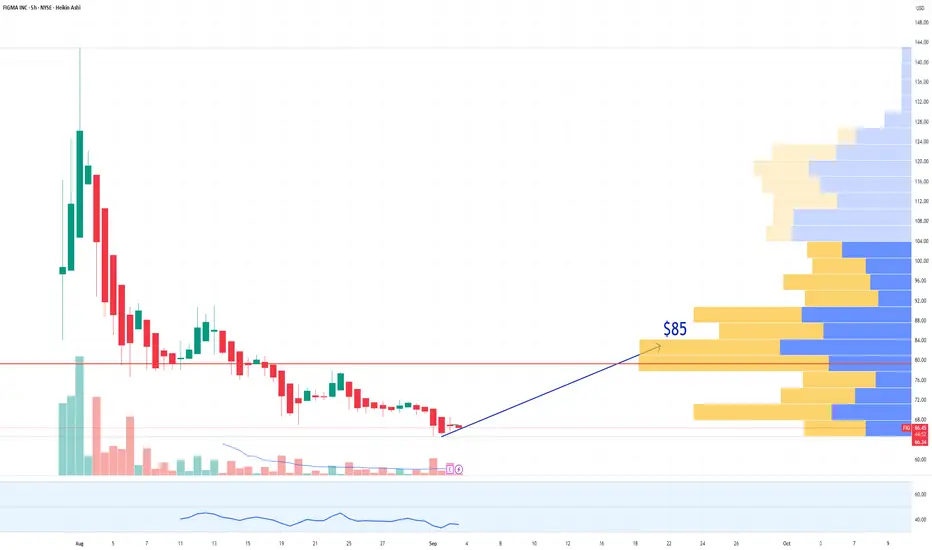
FIG Weekly Put Alert | $602Targeting Bearish Momentum
# 🔻 FIG Weekly Put Alert | Neutral-to-Bearish Setup (Sep 1, 2025) 📉
📊 **Summary:**
* Daily RSI 33.2 → rising from oversold 📈
* Weekly trend → bearish 📉
* Options flow neutral (C/P ≈0.95) ⚖️
* Volume weak (0.7x prior week) 📉
* Low VIX (\~15) → cheap premium 💵
👉 Consensus: **Most models wait**, on
Figma first potential support $68I saw a lot of conversation about FIG post IPO. I thought I would share a chart on where I assume first major support exists and where the potential top might be.
$68 is first major support area. It's not a guarantee, support could be much lower because of how high above IPO price this opened, but

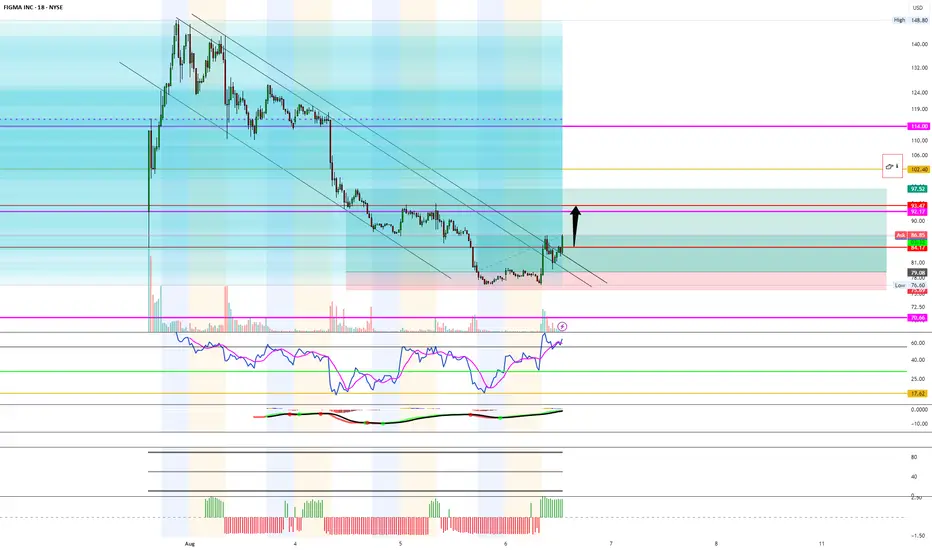
Just like WeBull... but more riskyAs we see from the chart we are breaking out of the downtrend and trying to find resistance.
The most important thing to watch is how the support is found when retesting, if any at all.
Key level for profit taking is at $96 and $102. Stay focused as it could lose support quick. But, from todays
FIGMA Grabbing Liquidity!!!
## ⚠️ FIG Swing Short Setup (2025-08-08) ⚠️
**Bias:** 📉 **Strong Bearish** — heavy put flow, weak trend, no momentum support.
**🎯 Trade Plan**
* **Ticker:** \ NYSE:FIG
* **Type:** PUT (SHORT)
* **Strike:** \$75.00
* **Entry:** \$4.80 (watch open, avoid chasing)
* **Profit Target 1:** \$7.20 (+5

See all ideas
An aggregate view of professional's ratings.
Neutral
SellBuy
Strong sellStrong buy
Strong sellSellNeutralBuyStrong buy
Neutral
SellBuy
Strong sellStrong buy
Strong sellSellNeutralBuyStrong buy
Neutral
SellBuy
Strong sellStrong buy
Strong sellSellNeutralBuyStrong buy
Frequently Asked Questions
Depending on the exchange, the stock ticker may vary. For instance, on BOATS exchange FIGMA INC stocks are traded under the ticker FIG.
We've gathered analysts' opinions on FIGMA INC future price: according to them, FIG price has a max estimate of 85.00 USD and a min estimate of 49.00 USD. Watch FIG chart and read a more detailed FIGMA INC stock forecast: see what analysts think of FIGMA INC and suggest that you do with its stocks.
Yes, you can track FIGMA INC financials in yearly and quarterly reports right on TradingView.
FIGMA INC is going to release the next earnings report on Dec 3, 2025. Keep track of upcoming events with our Earnings Calendar.
FIG earnings for the last quarter are 0.09 USD per share, whereas the estimation was 0.08 USD resulting in a 5.54% surprise. The estimated earnings for the next quarter are 0.05 USD per share. See more details about FIGMA INC earnings.
FIGMA INC revenue for the last quarter amounts to 249.64 M USD, despite the estimated figure of 248.62 M USD. In the next quarter, revenue is expected to reach 263.94 M USD.
FIG net income for the last quarter is 846.00 K USD, while the quarter before that showed 8.61 M USD of net income which accounts for −90.18% change. Track more FIGMA INC financial stats to get the full picture.
No, FIG doesn't pay any dividends to its shareholders. But don't worry, we've prepared a list of high-dividend stocks for you.
As of Sep 24, 2025, the company has 1.58 K employees. See our rating of the largest employees — is FIGMA INC on this list?
Like other stocks, FIG shares are traded on stock exchanges, e.g. Nasdaq, Nyse, Euronext, and the easiest way to buy them is through an online stock broker. To do this, you need to open an account and follow a broker's procedures, then start trading. You can trade FIGMA INC stock right from TradingView charts — choose your broker and connect to your account.