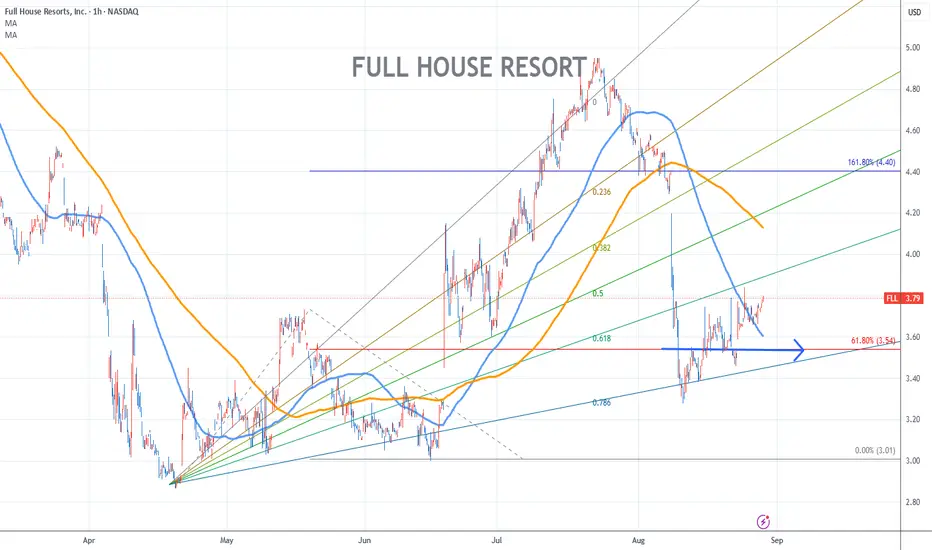
Full House Resort Stock Chart Fibonacci Analysis 082725Trading Idea
1) Find a FIBO slingshot
2) Check FIBO 61.80% level
3) Entry Point > 3.54/61.80%
Chart time frame:C
A) 15 min(1W-3M)
B) 1 hr(3M-6M)
C) 4 hr(6M-1year)
D) 1 day(1-3years)
Stock progress:A
A) Keep rising over 61.80% resistance
B) 61.80% resistance
C) 61.80% support
D) Hit the bottom
E
Next report date
—
Report period
—
EPS estimate
—
Revenue estimate
—
−1.12 USD
−40.67 M USD
292.06 M USD
33.39 M
About Full House Resorts, Inc.
Sector
Industry
CEO
Daniel R. Lee
Website
Headquarters
Las Vegas
Founded
1987
IPO date
Aug 10, 1993
Identifiers
3
ISIN US3596781092
Full House Resorts, Inc. engages in the ownership, leasing, development, operation, and management of gaming, hospitality, and entertainment facilities. It operates through the following segments: Mississippi, Indiana, Colorado, Nevada, and Contracted Sports Wagering. The company was founded on January 5, 1987 and is headquartered in Las Vegas, NV.
Related stocks
FLL - Flag, Long term Downward Channel - Long setupFLL - Here we have a bull flag pattern and a long-term channel pattern in play. And we have recent purchase from the CEO.

US Stock In Play: $FLL (Full House Resorts Inc)$FLL is gaining traction for an ATH push this week.
last 30 days up-down volume is at 200%. definitely in accumulation phase

FLL Rejection or Flag?Rejection on this line here. Maybe a flag formation as well? I feel bearish about this so I bought puts a bit ago, however I didn't really look into that much. Seems bullish to me more. However the rejection makes me think its bearish. Could go either way.

FLL PredictableFLL movement is very vertical. By that, I just mean that once it goes up it often REJECTS hard and plummets a single dollar and then goes back up in a week. I will paper trade this support and resistance and be watching that wedge to see if it's a thing I guess. I'm not really too sure about stuff s

NEW POSITION $FLL Target 11.92 for 21.88% $FLL Target 11.92 for 21.88%
Or next add level is at 7.64
OK... it's friday night and this one filled like right before 8pm so... here it is now... Looks like fun... look at those waves...
—
On the far right of the chart is my Average (Grey) Current Target (Green), and Next Level to add (Red)

Hot stock to buy for swing trading - symbol : FLLMPP TRADE IDEAS!!!
HOT STOCK TO BUY.
HOT STOCK ALERT ON TICKER:
FLL- Full House Resorts ING
PLAN:
BUY FLL NOW!
======================
ENTRY @ 7.55
TARGET @ 10.5
STOPLOSS @ 6.35
MPP - ALERTS FOR PROFIT AFTER PROFIT

$FLL Full House Resorts, Inc. 30% Upside Full House Resorts, Inc. engages in the ownership, leasing, development, operation, and management of gaming, hospitality, and entertainment facilities. It operates through the following segments: Silver Slipper Casino and Hotel, Bronco Billy's Casino and Hotel, Rising Star Casino Resort and Norther


$FLL - Bullish Zone, Trend Continuation. Looking GoodFull House Resorts, Inc. engages in the ownership, leasing, development, operation, and management of gaming, hospitality, and entertainment facilities. It operates through the following segments: Silver Slipper Casino and Hotel; Bronco Billy's Casino and Hotel; Rising Star Casino Resort; and Northe

See all ideas
An aggregate view of professional's ratings.
Neutral
SellBuy
Strong sellStrong buy
Strong sellSellNeutralBuyStrong buy
Neutral
SellBuy
Strong sellStrong buy
Strong sellSellNeutralBuyStrong buy
Neutral
SellBuy
Strong sellStrong buy
Strong sellSellNeutralBuyStrong buy
Displays a symbol's price movements over previous years to identify recurring trends.
FLL5126235
Full House Resorts, Inc. 8.25% 15-FEB-2028Yield to maturity
14.53%
Maturity date
Feb 15, 2028
See all FLL bonds
Frequently Asked Questions
Depending on the exchange, the stock ticker may vary. For instance, on BOATS exchange Full House Resorts, Inc. stocks are traded under the ticker FLL.
We've gathered analysts' opinions on Full House Resorts, Inc. future price: according to them, FLL price has a max estimate of 6.00 USD and a min estimate of 3.00 USD. Watch FLL chart and read a more detailed Full House Resorts, Inc. stock forecast: see what analysts think of Full House Resorts, Inc. and suggest that you do with its stocks.
Yes, you can track Full House Resorts, Inc. financials in yearly and quarterly reports right on TradingView.
Full House Resorts, Inc. is going to release the next earnings report on Mar 10, 2026. Keep track of upcoming events with our Earnings Calendar.
FLL earnings for the last quarter are −0.21 USD per share, whereas the estimation was −0.20 USD resulting in a −6.58% surprise. The estimated earnings for the next quarter are −0.23 USD per share. See more details about Full House Resorts, Inc. earnings.
Full House Resorts, Inc. revenue for the last quarter amounts to 77.95 M USD, despite the estimated figure of 76.70 M USD. In the next quarter, revenue is expected to reach 76.20 M USD.
FLL net income for the last quarter is −7.68 M USD, while the quarter before that showed −10.38 M USD of net income which accounts for 26.05% change. Track more Full House Resorts, Inc. financial stats to get the full picture.
No, FLL doesn't pay any dividends to its shareholders. But don't worry, we've prepared a list of high-dividend stocks for you.
As of Feb 1, 2026, the company has 2.01 K employees. See our rating of the largest employees — is Full House Resorts, Inc. on this list?
EBITDA measures a company's operating performance, its growth signifies an improvement in the efficiency of a company. Full House Resorts, Inc. EBITDA is 46.02 M USD, and current EBITDA margin is 16.62%. See more stats in Full House Resorts, Inc. financial statements.
Like other stocks, FLL shares are traded on stock exchanges, e.g. Nasdaq, Nyse, Euronext, and the easiest way to buy them is through an online stock broker. To do this, you need to open an account and follow a broker's procedures, then start trading. You can trade Full House Resorts, Inc. stock right from TradingView charts — choose your broker and connect to your account.