MSTR still bullish. MSTR bullishness is still intact but it should close above the upper yellow line for the bullishness confirmation intact. If that happens then there's a big possibility that we will see a big sharp last parabolic run to new ATH. Of course this is not financial advised.
If this failed then the last hope is on the Red Line.
Trade ideas

MSTR Weekly Alert: High-Risk Put Setup with Katy Conflict SignalMSTR QuantSignals V3 — Weekly Signal (2025-11-28)
Model: STR (V3 Weekly)
Expiry: 2025-12-05 (7 Days)
Direction: PUT (SHORT)
Confidence: 55% (Low-Moderate)
Risk Level: 🔴 HIGH
📈 Core Signal Data
Strike Focus: $175.00
Entry Range: $4.33
Target 1: $6.50
Stop Loss: $3.25
Weekly Momentum: BULLISH (+1.42% 1W)
Options Flow: Bullish (PCR 0.74)
Composite Bias: -0.17 (Neutral)
Volatility: Elevated (gamma-sensitive week)
⚠️ Note: This is a SPECULATIVE signal due to conflicting indicators and short expiration.
🎯 TRADE RECOMMENDATION
Direction: BUY PUTS
Confidence: 55%
Conviction Level: SPECULATIVE / HIGH-RISK
⚠️ KATY-LLM CONFLICT DETECTED
Type: DIRECTION Conflict
Severity: HIGH
LLM Recommendation: BUY CALLS
Katy Prediction: BUY PUTS (-4.19% projected move)
Katy Confidence: 50%
Forecast: Price decline toward $176.12 (-3.35%)
Signal Resolution:
Follow Katy’s direction — consistent bearish trajectory across 168 prediction points.
🧠 Analysis Summary
Katy AI Forecast
Neutral trend label but clear bearish price slope.
Forecast path shows persistent decline → $176.12 target.
50% confidence = neutral designation, but directionally consistent.
Technical Analysis
Bearish:
VWMA: -0.82%
Volume: 1.5× expansion → confirms selling
Bullish:
Weekly performance +1.42%
Key Levels:
Resistance: $184.97
Support: $176.12 (Katy target)
News & Macro
Neutral news environment.
MSTR remains heavily correlated to Bitcoin.
BTC holding key levels → may dampen downside or accelerate it.
Options Flow
PCR 0.74 → bullish flow bias
Highest volume at $110 calls → speculative, not strong directional commitment
Flow contradicts Katy’s bearish model

MSTR Falls into Major Support—Bounce coming soon??MSTR dropped into major support and printed a bullish divergence, hinting that sellers are exhausted. MSTR & Cryptos are highly correlated, and they look like they're shifting into a quiet accumulation phase after crypto's major correction following the big washout.
Entry: Accumulation on major support 180-150.
SL: if Major support break,.
TPs: 250 → 300
Setup invalid if support breaks.

Best Ways of Trading1. Trade with a Clear Strategy (Not Emotion or Guesswork)
One of the biggest mistakes new traders make is trading without a defined plan. The best way to trade is to follow a tested strategy. Some proven trading styles include:
a) Trend Trading
This approach involves identifying the overall market direction and trading in line with it. Trend traders use tools like moving averages (20, 50, 200), MACD, or trendlines to determine direction. The idea is simple:
“Trade with the trend until it ends.”
b) Swing Trading
Swing trading works best for people who cannot monitor markets all day. This approach aims to catch reversals or continuation moves over days to weeks. Traders look for key support/resistance, breakouts, and candlestick patterns.
c) Intraday Trading
Intraday traders look for small, high-probability moves within a single session. The best intraday setups come from volume spikes, VWAP, breakout zones, and strong trend days.
d) Momentum Trading
Momentum traders focus on stocks or instruments that show strong volume and price acceleration. When markets move rapidly in one direction, momentum traders ride the wave.
e) Options Trading
Options allow traders to profit using leverage and hedge positions. Buying calls and puts, selling options for premium, or using spreads can significantly enhance risk-reward profiles.
f) Algorithmic or Systematic Trading
A growing method that uses rules, automation, or AI-driven models. This reduces emotions and increases consistency.
The best traders select one main strategy and master it, rather than attempting everything.
2. Follow Multi-Time-Frame Analysis
Always confirm trades using multiple time frames. For example:
Long-term trend – weekly chart
Medium trend – daily chart
Entry timing – 15-minute or 5-minute chart
This prevents taking trades against the broader market direction. When all time frames align, the probability of success increases dramatically.
3. Master Risk Management (The Heart of Successful Trading)
Even the best strategy fails without proper risk control. The strongest traders treat risk management as the core of their system.
a) Risk per Trade
Smart traders risk 1–2% of their capital on any single trade. This helps avoid catastrophic losses.
b) Stop-Loss Use
Always define where the trade is wrong and set a stop-loss accordingly. A systematic stop-loss protects capital and preserves longevity.
c) Position Sizing
Your position size should be based on your risk per trade and stop-loss distance, not on emotions or random judgment.
d) Risk-to-Reward Ratio (RRR)
Successful traders aim for at least 1:2 or 1:3 RRR.
This means:
If you risk ₹1, you target ₹2 or ₹3.
e) Avoid Overtrading
One of the most common reasons traders lose money is taking too many trades. Quality beats quantity.
Risk management is the backbone of consistent long-term profitability.
4. Use Technical and Fundamental Analysis Together
The best trading approach usually combines elements of both.
Technical Analysis helps with:
Timing entry and exit
Understanding trend structure
Recognizing chart patterns
Interpreting market psychology
Key indicators include RSI, MACD, Bollinger Bands, moving averages, and volume-based tools.
Fundamental Analysis helps with:
Identifying long-term direction
Understanding earnings, interest rates, inflation
Recognizing geopolitical and macroeconomic risks
Selecting strong long-term stocks or commodities
A trader who understands both sides sees the market differently and more accurately.
5. Develop Strong Trading Psychology
The market is a psychological battlefield. The best traders keep emotions under control. Some core psychological frameworks include:
a) Discipline and Patience
Only take setups that match your strategy. Good traders wait for the right moment.
b) Emotion Control
Fear and greed destroy accounts. The best way to avoid emotional decisions is to follow a rule-based system.
c) Accepting Losses
Even top traders lose 40–50% of trades. Losses are part of the game. The goal is to keep them small.
d) Avoiding the “Revenge Trade” Trap
Never attempt to win back losses instantly. This leads to impulsive decisions and bigger losses.
Mastering psychology is as important as mastering charts.
6. Backtest and Forward-Test Your Strategy
Before risking real money, test your strategy historically (backtesting). Check:
Win rate
Average gain vs average loss
Maximum drawdown
Consistency during different market conditions
Follow this with paper trading to see real-time behavior. A strategy that performs well in backtests and paper trading has higher chances of success in real markets.
7. Use Technology to Your Advantage
Modern trading has advanced tools:
Algorithmic screeners
Charting platforms
AI-driven market sentiment analysis
Automated alerts
Portfolio trackers
Order execution bots
Technology increases efficiency and reduces human error.
8. Follow Market Cycles and Global Trends
Markets move in cycles: accumulation, uptrend, distribution, correction.
Understanding economic cycles, liquidity conditions, central bank policy, and geopolitical events helps you choose the right instruments and strategies.
For example:
High inflation phase → commodities tend to outperform
Low interest rates → equities rally
Geopolitical tensions → gold, USD strengthen
Trading in sync with macro trends improves accuracy.
9. Diversify Your Trading Portfolio
Do not rely on one asset or one market. Trade multiple instruments (equities, commodities, indices, currencies) to reduce risk. A diversified portfolio smoothens performance and reduces emotional pressure.
10. Keep a Trading Journal
A trading journal is one of the most effective tools for improvement. Record:
Entry & exit levels
Strategy used
Reason for trade
Emotions felt
Result and analysis
Review your journal weekly. It reveals patterns in your behavior, helping you correct mistakes and become a more consistent trader.
Conclusion: What Is the Best Way of Trading?
There is no one “best way,” but the best traders combine:
A clear, tested strategy
Multi-time-frame confirmation
Strong risk management
Mastered psychology
Smart use of technology
Discipline in execution
Trading is not about predicting the future; it's about managing risk, following a system, and staying emotionally stable. If you approach it scientifically and patiently, you can achieve long-term success in any market.

MSTR long-term TAStrategy is strictly bearish, and it's been bearish since the end of September, there's no bottom as of yet, it's hard to tell when will it stop falling, the blue lines is an approximate channel for consolidation but we need more time to see.
Due to excessive selling it may have a small jump in a short-term but it needs way more time to stop falling.

$MSTR ..Houston we’ve found a support NASDAQ:MSTR , MSTR went from trading at 400 times bitcoin value to less than 1(slightly) book to value. And it Happened suspicously while hitting the volume profile point of control.

The Impact of Multinational Corporations (MNCs) on Trading1. Driving International Trade Growth
MNCs are major engines of global trade. By establishing operations in multiple countries, they create a demand for goods, services, and capital across borders. Their activities often lead to the creation of intricate global supply chains where raw materials, intermediate goods, and finished products move seamlessly between countries. For example, an automobile company headquartered in Germany may source parts from Japan, assemble vehicles in Mexico, and sell them in the United States. This not only increases the volume of trade but also diversifies trade patterns, creating new economic linkages between nations.
MNCs often promote exports from developing countries by investing in local manufacturing plants. This stimulates local economies, generates employment, and enables these countries to integrate into global markets. Countries like China, Vietnam, and India have benefited significantly from MNC-led trade, seeing their export sectors expand dramatically due to foreign direct investment (FDI) from multinationals.
2. Influence on Market Structure and Competition
MNCs can reshape trading markets by altering competitive dynamics. Their size, access to advanced technology, and global networks give them a competitive advantage over domestic firms. This can create efficiencies in production, logistics, and distribution, often resulting in lower costs for consumers. For instance, multinational retail corporations like Walmart or Amazon leverage economies of scale to offer goods at prices that domestic competitors may struggle to match.
However, MNC dominance can also lead to market concentration, where a few large players control significant shares of certain markets. This has implications for trade policies, as governments may feel pressured to create favorable conditions for MNCs to attract investment, sometimes at the expense of local businesses. Thus, while MNCs enhance efficiency and expand trade, they can also introduce competitive challenges for smaller domestic firms.
3. Shaping Global Supply Chains
The operations of MNCs often dictate global supply chain structures, which have a direct impact on trading patterns. Companies like Apple, Samsung, and Toyota rely on a network of suppliers and manufacturers spread across continents. These supply chains facilitate the cross-border movement of intermediate goods, raw materials, and components, which in turn drives international trade.
Moreover, MNCs play a critical role in setting global standards for quality, production, and logistics. By enforcing uniform standards across their global operations, they encourage trading partners to adopt similar practices, thereby enhancing trade efficiency and reliability. However, dependence on MNC-driven supply chains can also create vulnerabilities. For example, disruptions in one region—like a natural disaster or geopolitical tension—can impact global trade flows significantly, as seen during the COVID-19 pandemic when supply chains were severely affected.
4. Technological Transfer and Innovation in Trade
MNCs are often at the forefront of technological innovation. Through their international operations, they transfer knowledge, skills, and technologies to host countries, impacting trading patterns. For instance, a multinational in the electronics sector may establish a research and development (R&D) center in a developing country, equipping local talent with advanced technological know-how. This technology transfer often enhances local production capabilities, enabling these countries to produce goods for export that meet international standards.
Additionally, MNCs introduce advanced management practices, logistics solutions, and production techniques, which improve efficiency and productivity in trade operations. Over time, these innovations contribute to the growth of trade volumes and the development of competitive export sectors in host countries.
5. Impact on Foreign Exchange and Financial Markets
MNCs’ global operations have a significant influence on currency markets and international finance. Their cross-border transactions in goods, services, and capital flows impact foreign exchange demand and supply. For instance, a U.S.-based multinational importing raw materials from India would need to convert dollars into Indian rupees, thereby affecting currency exchange rates. Large-scale operations of MNCs can thus introduce volatility into foreign exchange markets, influencing trade competitiveness and pricing.
Furthermore, MNCs often participate in international capital markets through foreign direct investment (FDI), portfolio investment, or borrowing in foreign currencies. These activities facilitate global financial integration and enhance liquidity in international trade financing. Their investments can also affect trade balances by increasing exports from host countries or boosting imports to supply their global production networks.
6. Influence on Trade Policies and Agreements
Governments often design trade policies to attract or regulate MNC activity. Many countries offer tax incentives, reduced tariffs, and favorable regulatory environments to encourage MNC investments. Consequently, MNCs influence trade policies and international trade agreements. For example, the presence of MNCs in a country may motivate it to negotiate bilateral or multilateral trade agreements that facilitate smoother export and import flows.
Additionally, MNC lobbying can impact international trade rules, including labor standards, environmental regulations, and intellectual property protections. By shaping the regulatory environment, MNCs indirectly affect the flow of goods and services across borders, promoting trade liberalization in some cases while creating barriers in others.
7. Risks and Challenges Introduced by MNCs
While MNCs boost global trade, they also introduce challenges. Overreliance on multinational corporations can make countries vulnerable to global economic shocks, such as sudden shifts in investment flows or supply chain disruptions. The dominance of MNCs in certain sectors can stifle domestic entrepreneurship, reducing the diversity of trade sources. Additionally, ethical concerns related to labor practices, environmental sustainability, and profit repatriation can complicate trade relations.
Global trade is also affected by political tensions involving MNCs. For instance, disputes between home and host countries over taxation, tariffs, or sanctions can disrupt trade flows, highlighting the complex interplay between multinational operations and international commerce.
8. MNCs and the Future of Global Trade
Looking ahead, MNCs will continue to be central to trading patterns. Emerging technologies like artificial intelligence, blockchain, and automation will enable more efficient global logistics and trade tracking. MNCs will likely invest in sustainable and green supply chains, aligning with international environmental standards, which will influence the type of goods traded and the countries involved.
Moreover, geopolitical shifts, trade wars, and regional economic blocs will affect how MNCs structure their operations, creating new trade corridors while potentially reducing reliance on certain markets. Their strategic decisions will continue to have far-reaching implications for global trade, economic growth, and international financial stability.
Conclusion
Multinational corporations have fundamentally transformed international trade. By driving global supply chains, influencing market structures, transferring technology, and shaping trade policies, MNCs create opportunities and challenges for countries around the world. Their operations stimulate economic growth, expand trade volumes, and integrate emerging markets into global commerce. At the same time, their dominance introduces risks such as market concentration, supply chain vulnerabilities, and ethical concerns. Understanding the nuanced impact of MNCs is critical for policymakers, investors, and businesses seeking to navigate the complexities of global trade.
In essence, MNCs act as both facilitators and influencers of trade. Their strategies and decisions resonate across borders, shaping not only the flow of goods and services but also the broader economic and political environment in which international commerce occurs. As globalization evolves, the role of MNCs in trading will remain a defining factor in the architecture of the global economy.
Close of the ENDLast price of MSTR could be between
$100-$80.
It will take more benefics and star a change of tendence.

QuantSignals V3 | Katy AI Contrarian MSTR Weekly PUT QuantSignals V3 Weekly Date: 2025-11-26
Current Price: $179.00
Weekly Momentum: Bullish (+4.27%)
Flow Intel: Bearish (PCR 6.20)
Trend: Mixed / Conflict
Trade Signal: PUT
Recommended Strike: $175.00
Entry Range: $1.91 – $2.05
Target 1: $3.50 (75% gain)
Target 2: $4.50 (125% gain)
Stop Loss: $1.20 (40% loss)
Confidence: 58%
Position Size: 2% of portfolio
Expiry: 2025-11-28 (2 days)
Analysis Summary:
Katy AI predicts a bearish trajectory (-1.32%) with 168-point prediction series showing consistent downside momentum.
Overbought RSI at 81.6 and 86% of weekly range high suggest potential reversal.
Contradiction exists: Weekly momentum bullish but Katy AI and extreme PCR indicate bearish pressure.
Options flow shows heavy institutional put buying (PCR 6.20).
Risk level: Medium-High due to conflicting signals.
Key Notes:
Tight 2-day expiry limits time decay risk.
Conservative stop protects against unexpected bullish breaks above $181.68.
High-risk trade—use small position size due to uncertainty.

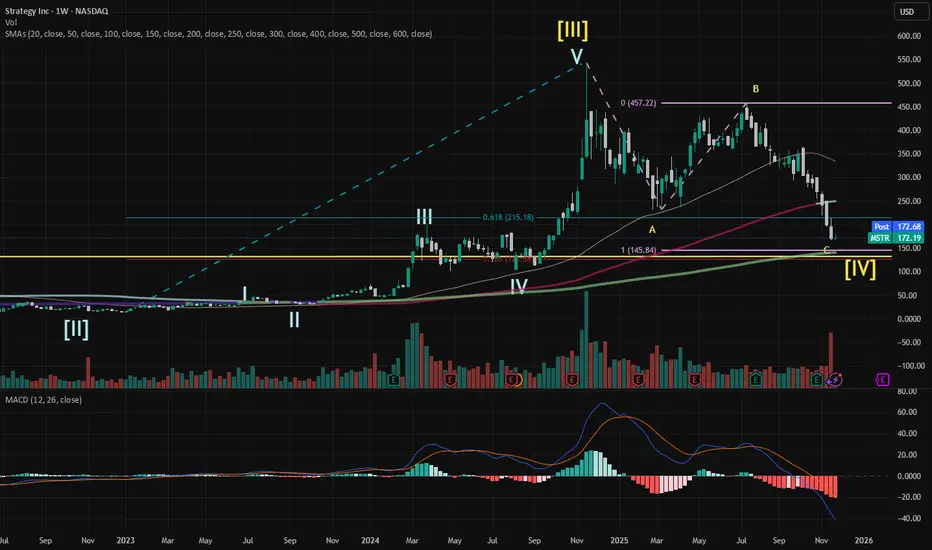
$MSTR: AB = CD is around $145NASDAQ:MSTR completed Wave in Nov 2024 and has been in Wave correction since. Elliott Wave theory states that often the correction will enter the zone of Wave 4 of one lesser degree, i.e., Wave III-Wave IV area of Wave . This corresponds to $200 in March 2024 and $102 in August 2024 (a 50% drop for Wave IV!).
Presently, MSTR at $172 already entered the top of that zone., AB = CD for the flat correction gives $145, which is right in the middle of this zone. $145 also is just above the 78.6% retracement.
This count is invalidated if MSTR drops below Wave top achieved in Feb 2021 at $131.50.
I don't believe MSTR will drop below $131.50 but hitting AB = CD at $145.84 is likely, which would probably correspond to CRYPTOCAP:BTC = $78K.
I don't own MSTR and don't plan to trade this name. If CRYPTOCAP:BTC drops to $78K, I plan to add to my position.
MSTR Swing Watch: Bullish Momentum AheadMSTR QuantSignals Katy 1M Prediction 2025-11-25
Ticker: MSTR
Signal Type: 1-Month Short-Term Prediction
Direction: CALL (LONG)
Confidence: 63.8% (Medium conviction)
Current Price: $168.47
Entry: $168.47
Target 1: $171.25
Final Prediction: $171.95 (+2.07%)
30min Target: $172.28 (+2.26%)
Stop Loss: $165.94
Expected Move: +2.07%
Volatility: 46.9%
Trend: BULLISH
🧠 Key Technical & Chart Insights
Support/Resistance:
Support: $165.94
Resistance: $172.28
Trend Context: Short-term bullish momentum confirmed by Katy AI prediction and moderate confidence level.
Volatility: High implied volatility (46.9%) indicates potential for rapid movement within the 1-month horizon.
🎯 Trade Rationale
Entry at $168.47 aligns with Katy AI’s short-term bullish projection.
Stop Loss at $165.94 manages downside risk.
Target at $171.25–$171.95 provides ~2% potential upside.
Confidence moderate; position sizing should reflect risk tolerance.
⚠️ Key Risks
High volatility environment may trigger short-term swings.
Stop loss should be strictly followed to manage downside.
Market news and crypto sector sentiment may impact MSTR’s short-term trend.

MSTR Downside Setup: Oversold Momentum + Extreme PCR Warns of Dr
Ticker: MSTR
Current Price: $173.42 (near weekly high)
Signal Type: Weekly (V3)
Direction: PUT (Short)
Confidence: 65%
Conviction: Medium
Weekly Momentum: BEARISH (-3.75% 1W)
Options Flow / PCR: Extremely bearish | PCR 7.23
Risk Level: Moderate
🎯 Trade Setup
Strike: $155 PUT
Expiry: 2025-11-28 (3 days)
Entry Range: $1.19 – $1.29
Target 1: $2.50 (110% gain)
Target 2: $3.20 (170% gain)
Stop Loss: $0.85 (30% risk)
Position Size: 2.5% of portfolio
🧠 Key Insights
Katy AI shows initial bearish pressure but ultimate bullish target at $173.42 — conflicting signals
Technicals: Oversold RSI at 14.5, trading near weekly low, support at $165.60, resistance $173–175
Options Flow: Heavy institutional put buying; unusual activity suggests strong short-term bearish conviction
News Sentiment: Mixed crypto outlook; recent Bitcoin/Ethereum moves provide some indirect support for MSTR
⚠️ Notes
Moderate risk due to Katy conflict — short-term bearish momentum dominates over delayed bullish AI target
Tight stops recommended; monitor recovery toward $173+ for potential reversal

Quant Signals V3: MSTR Downside Momentum TradeMSTR Weekly (QuantSignals V3 | 2025-11-24)
Direction: BUY PUTS
Confidence: 65%
Expiry: 2025-11-28 (4 days)
Strike Focus: $167.50
Entry Range: $6.75 – $7.15 (mid: $6.95)
Target 1: $10.73 (≈60% gain)
Target 2: $13.43 (≈100% gain)
Stop Loss: $4.85
Position Size: Medium / reduce due to moderate confidence
Weekly Momentum: NEUTRAL (–0.08% 1W)
Put/Call Ratio: 2.13 (Bearish)
Flow Intel: Bearish / institutional put buying
Risk Level: ⚠️ Moderate – conflicting signals
Current Price: ~$173.06
📈 Technical Overview
VWAP: $177.30 → price below VWAP suggests potential downside
Weekly range position: 23.1% → room to move down
Support: $166.00 (session low)
Resistance: $177.30 (VWAP)
24h Price Move: –6.46%
Trend: Conflicting signals — Katy AI bullish prediction vs bearish flow & news
Chart Tips:
Draw support at $166.00 and resistance at $177.30
Highlight entry band $6.75–$7.15
Mark targets $10.73 / $13.43 and stop $4.85
Monitor Bitcoin correlation and news catalysts
📰 Fundamental / Sentiment Notes
Bearish news pressure: BTC –6.4%, JPMorgan caution
Sector uncertainty, Michael Saylor defense statements
Options flow shows strong institutional put buying
⚠️ Risk Notes
Conflicting signals: Katy AI bullish vs bearish technicals & flow
Medium conviction → consider smaller position size
Monitor for volatility spikes around crypto-related news

Saylor’s Company Is at the Center of a Global Index Shock📉 MSCI vs Strategy: Why Michael Saylor’s Company Is at the Center of a Global Index Shock — And What It Means for Bitcoin
Over the past few weeks, one of the most important developments for both equities and crypto has quietly unfolded: MSCI, the world’s largest index provider, has started questioning whether Strategy (formerly MicroStrategy) should continue to be included in its global equity indices.
This is not a small technical issue.
This is a structural threat with potentially billions of dollars in forced selling, massive volatility for Strategy’s stock, and real implications for Bitcoin’s price trajectory.
Here’s the complete
breakdown 👇
🔍 What Triggered the MSCI Review?
MSCI launched a consultation on how to treat companies that keep the majority of their balance sheet in digital assets (mainly Bitcoin). They call these firms:
► Digital Asset Treasury Companies (DATs)
Strategy currently sits at the top of this category with over 200,000 BTC on its books.
MSCI’s concern is simple:
> “Is Strategy still an operating software company,
or has it effectively become a Bitcoin investment vehicle?”
If it is considered “fund-like,” it may no longer qualify for inclusion in traditional equity indices.
💥 Why This Matters
MSCI’s global indices are tracked by trillions of dollars in passive funds.
If Strategy is removed:
► Passive funds must sell Strategy
► Estimated forced selling: $2.8B – $8.8B
► This could trigger a violent liquidity shock in the stock
JPMorgan has already warned of large, inevitable outflows if MSCI finalizes the removal.
Timeline:
Consultation ends: Dec 31, 2025
Decision: Jan 15, 2026
Implementation: Feb 2026 index rebalance
This is now one of the most significant upcoming market catalysts for both Strategy’s stock and Bitcoin.
🧩 How This Impacts Strategy Stock (STRAT / MSTR)
The possible outcomes:
1. MSCI Removes Strategy (Bearish Scenario)
Forced selling by index funds
Stock drops 35–60%
Capital raising becomes harder
Leverage strategy weakens
Narrative shifts from “corporate Bitcoin champion” to “deindexed crypto proxy”
This is the worst-case scenario for Strategy shareholders.
2. MSCI Keeps Strategy but Reclassifies (Neutral Scenario)
Some hedging, light selling
Stock dips 10–20%
But no structural damage
Market adjusts and stabilizes
3. MSCI Fully Accepts Strategy (Bullish Scenario)
Relief rally
Stock jumps 20–40%
Strategy strengthens its identity as the “corporate Bitcoin standard”
Major buying flows from passive funds
This would be a massive validation for Saylor’s Bitcoin-centric business model.
₿ How This Affects Bitcoin
Strategy has become a de facto synthetic Bitcoin ETF:
Stock rises → Strategy borrows more → buys more BTC
Stock falls → borrowing becomes expensive → Bitcoin buying slows
A deep crash → market fears forced BTC selling
Under bearish MSCI outcome:
BTC likely drops 5–15% on fear
Leverage unwinds
Sentiment weakens temporarily
Under bullish MSCI outcome:
BTC gains 3–7%
Institutional confidence strengthens
More corporates may consider a Bitcoin treasury strategy
🔄 The Reflexive Feedback Loop
At the heart of this story is a powerful feedback loop:
Strategy stock → borrowing capacity → BTC accumulation → stock valuation → investor demand
MSCI’s decision can break or accelerate this loop.
This is why the market is watching this event very carefully.
📊 Quick Summary Table
MSCI Outcome Strategy Stock Bitcoin Sentiment
❌ Remove –35% to –60% –5% to –15% Fear
⚠️ Reclassify –10% to –20% –1% to –3% Neutral
✔️ Keep +20% to +40% +3% to +7% Bullish
🧠 Final Thoughts
Whether you’re a Bitcoin investor or an equity trader, this MSCI review is far more than a technical classification issue. It is a macroeconomic event that could:
Move billions in passive capital
Impact the largest corporate Bitcoin holder
Shape the future of Bitcoin treasury strategies
Affect volatility across BTC, NASDAQ, and crypto markets
The coming months will decide whether Strategy becomes:
⚡ A globally recognized corporate-Bitcoin pioneer,
or
⚠️ A de-indexed, fund-like crypto vehicle under regulatory pressure.
Either way, this is one of the most important long-term catalysts to watch.

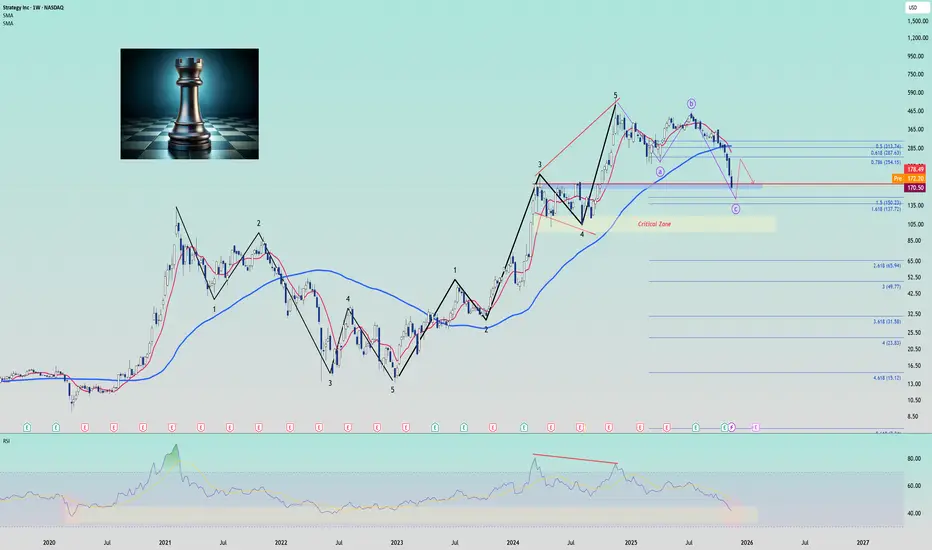
MSTR Chess Game: When Smart Money Plays Against Saylor!
Did you play chess before?
For me, i started playing it in the past 3 days, and even though i reached a nice speed rank, the performance and game review still show the blind movement! And this is EXACTLY what Saylor is doing! Let me show you the data:
He bought $1.5B at $52K (March), then added $3B at $60K+ (November) - always buying the momentum, not the value! Now MSTR down -50% from $360 while BTC only -10%... You see the pattern?!
Weeks ago (Oct 1, around $360) i told my friend, "If I play with 1-2, I will say this guy is ass*** and i will try to cost him a loss, and i will play the game to make him buy my sells then rekt him and buy his loss."
Just a few weeks and here we are! MSTR losing -50% and BTC run to his buy AVG $74K, yes, he is still in a safe zone, but the real game starts now!
The Technical Setup (this is where it gets interesting!):
So i use multiple methods - GANN 50% retracement hitting at $145, Fibonacci Golden Pocket at $152-163, and Volume Profile showing the highest trades at $147. Even RSI at 28 is showing divergence while price is making new lows!
Here's my trade plan:
Entry Zone: $145-155 (I'm scaling in here!)
Target 1: $183 (taking 25% off)
Target 2: $190 (another 50% off)
Stop Loss: $139 (below monthly support)
Risk/Reward: 1:2.8 (this is a beautiful setup!)
But wait, there's more data!
The correlation is crazy:
MSTR/BTC: 0.84 correlation
BTC/NDQ: 0.72 (and rising!)
If MSTR breaks $140, we could see BTC at $83-79K and NDQ dropping 5-8%!
Will Saylor survive? Here's the math:
BTC needs to hit $29K for margin calls - that's NOT happening!
He has $3.2B in unencumbered BTC
Bonds not due until 2027-2029
His software business still makes $50M quarterly.
So he plays it nicely, and the team behind still has more to do! Strategic Bitcoin Reserve talks, Gensler leaving, Q1 2025 crypto regulations - they're doing their best to make everything hold!
The sentiment data (this is golden!):
Fear & Greed: 25 (Extreme Fear)
Put/Call ratio: 2.3 (highest since 2022!)
Social volume: -78% last 7 days
You know what this means?! Smart money accumulating while retail panicking!
My analysis using:
GANN boxes on log scale (this is KEY!)
Custom MA ribbons with volume weighting
Multi-timeframe RSI divergence
Fibonacci zones from multiple swings
So what's the play?!
If you're conservative:
Wait for the weekly close above $180
Scale by 25% at a time
Use BTC/GOLD as a hedge
If you're aggressive like me:
Accumulate $145-155 NOW +2% invest
Sell $190+225 calls for income
Consider the BTC/MSTR pair trade
Next 30 days watch:
Monthly close Dec 31 (CRITICAL!)
Q4 BTC purchases announcement
Fed meeting Jan 29
MSTR earnings Feb 3
Anyway!
Would MSTR be saved now and rebound?! YES!
Professional accumulation is happening at these levels - the risk/reward is too good!
they do their best to make everything hold, the system is upgraded, the thinking scale has become faster than your mind now!
So, we're all here to make profits, and i wish i could short MSTR at $360, but now I'm buying!
if you like what you read and what you see, please press the like button, and your comments are welcome
Thanks, tradingview, for giving me a space here!
we ask Allah to reconcile and repay
#MSTR #Bitcoin #CryptoTrading #Saylor
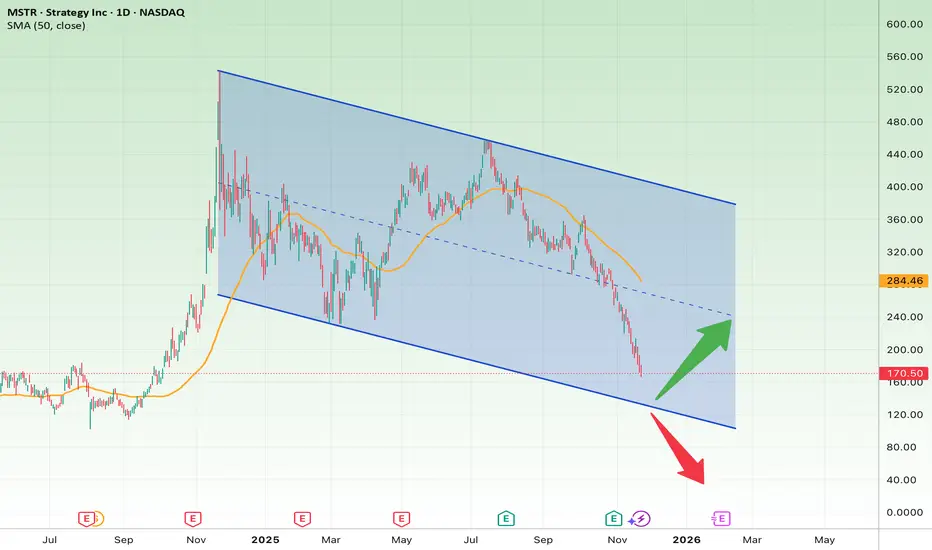
MSTR at a Breaking Point: Reversal Rally or a Deep Breakdown?The chart shows MSTR trading inside a large descending channel, with price now approaching the bottom boundary of the channel — a zone where strong reactions usually occur. The recent sell-off has been steep, indicating the stock is potentially oversold at current levels.
1. Key Support (Bottom of Channel)
• Major support: $150 – $160
This is the lower boundary of the descending channel and the most important level on the chart.
2. Bullish Scenario (Green Path)
If MSTR finds support at the bottom of the channel:
• Price may bounce toward the midline of the channel around $230 – $240.
• If momentum continues, the next key resistance is near the 50-day SMA and upper channel resistance at $280 – $300.
3. Bearish Scenario (Red Path)
If price breaks below the channel:
• A sharp decline toward $100 – $120 becomes likely.
• This is the next major support zone below the channel.
Bullish Targets
• TP1: $230
• TP2: $280
• TP3 (extended target): $320
Bearish Target
• TP (Downside): $120
Stop-Loss
• A daily candle closing below $150
This would confirm a breakdown from the channel and invalidate the bullish setup.
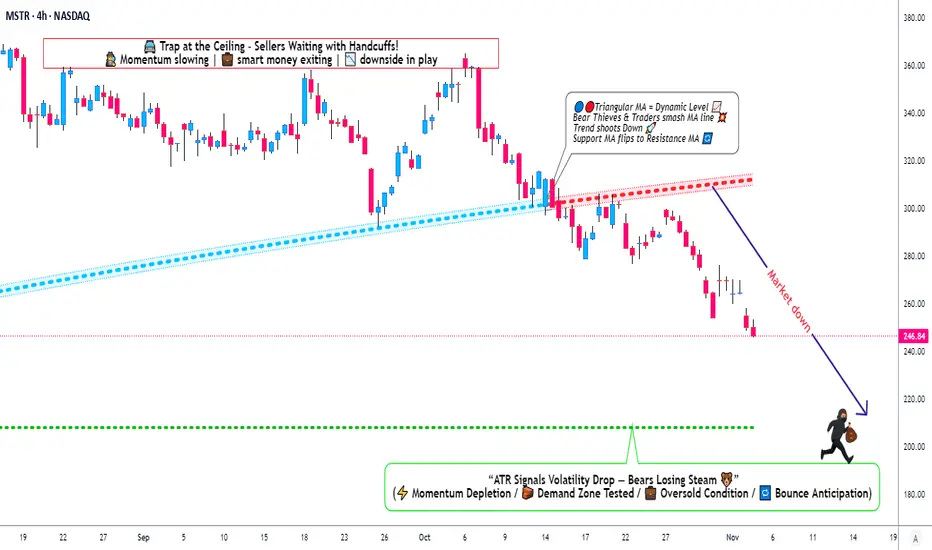
MicroStrategy Under Pressure: Bearish Playbook in Action🎯 MSTR: The "Thief's Playbook" - Strategic Bear Trap Setup! 💰🔥
📊 Asset Overview
MicroStrategy Inc. (MSTR) - Bitcoin's Proxy Play in the Stock Market
🎭 The Setup: When Bears Come to Party
Alright folks, gather 'round! We've got ourselves a textbook triangular moving average breakdown on MSTR that's screaming "short opportunity" louder than my portfolio after a bad trade week! 😅
Current Market Sentiment: 🐻 BEARISH CONFIRMED
The technicals are aligning like planets before a lunar eclipse - and trust me, this eclipse might cast some shadows on those long positions!
🎯 The "Thief Strategy" Game Plan
🚪 Entry Zones - The Layering Approach
Here's where it gets spicy! 🌶️ Instead of going all-in like a degen at a casino, we're using the "Thief Layering Method" - multiple limit sell orders to scale into this position:
Suggested Entry Layers:
🥇 Layer 1: $300
🥈 Layer 2: $290
🥉 Layer 3: $280
💎 Layer 4: $270
🔥 Layer 5: $260
Pro Tip: You can add MORE layers based on your risk appetite and account size. More layers = Better average entry = Smoother sleep at night! 😴
🛡️ Risk Management - The "Oh Sh*t" Line
Stop Loss: 🚨 $320
⚠️ IMPORTANT NOTICE: Dear Thief OGs, Ladies & Gentlemen! This SL is MY line in the sand. YOU need to decide YOUR own risk tolerance. Trade at your own risk, manage your own money, and don't blame me if things go sideways! This ain't financial advice - it's entertainment with charts! 🎪
🎁 Target Zone - Where We Cash Out
Take Profit Target: 🎯 $210
Why $210?
💪 Strong historical support level
📉 Oversold territory expected
Classic bull trap zone where longs get liquidated
⚠️ ANOTHER IMPORTANT NOTICE: Thief OGs! This is MY target. You do YOU! If you see profits earlier and want to secure the bag - DO IT! Don't be greedy. Take profits when YOU feel comfortable. Your account, your rules, your responsibility! 💼
🔗 Related Assets to Watch - The Correlation Game
Keep your eyes on these bad boys for confirmation:
📈 Direct Correlations:
NASDAQ:MARA (Marathon Digital) - Bitcoin miner, moves with crypto sentiment
NASDAQ:RIOT (Riot Platforms) - Another BTC miner, similar volatility pattern
NASDAQ:COIN (Coinbase) - Crypto exchange, sentiment indicator
CRYPTOCAP:BTC (Bitcoin spot) - The godfather! MSTR holds massive BTC, direct correlation
🧠 Key Points:
MSTR trades with ~1.5x-2x Bitcoin beta (more volatile than BTC itself)
When Bitcoin dumps, MSTR often dumps HARDER 📉
Watch BTC support at $60K - if it breaks, MSTR likely follows to our target zone
Tech sector weakness ( NASDAQ:QQQ , AMEX:SPY ) adds bearish pressure
⚡ Trading Psychology - The "Thief Mindset"
Look, this setup requires PATIENCE! 🧘♂️ Don't FOMO in at market price. Layer in like a professional thief planning a heist - calculated, methodical, strategic! This isn't gambling; it's probability management with a side of humor! 😎
🎪 Final Word from Your Friendly Neighborhood Chart Thief
Remember: Markets are wild, unpredictable, and don't care about your feelings OR your bills! This analysis is for educational and entertainment purposes ONLY. The "Thief Strategy" is MY trading style - it's risky, it's aggressive, and it's definitely NOT for everyone!
Do your own research. Manage your own risk. Trade what you can afford to lose. And for the love of all that's holy, don't mortgage your house based on some random internet chart analysis! 🏠❌
✨ If you find value in my analysis, a 👍 and 🚀 boost is much appreciated — it helps me share more setups with the community!
🏷️ #MSTR #MicroStrategy #ShortSetup #BearishBreakdown #SwingTrade #DayTrade #ThiefStrategy #BitcoinStocks #TechnicalAnalysis #MovingAverageCrossover #LayeringStrategy #RiskManagement #StockMarket #TradingIdeas #BTC #CryptoStocks #BearTrap #SupportAndResistance #ChartAnalysis #TradeSmart
🎯 Trade smart, layer in, manage risk, and may the profits be ever in your favor! 💰🚀
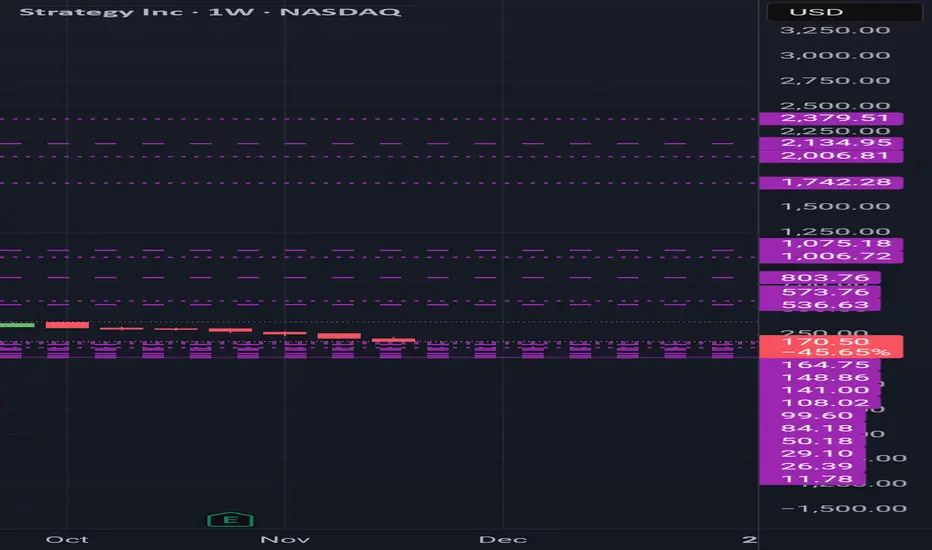
DECODED ANALYSIS STRATEGY (MSTR)MSTR is currently in the second phase of its second quarterly grand cycle, with a long way to complete this cycle.
Currently near upper support at $164.75,
⭐Pattern support is noted at $141, and if this pattern support breaks, than next
support noted at $108.2.
Multiple skip supports are noted at $29.1 and lowest at $11.78,
After correcting, a huge pump will occur,
Resistance for 2026, 2027 are noted at $536.63, $573.76, $803.76, $1006.72, $1075.18,
Resistance for 2030 are noted at $1742.28, $2006.81, $2134.95, $2379.51,
Resistance for 2034, 2035 are noted at $6046.67, $6979.31,
Important note, all my analysis is based strictly on actual factual supports and resistance with no predictions,
This message is for educational purposes only.
Always DYOR.
Where It Started — Retail Never Heard the MSCI Whispers⚡️ Where It Started — The Perpetual Offering Nobody Took Seriously (MSCI Was Only Whispers Back Then)
🌐 Referenced Tweet (Announcement of the Perpetual Preferred Offering):
x.com
⸻
⚡️ The Moment No One Realized Was the Start
When this perpetual preferred offering was announced, retail shrugged it off.
But this tweet was the first real signal that something bigger was shifting beneath the surface.
At that moment:
• The MSCI exclusion risk was only industry whispers
• Retail had zero clue
• Macro liquidity was tightening
• Crypto-heavy balance sheets were getting risky
• Companies were quietly positioning early
This offering wasn’t loud.
It wasn’t marketed as defensive.
But it was — and now the charts expose exactly what they were preparing for.
⸻
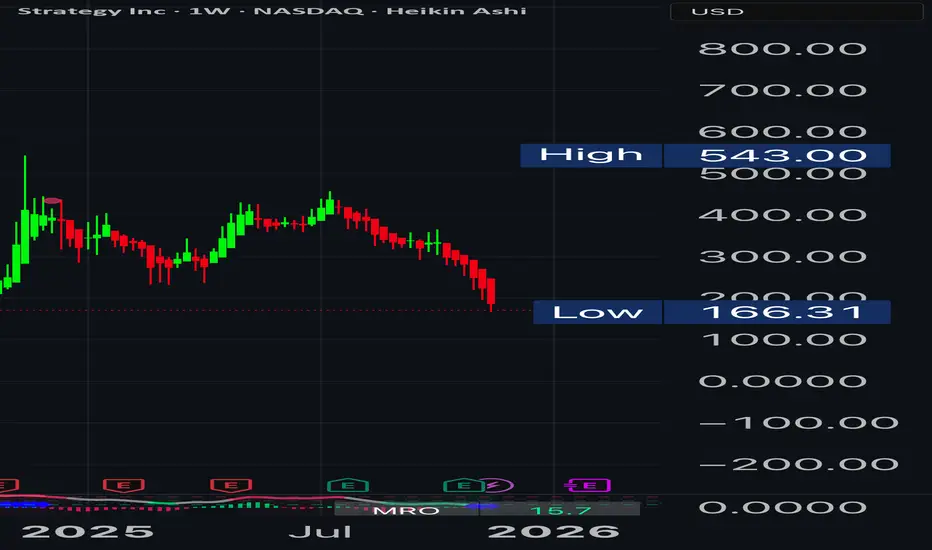
📉 MSTR Weekly (June ’25 → Now)
• Peak near $543
• Now near $374
• Low of $166
• Multi-month distribution
• Slow, steady derisking — NOT a panic crash
This is exactly what happens when institutional flows dry up slowly after classification risk rises.
Retail didn’t see it.
The chart did.
⸻
📉 BTC Weekly (June ’25 → Now)
• High: $126K
• Current: $104K
• Low: $74.5K
• Lost upward trendline
• Not a blow-off — a slow liquidity fade
Again, the signature of structural deweighting.
Not fear.
Not news.
Flows.
⸻
⚡️ The Link to MSCI
When this perpetual offering was issued:
• MSCI exclusion wasn’t public
• Analysts were only hinting
• No press releases
• No retail coverage
• No major alerts
But companies close to the fire knew classification rules were shifting.
So they raised capital early.
Retail had no idea.
They wouldn’t know for months.
⸻
⚡️ The Takeaway
This tweet marks the starting point of a long structural shift that retail didn’t understand until it was already deep in motion.
The perpetual offering was the tell.
The MSCI rules were the trigger.
MSTR and BTC’s breakdown was the confirmation.
MSTR Monthly & Quarterly Waterfall Crash In MotionI'm adding MSTR (MSTU 2x, MSTZ -2x ETFs) to my trading portfolio.
If there is a knife that I do not want to catch, THIS IS IT! MSTR is going to the toilet, even if you thought it's already in it... it's not in the toilet yet.
This Monday there's a possibility of a single-day reaction HIGH which could give us a new SHORT entry window. I will open a SHORT Monday night or Tuesday morning if the Indicators confirm a Bearish Divergence. If Tuesday closes higher than Monday then the bounce should last a bit longer.

$MSTR: Monthly down trend...GM lads, looks like we have a fully confirmed monthly down trend in $MSTR...this likely is bad news for all of crypto.
Stay safe out there...
Cheers,
Ivan Labrie.

$MSTR: Rough sailing for Saylor. Trading strategy for Strategy.Since the largest crypto liquidation event on 10th of Oct which yipped out 19 B $ of leveraged positions the Crypto market finds itself in turmoil. One of the major causalities of all this FUD has been MicroStrategy. The stock NASDAQ:MSTR is now trading 2.3% below the NAV. That means the cos. NASDAQ:MSTR is 2.3% less valuable than the amount of CRYPTOCAP:BTC it holds on to its balance sheet. This signifies the market is pricing a lot of short to medium term downturn in the fundamentals of the stock and a credit event in the worst-case scenario leading to a liquidity and a solvency crisis.
From its ATH in Nov 2024 the stock has already lost 68% of the value. On 17th Sept I wrote in this blog that there is more downside expected in $MSTR/ CRYPTOCAP:BTC with support @ 0.002 CRYPTOCAP:BTC which indicates a price of 160 $ - 170 $ for $MSTR.
Is NASDAQ:MSTR only game in town? Charts seem to disagree. for NASDAQ:MSTR by RabishankarBiswal — TradingView
Currently the stock is @ 170 $. If we plot the Fib levels on the weekly from the bottoms of the FTX blowout in 2023 we clearly see the support and resistance levels for the stock. If NASDAQ:MSTR has 2 weekly close below 170 $ then we might easily visit the 140 $ range which seems to be a previous support level. If it breaks below 140 $ then we can easily see a 100 $ on $MSTR. Another key metrics is the short interest in the stock which is @ 10% of the current float.
Trade Set Up: NASDAQ:MSTR to see more downside before any turnaround. Below 170 $ the stock can go down to 140 $ and eventually finding support @ 100. NASDAQ:MSTR / CRYPTOCAP:BTC may visit 0.0015.

