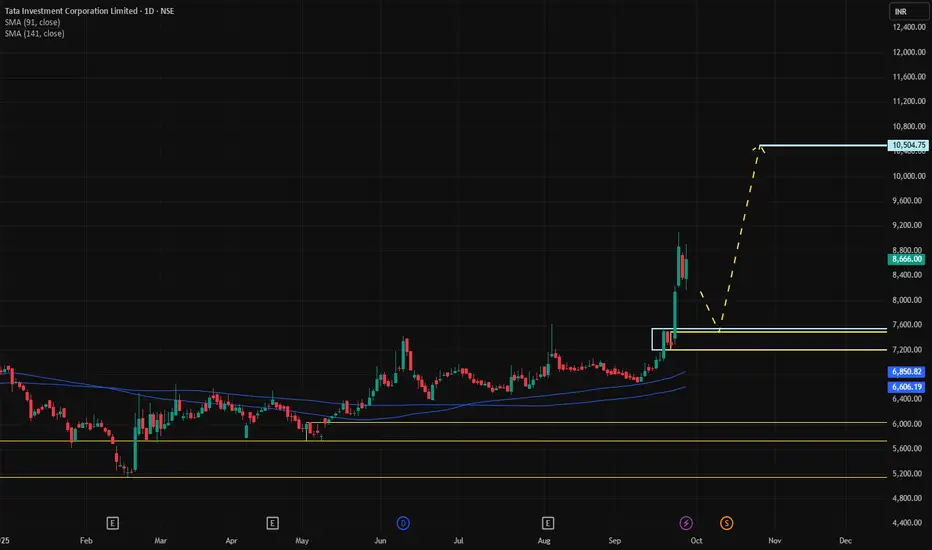
TATA INVEST1️⃣ Trend & Demand Zones
HTF (Higher Time Frame) – Yearly, Half-Yearly, and Quarterly are all UP.
Strong support zones: 2,050 – 4,453 average demand.
MTF (Medium Time Frame) – Monthly, Weekly, Daily also UP.
Support zones around 5,626 – 7,374.
ITF (Intraday/Lower Time Frame) – All UP around 7,2
64.70 INR
3.12 B INR
2.94 B INR
13.47 M
About Tata Investment Corporation Limited
Sector
Industry
CEO
Amit Nalinkant Dalal
Website
Headquarters
Mumbai
Founded
1937
ISIN
INE672A01018
FIGI
BBG000CTFMM3
Tata Investment Corp. Ltd. is a non-banking financial company, which engages in the business of investment in companies including group companies. It also offers investing in long-term investments such as equity shares and equity-related securities. The company was founded on March 5, 1937 and is headquartered in Mumbai, India.
Related stocks
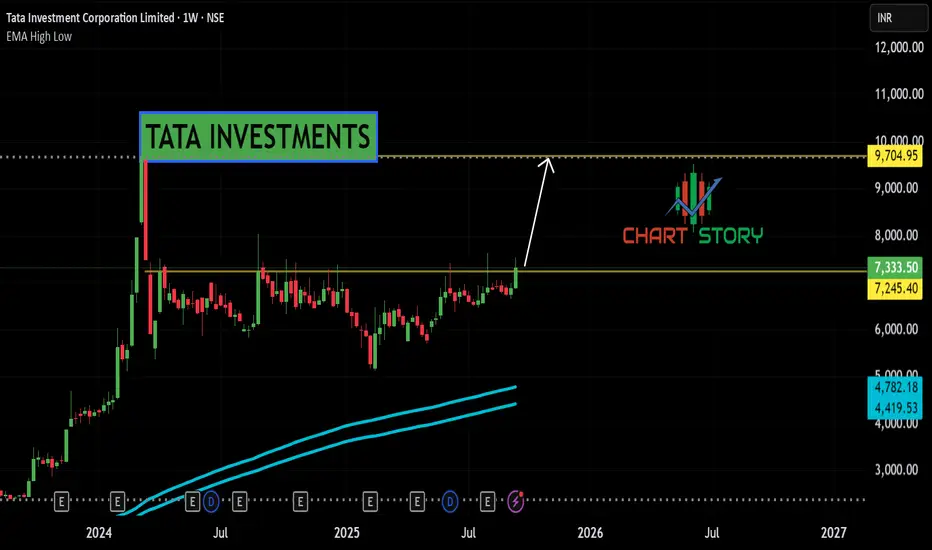
TATA INVESTMENTSNSE:TATAINVEST Weekly range breakout with outperformance. May climb may zoom upto new high soon.
Tata Investment Corporation 🔥🚀 Tata Investment Corp – Breakout Swing! 📈
💰 Deploy: ₹20K
📌 Buy: ₹7502
⚡ Breakout: ₹9922
🛑 SL: ₹6924
🎯 TG: ₹8386 / ₹9922
⚡ Tata brand power + chart breakout = 🚀 High-potential swing setup!
RT if you’re ready to ride this breakout 📊🔥
#StocksInFocus #StocksToBuy #StocksToTrade #BreakoutStocks #Sw

TATA INVESTMENT CORP🟢 Price is currently in Monthly Power Play Demand Zone → A high-probability area for upside reversal.
🧠 Trade Setup
Entry-1: ₹6550 (near current price and within Daily Demand)
SL: ₹5787 (below strong ITF support & distal demand)
Target: ₹11,161
Risk: ₹763
Reward: ₹4611
Risk-Reward Ratio: ✅ 6.0

Tata Investment Corp Swing Trade Alert! Big Move Loading🚀 Tata Investment Corp Swing Trade Alert! Big Move Loading! 🚀
Tata Investment (NSE: TATAINVEST) is bouncing from a strong demand zone, setting up for a high-probability swing trade opportunity! 📈
🔥 Why Tata Investment Looks Bullish?
✅ Demand Zone (Support): Price is consolidating around ₹5,800 - ₹

TATA INVESTMENT - Breakout Opportunity - Investofino🚀 TATA INVESTMENT - Breakout Opportunity! 🚀
🔹 Market Cap: ₹35,848.79 Cr | ADR: 2.81%
🔹 Key Levels:
✅ Buy Zone: Above ₹7560
✅ Target 1: ₹8500
✅ Target 2: ₹9330
✅ Stop Loss: ₹7000
📊 Technical Highlights:
Strong breakout above 10 EMA with high relative volume (124%).
Volume Buzz at 298%, indicating

Tata invest-Uptrend and price contracting, breakout can give en1.Good DNA(15-25%)
2.Good Green candles with volume
3.Price contraction with low volume
4. Strong uptrend
5. No resistance nearby
Breakout can give entry

SWING TRADESwing trade in tata investment if breakout as per mark. Risk Reward is 2.11. Nice consolidation with dry volume

Don't miss this .... A crisp chart with low riskI think time to initiate a BUY in Tata Investments with the SL (In Red ) and Tragets marked on chart and below Yellow don't miss it for long term buy.
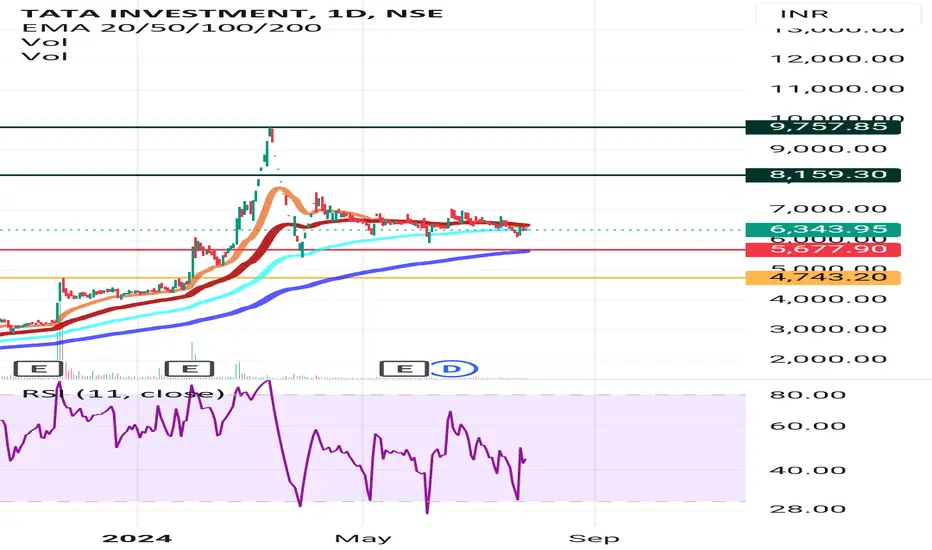
Tata Investments on make or break level nowHello Everyone,
Chart Pattern known as Symmetrical Triangle Pattern in which we can say that it is a chart pattern that signals a period of consolidation before the price breaks out, which can happen in either direction—upwards or downwards.
Condition #1 Breakdown
Target 1 - Rs 5900
Target 2 -

See all ideas
Summarizing what the indicators are suggesting.
Oscillators
Neutral
SellBuy
Strong sellStrong buy
Strong sellSellNeutralBuyStrong buy
Oscillators
Neutral
SellBuy
Strong sellStrong buy
Strong sellSellNeutralBuyStrong buy
Summary
Neutral
SellBuy
Strong sellStrong buy
Strong sellSellNeutralBuyStrong buy
Summary
Neutral
SellBuy
Strong sellStrong buy
Strong sellSellNeutralBuyStrong buy
Summary
Neutral
SellBuy
Strong sellStrong buy
Strong sellSellNeutralBuyStrong buy
Moving Averages
Neutral
SellBuy
Strong sellStrong buy
Strong sellSellNeutralBuyStrong buy
Moving Averages
Neutral
SellBuy
Strong sellStrong buy
Strong sellSellNeutralBuyStrong buy
Displays a symbol's price movements over previous years to identify recurring trends.
MIDCAPETF
Mirae Asset Nifty Midcap 150 ETF Exchange Traded Fund UnitsWeight
0.26%
Market value
325.10 K
USD
XEC.U
iShares Core MSCI Emerging Markets IMI Index ETF Trust UnitsWeight
0.01%
Market value
305.45 K
USD
Explore more ETFs
Frequently Asked Questions
The current price of TATAINVEST is 10,014.75 INR — it has increased by 9.62% in the past 24 hours. Watch Tata Investment Corporation Limited stock price performance more closely on the chart.
Depending on the exchange, the stock ticker may vary. For instance, on BSE exchange Tata Investment Corporation Limited stocks are traded under the ticker TATAINVEST.
TATAINVEST stock has risen by 38.59% compared to the previous week, the month change is a 69.35% rise, over the last year Tata Investment Corporation Limited has showed a 49.21% increase.
TATAINVEST reached its all-time high on Mar 11, 2024 with the price of 9,744.40 INR, and its all-time low was 93.40 INR and was reached on May 17, 2004. View more price dynamics on TATAINVEST chart.
See other stocks reaching their highest and lowest prices.
See other stocks reaching their highest and lowest prices.
TATAINVEST stock is 20.64% volatile and has beta coefficient of 0.64. Track Tata Investment Corporation Limited stock price on the chart and check out the list of the most volatile stocks — is Tata Investment Corporation Limited there?
Today Tata Investment Corporation Limited has the market capitalization of 535.38 B, it has increased by 17.67% over the last week.
Yes, you can track Tata Investment Corporation Limited financials in yearly and quarterly reports right on TradingView.
TATAINVEST net income for the last quarter is 1.46 B INR, while the quarter before that showed 377.20 M INR of net income which accounts for 287.86% change. Track more Tata Investment Corporation Limited financial stats to get the full picture.
Yes, TATAINVEST dividends are paid annually. The last dividend per share was 27.00 INR. As of today, Dividend Yield (TTM)% is 0.26%. Tracking Tata Investment Corporation Limited dividends might help you take more informed decisions.
Tata Investment Corporation Limited dividend yield was 0.43% in 2024, and payout ratio reached 43.77%. The year before the numbers were 0.45% and 36.80% correspondingly. See high-dividend stocks and find more opportunities for your portfolio.
As of Oct 3, 2025, the company has 24 employees. See our rating of the largest employees — is Tata Investment Corporation Limited on this list?
EBITDA measures a company's operating performance, its growth signifies an improvement in the efficiency of a company. Tata Investment Corporation Limited EBITDA is 2.80 B INR, and current EBITDA margin is 94.22%. See more stats in Tata Investment Corporation Limited financial statements.
Like other stocks, TATAINVEST shares are traded on stock exchanges, e.g. Nasdaq, Nyse, Euronext, and the easiest way to buy them is through an online stock broker. To do this, you need to open an account and follow a broker's procedures, then start trading. You can trade Tata Investment Corporation Limited stock right from TradingView charts — choose your broker and connect to your account.
Investing in stocks requires a comprehensive research: you should carefully study all the available data, e.g. company's financials, related news, and its technical analysis. So Tata Investment Corporation Limited technincal analysis shows the buy rating today, and its 1 week rating is strong buy. Since market conditions are prone to changes, it's worth looking a bit further into the future — according to the 1 month rating Tata Investment Corporation Limited stock shows the buy signal. See more of Tata Investment Corporation Limited technicals for a more comprehensive analysis.
If you're still not sure, try looking for inspiration in our curated watchlists.
If you're still not sure, try looking for inspiration in our curated watchlists.