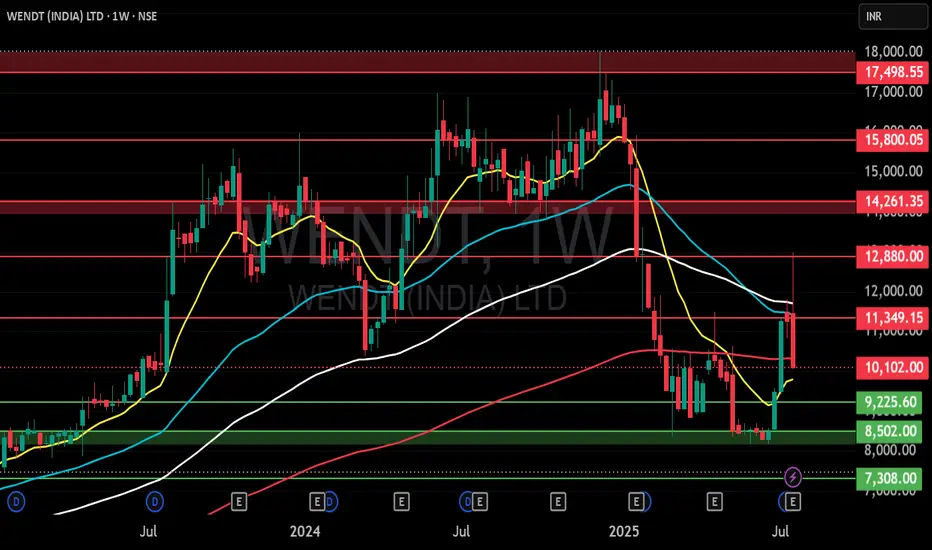
WENDT (INDIA) LTD S/R Support and Resistance Levels:
Support Levels: These are price points (green line/shade) where a downward trend may be halted due to a concentration of buying interest. Imagine them as a safety net where buyers step in, preventing further decline.
Resistance Levels: Conversely, resistance levels (re
137.95 INR
394.80 M INR
2.33 B INR
1.13 M
About WENDT India Limited
Sector
Industry
Website
Headquarters
Hosur
Founded
1980
ISIN
INE274C01019
FIGI
BBG000D25638
Wendt (India) Ltd. is a manufacturer of super abrasives, precision grinding, honing and special purpose machines and precision components. It operates through the following segments: Super Abrasives and Machines, Accessories and Components. The Super Abrasives segment includes resin bond, metal bond, hybrid wheels, vitrified bond, electroplated bond, hones, dressing tools and wear parts, brazed products and diamonds. The Machines, Accessories and Components segment offers machines, machine refurbishing, accessories, equipment and precision components. The company was founded on August 21, 1980 and is headquartered in Hosur, India.
Related stocks
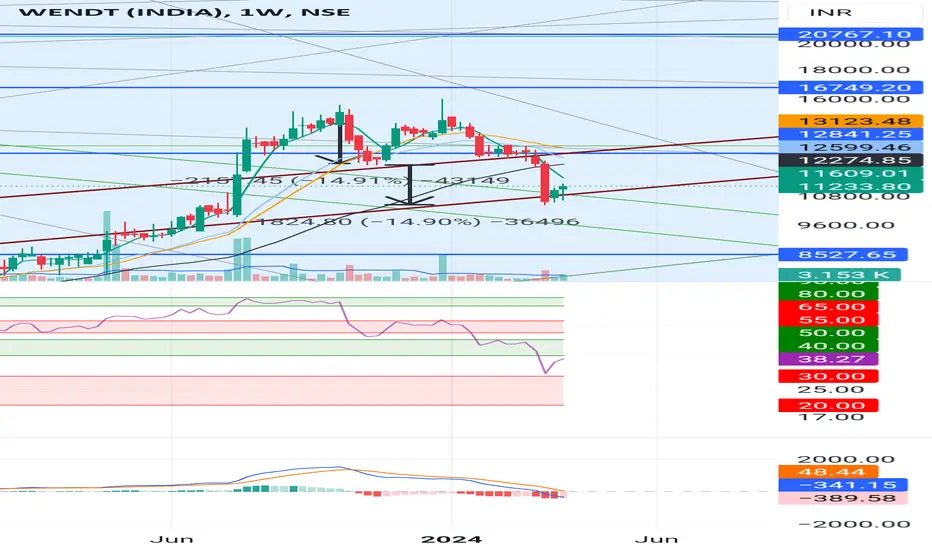
WendtWhat a perfect t completion of double top fall and the starting of the reversal
Eyeing big on Wendt and from now i prefer trading on Large caps

NSE Wendt Stock Analysis:Wendt India is a leading manufacturer of Super Abrasives, Machining Tools, and Precision Components. It is a preferred supplier for many of the automobile, auto component, engineering, aerospace, defense ceramics customers for their Super Abrasive Tooling solutions, Grinding & Honing Machines, and P

Wendt-Nice breakout.Wendt-Nice breakout.
Capital to be deployed- 20k
Investing Price -9989-10200
Breakout Price -9961
Stoploss-8681
Targets-14994
#wendt #nifty50 #NiftyBank #investment #StockMarket #StocksToBuy

Stock : WendtStock : Wendt
Cmp@2887.7
Where to Buy? Buy Above : 2910
What is SL?@2830 {Close Basis}
What are Targets? : T1: 2988 => T2: 3050 => T3: 3099 => T4: 3200++
What is Expected Time? 0-90 Days
Date of View : 10-Jan-2020 11:59 PM

WENDT - VCP bullish pattern#WENDT
CMP 3167
Long Suggested at 3300
Stop 2850
Target Open
Logic
#VCP 32W 45/18 3T
Volume contraction observed on pull backs.
Fundamentals:
Uptrend in YoY quarterly EPS
Qn-4 Qn-3 Qn-2 Qn-1
Sales -4.2% 0.2% 7.3% 27.7%
OP -15.1% 10.8% 57.8% 105.3%
NP -21.1% 28.9% 88.5% 135.5

See all ideas
Summarizing what the indicators are suggesting.
Oscillators
Neutral
SellBuy
Strong sellStrong buy
Strong sellSellNeutralBuyStrong buy
Oscillators
Neutral
SellBuy
Strong sellStrong buy
Strong sellSellNeutralBuyStrong buy
Summary
Neutral
SellBuy
Strong sellStrong buy
Strong sellSellNeutralBuyStrong buy
Summary
Neutral
SellBuy
Strong sellStrong buy
Strong sellSellNeutralBuyStrong buy
Summary
Neutral
SellBuy
Strong sellStrong buy
Strong sellSellNeutralBuyStrong buy
Moving Averages
Neutral
SellBuy
Strong sellStrong buy
Strong sellSellNeutralBuyStrong buy
Moving Averages
Neutral
SellBuy
Strong sellStrong buy
Strong sellSellNeutralBuyStrong buy
Displays a symbol's price movements over previous years to identify recurring trends.
Frequently Asked Questions
The current price of WENDT is 8,261.20 INR — it has increased by 0.04% in the past 24 hours. Watch WENDT India Limited stock price performance more closely on the chart.
Depending on the exchange, the stock ticker may vary. For instance, on BSE exchange WENDT India Limited stocks are traded under the ticker WENDT.
WENDT stock has fallen by −0.84% compared to the previous week, the month change is a −6.84% fall, over the last year WENDT India Limited has showed a −46.70% decrease.
WENDT reached its all-time high on Dec 11, 2024 with the price of 18,000.00 INR, and its all-time low was 217.00 INR and was reached on Oct 29, 2003. View more price dynamics on WENDT chart.
See other stocks reaching their highest and lowest prices.
See other stocks reaching their highest and lowest prices.
WENDT stock is 1.32% volatile and has beta coefficient of 0.61. Track WENDT India Limited stock price on the chart and check out the list of the most volatile stocks — is WENDT India Limited there?
Today WENDT India Limited has the market capitalization of 16.55 B, it has decreased by −0.97% over the last week.
Yes, you can track WENDT India Limited financials in yearly and quarterly reports right on TradingView.
WENDT net income for the last quarter is 27.00 M INR, while the quarter before that showed 37.80 M INR of net income which accounts for −28.57% change. Track more WENDT India Limited financial stats to get the full picture.
WENDT India Limited dividend yield was 0.56% in 2024, and payout ratio reached 25.33%. The year before the numbers were 0.44% and 24.42% correspondingly. See high-dividend stocks and find more opportunities for your portfolio.
As of Nov 18, 2025, the company has 391 employees. See our rating of the largest employees — is WENDT India Limited on this list?
EBITDA measures a company's operating performance, its growth signifies an improvement in the efficiency of a company. WENDT India Limited EBITDA is 433.30 M INR, and current EBITDA margin is 22.93%. See more stats in WENDT India Limited financial statements.
Like other stocks, WENDT shares are traded on stock exchanges, e.g. Nasdaq, Nyse, Euronext, and the easiest way to buy them is through an online stock broker. To do this, you need to open an account and follow a broker's procedures, then start trading. You can trade WENDT India Limited stock right from TradingView charts — choose your broker and connect to your account.
Investing in stocks requires a comprehensive research: you should carefully study all the available data, e.g. company's financials, related news, and its technical analysis. So WENDT India Limited technincal analysis shows the sell today, and its 1 week rating is sell. Since market conditions are prone to changes, it's worth looking a bit further into the future — according to the 1 month rating WENDT India Limited stock shows the sell signal. See more of WENDT India Limited technicals for a more comprehensive analysis.
If you're still not sure, try looking for inspiration in our curated watchlists.
If you're still not sure, try looking for inspiration in our curated watchlists.