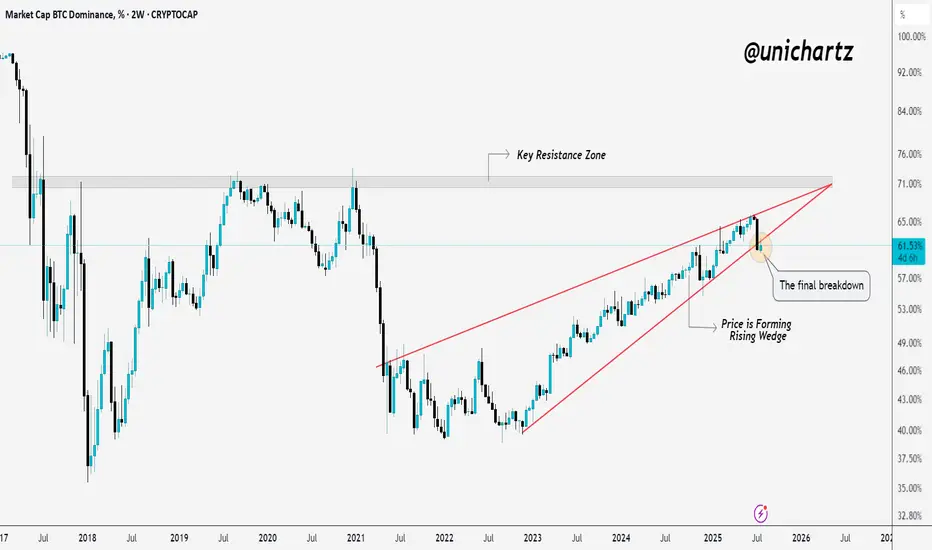
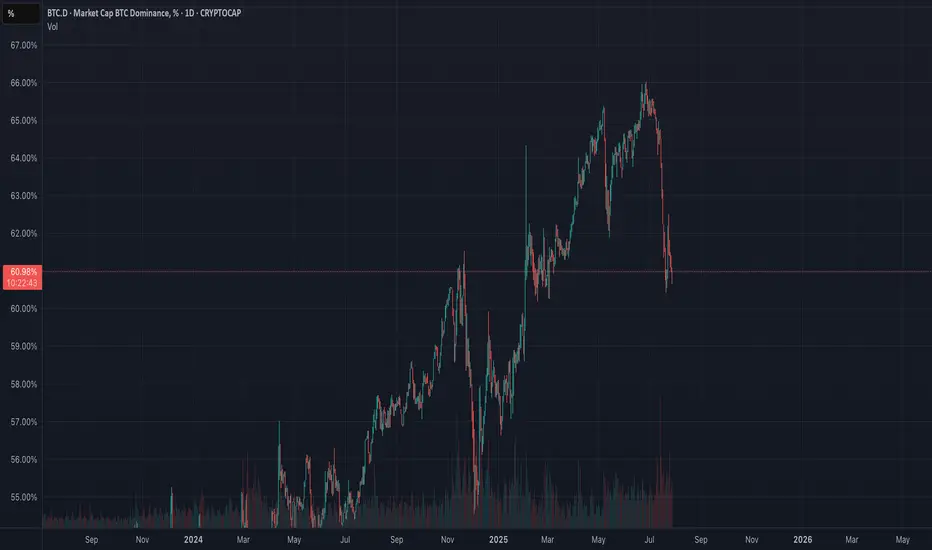
Final Breakdown from Rising Wedge – Alts About to Run?BTC dominance has been rising steadily inside a rising wedge, but now it looks like the structure is giving up.
Price just broke below the wedge, a move many traders watch as a potential shift in momentum.
If this breakdown holds, it could be the final breakdown before altcoins start gaining serious strength.
Eyes on alts, the rotation might be starting.
Trade ideas
FED, White House, and… Altseason? Let’s Decode the Charts.Hello Traders 🐺
Today will be one of the most important events for the crypto market in the last two months.
We have two major events happening today, and I want to dive into both of them in detail.
Also, I’ll share my personal prediction about BTC.D because it looks juicy for ETH and other alts.
So stick with me until the very end!
Let’s start with the fundamentals:
📍FOMC decision drops today
✅ How today's Fed decision could impact the crypto market (if rates stay unchanged):
1. 🔸 Signal of no further tightening
When the Fed keeps rates steady, it’s a sign they’re not looking to tighten policy further — at least for now.
That boosts risk appetite across markets, which tends to benefit risk-on assets like Bitcoin, Ethereum, altcoins, and growth stocks.
📈 The result?
We could see a short-term pump in crypto prices — especially if Powell strikes a dovish tone in the press conference.
2. 🔸 Indirect effect via the dollar and bond yields
If markets interpret the Fed’s pause as a step toward future rate cuts, the dollar may weaken —
And since BTC/USD tends to move inversely to the dollar, that’s another tailwind for crypto.
3. 🔸 Muted effect if tone is neutral or hawkish
If the Fed simply pauses rates without signaling cuts ahead, crypto may react flat or even negatively —
Because it pushes back expectations for easing.
📍White House crypto report drops today too
On top of the Fed, the White House is also set to release a major crypto policy report.
If it includes positive signals — like support for stablecoins, clearer regulation, or talk of a U.S. Bitcoin reserve —
combined with a neutral or dovish Fed, it could be a powerful bullish trigger for the crypto space.
By considering these facts, we can now go to the chart and see what it's telling us.
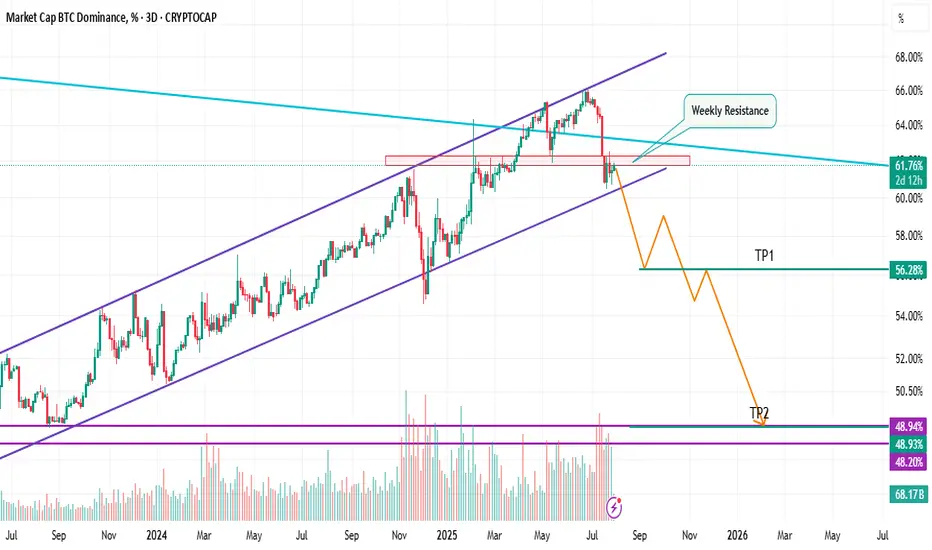
Let’s start with the BTC.D chart — then I’ll also take a look at the ETH/BTC chart, since it’s another well-known indicator for the altcoin market alongside BTC.D.
As you can see on the chart, price is currently below one of the key weekly resistance levels from recent months.
In my opinion, if we get positive news from the Fed and the White House, we’ll likely see another leg down in BTC.D — toward the first take-profit area around 56.3%, which I’ve highlighted on the chart.
This could mark the beginning of an altcoin season, and we can expect further downside movement on BTC dominance.
Now let’s look at the ETH/BTC chart:
The interesting thing about ETH/BTC is that it's moving almost identically to BTC.D — but in the opposite direction.
That means we might be about to see two major rallies, pushing price toward the key resistance zone at the monthly level.
Hope you enjoyed the idea — and make sure to always remember our rules 😎
🐺 Discipline is rarely enjoyable , but almost always profitable. 🐺
🐺 KIU_COIN 🐺
Bitcoin Dominance Still Bearish · Bullish Altcoins ContinuesThe Bitcoin Dominance Index will continue bearish as long as the action happens below resistance as shown on the chart.
An uptrend has been broken with the highest volume in a single session since February 2021. When this same signaled showed up back in Feb. 2021, what follows was a major drop (a marketwide bull-run.).
Seeing Bitcoin Dominance in the same situation as in early 2021 predicts the start of the 2025 bull market phase. This is all to say that the Altcoins market will continue to grow; Bitcoin will continue to consolidate to end up moving higher; the altcoins will resume growing within days.
The chart supports only little time for a break before the next bearish continuation, it should happen within days. At this point, the altcoins will rally up. We are very close and indeed we are already in-the-action. These short retraces should be used as opportunity to rebuy and reload.
Namaste.

Bitcoin Dominance: 2021 vs. 2025History repeats itself... 🔄
🧘♂️ The most important thing is to stay calm and approach this with a clear head. Don’t assume that just because #altcoins did a 2x in a month, they’ll immediately do another 10x without any pause or correction.
🪜 Markets move in stages — two steps up, one step down. That’s exactly how it played out in 2021: after the first major BTC.D drop, we spent two months in a range, which turned out to be the final pause before the altseason. 🔥
I’m confident we’ll see something similar now — and don’t forget, August is traditionally the slowest month of the year. On top of that, the Dollar Index (see this morning’s update) looks ready for a rally, which could temporarily stall crypto momentum.
I’m not trying to scare anyone — just encouraging you to assess the situation rationally and avoid falling into FOMO. 🐋 Patience pays off !

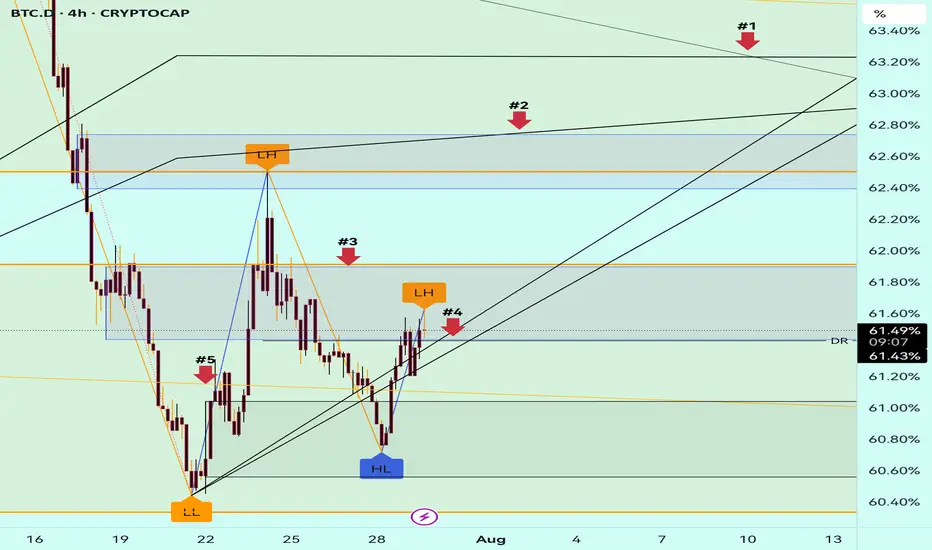
#BTC.D Update 29.07.2025BTC Dominance is trying to break above the black resistance lines, but honestly, I don't see enough strength yet to confirm a full reversal. On the daily timeframe, it’s still holding a strong downtrend structure. 🟥
🔍 If price manages to break above Arrow #4, we still have a key resistance at Arrow #3, which won’t be easy to pass.
On the lower timeframes, there are already a few bearish signs forming — but nothing solid enough yet for confirmation.
⚠️ That’s why I prefer to wait for today's daily candle to close before making any new decisions. There's also a chance BTC.D may retest Arrow #3 before reversing again.
💡 What does this mean for us?
It’s not time to jump in just yet — but the moment is getting closer, Insha Allah. If this dominance starts to turn down again, we could soon see ALTCOINS shine once more! 🌟
📈 Be ready. Stay focused. Patience pays in this game. 🚀
Altseason might just be warming up!
BTC.D Stuck in the MiddleThis is BTC.D on the daily
After losing the 50MA in the final days of the first half of the month, BTC dominance found support at the 0.382 Fib level, only to bounce back up and get rejected at 62.25%.
From here, it all depends on which level breaks first: the 0.382 support or the 62.25% resistance.
Whichever way it goes, we’ll be here to watch it unfold.
Always take profits and manage risk.
Interaction is welcome.

BTC Dominance 1D – Market LeadershipBTC dominance daily chart to assess whether BTC is leading the market or capital is flowing into altcoins.
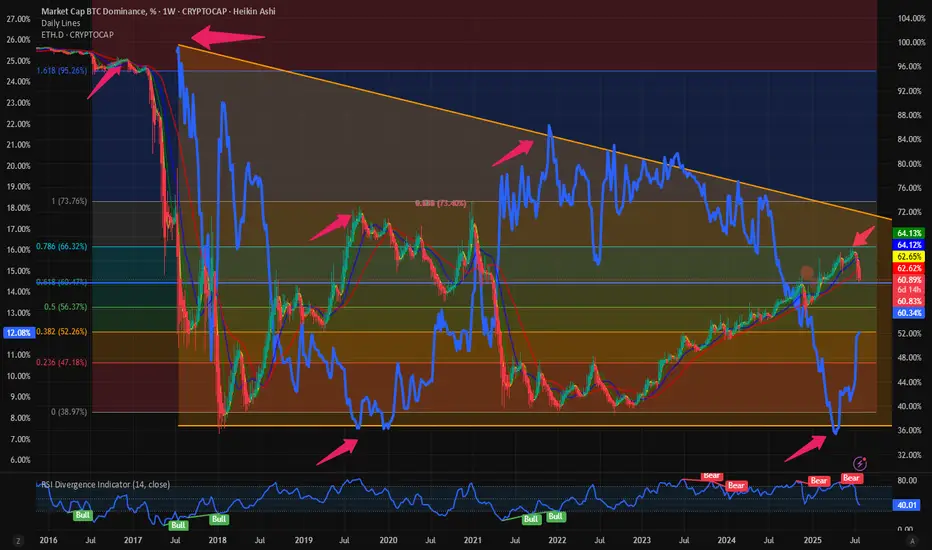
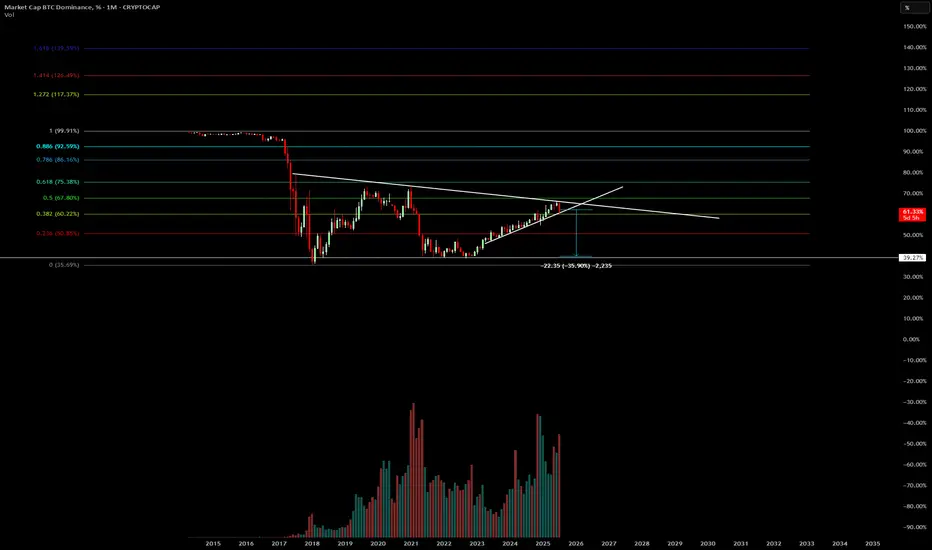
$BTC.D: Cycle tops are in. $ETH.D: Bounce form the all-time lowsIn my opinion the most important chart in all Crypto is the $BTC.D. We have been writing and observing CRYPTOCAP:BTC.D for almost 6 months. I predicted here that we will see CRYPTOCAP:BTC dominance @ 66% before the end of this cycle. And we saw CRYPTOCAP:BTC.D touch 65.9% on June 23 as visible from the weekly chart, which is close to our cycle target of 66%. See my blog from April 14.
CRYPTOCAP:BTC.D to 66%, CRYPTOCAP:TOTAL2 / BTC down to 0.43 for CRYPTOCAP:BTC.D by RabishankarBiswal — TradingView
But since then, CRYPTOCAP:BTC.D is going through reversal. Currently @ 61% the dominance has tumbled in July. Even if CRYPTOCAP:BTC is holding on to its ATH with price near to 118K $ the dominance is clearly in a downtrend.
But then we see something which CRYPTOCAP:ETH.D has not done since 2019. In the chart below we have super imposed the CRYPTOCAP:ETH dominance on the CRYPTOCAP:BTC Dominance. CRYPTOCAP:ETH Dominance as the name suggests is the % of Crypto Market Cap that can be attributed to $ETH. The CRYPTOCAP:ETH.D double bottomed in 2019 @ 8% and then went on for a reversal with CRYPTOCAP:ETH.D peaking @ 22% on Nov 21. Both the Dominance charts have an inverse correlation but have one thing in common. The trend in the Dominance charts is lower. In each cycle the CRYPTOCAP:BTC.D makes a lower low peaking at 95% in 2017 cycle, 73.5% in last cycle and 66% in this cycle. The same is true for CRYPTOCAP:ETH.D , starting @ 26% in 2017, 21.5% in the last cycle. So, the obvious question in your mind is where will the CRYPTOCAP:ETH.D peak this cycle. If we draw the downward slopping wedge in the CRYPTOCAP:ETH.D and assume the cycle end by Dec 2025, then we can see the CRYPTOCAP:ETH.D will peak around 17% in this cycle. Currently at 12%, I am predicting another 40% upside form here. Pricewise BITSTAMP:ETHUSD may give a higher return than the $ETH.D.
Verdict: CRYPTOCAP:BTC.D top for this cycle is 66%. CRYPTOCAP:ETH.D can top @ 17% this cycle. BITSTAMP:ETHUSD can double from here for CRYPTOCAP:ETH.D to top @ 17%.
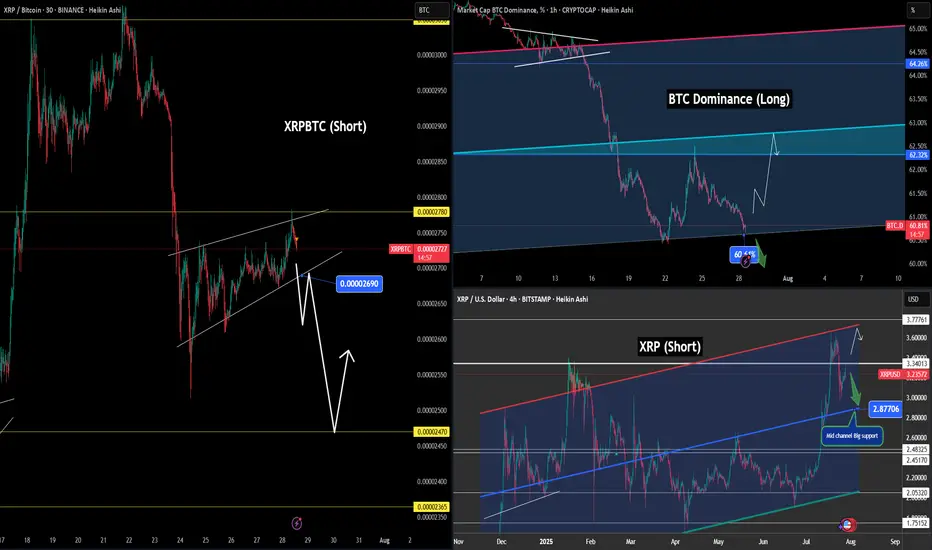
XRP Structure with Bitcoin Dominance - (Hedge is Edge)📉📊 Mastering XRP Structure with Bitcoin Dominance - (Hedge is Edge) 🧠⚖️
Hey guys, I just posted the video — so you can hear the full breakdown there. 🔊🎥
This time, I'm also sharing the charts here to support the lesson and give you a clear visual on the educational idea. Let’s break it down:
🔍 XRP/BTC – Short Bias
We’re at a clean rejection point around 0.00002780, with a wedge formation breaking lower. First support target sits around 0.00002690, with 0.00002470 and even 0.00002365 possible if the move deepens. Invalidation sits just above that yellow resistance — always define your risk.
📈 Bitcoin Dominance – Long Bias
BTC dominance is resting on solid support around 60.61% . A bounce here typically signals Bitcoin outperformance — either BTC rising faster than alts or BTC holding while alts bleed. Either way, it adds pressure to the XRP side of this setup.
💸 XRP/USD – Short Bias
Rejection off the top of a long-term channel, with price pushing down. The next key level is $2.87, the midline of the channel. Until price breaks and holds above $3.34, the structure leans bearish.
♟️ Hedge is Edge
What does this setup teach us?
🔹 Long BTC (structure + dominance support)
🔹 Short XRP (multiple confirmations of weakness)
This hedge reduces directional exposure and allows for a calculated trade, based on structure — not hope.
🧠 The big takeaway: trading isn't about predictions. It's about aligning logic, risk, and market structure into something that makes sense.
Check out the video above to hear the full breakdown. (Audio won’t play inside TradingView — sorry about that — but it’s all explained there.)
One Love,
The FX PROFESSOR 💙
Disclosure: I am happy to be part of the Trade Nation's Influencer program and receive a monthly fee for using their TradingView charts in my analysis. Awesome broker, where the trader really comes first! 🌟🤝📈
Combining three important indicators for the ALT seasonThe best tool for detecting the start of the Alt Season is a combination of three important indicators: Bitcoin Dominance, Tether Dominance, and USDC Dominance.

ALT SeasonWhat are these red boxes indicating guys?
Lets hope for the best. Next few months approx. through range analysis are good for the alts.
You guys can check through back-testing whenever the BTC.D falls the ALTS rise.
We are at the top and we might free fall from here.
Keep Following me for more. Show your support i will post the best ALTS analysis. Message me to know more.
Follow me = Support me = encouragement = more analysis.
We all need something to get something.

BTC.d strong move down ahead die to find 0,382Altcoin season is coming 🚀
If the 38.2% Fib level will not be broken a next strong move will come. It indicates a next strong move down and it will go much lower.

BTC Dominance Hits Key Zone, What’s Next?BTC Dominance (BTC.D) is approaching the key 50% zone at 60.19%.
We could see a relief bounce in BTC.D either from the current level or after this zone is tagged.
This bounce might come from a strong BTC move to the upside, or a correction in altcoins.
If altcoins do pull back, it could be a great buying opportunity, if we're lucky enough to get it.
#Altseason2025

Bitcoin Dominance Topping Out? Bitcoin dominance ( CRYPTOCAP:BTC.D ) may be hitting a cycle top, signaling a potential major shift in capital rotation across the crypto markets.
Historically, when Bitcoin dominance peaks, we tend to see:
🔄 A rotation of capital into altcoins
🚀 Explosive rallies in ETH, SOL, and mid-cap alts
💰 Increased retail speculation and trading volume across DeFi and meme coins
Previous cycle tops in BTC dominance (e.g., 2017, 2021) preceded major altcoin seasons, with dominance falling sharply while total crypto market cap continued to grow.
⚠️ A rejection at key resistance (like the 200-week MA or golden fib levels) could confirm a reversal, hinting that altseason is around the corner.
💡 Keep an eye on:
ETH/BTC breakout potential
Total3 (crypto excluding BTC & ETH) trends
Risk-on sentiment and social metrics
Will history repeat? Or is this cycle different?
📈 Chart shows confluence of horizontal resistance, weakening RSI, and declining momentum on BTC.D.
Not financial advice. Always DYOR. Use proper risk management.

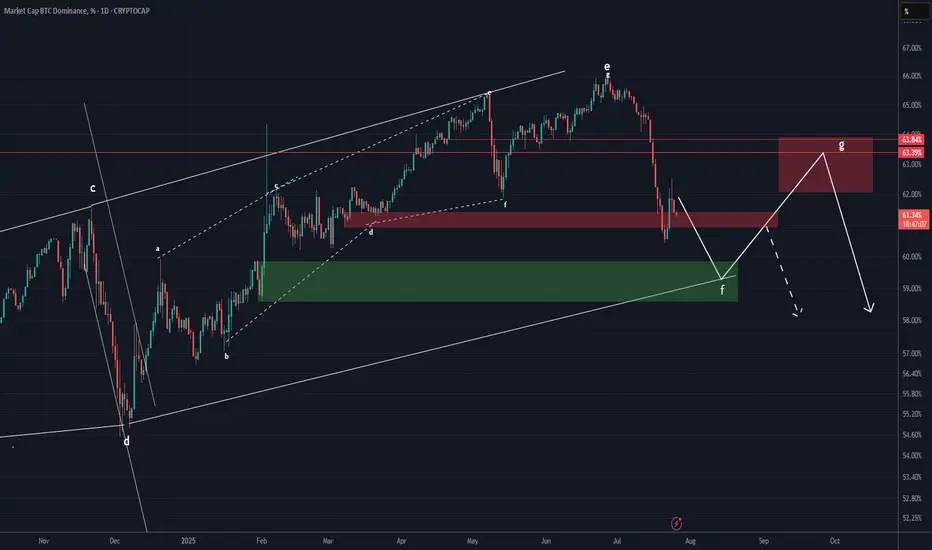
BTC DOMINANCE Update (1D)It seems that Bitcoin dominance may soon experience upward corrections, as it has broken through several support zones to the downside without any reaction and is now close to another support area. Usually, when the market maker pushes the price through multiple supports without a reaction, the price can retrace from a nearby support.
The price may soon move to complete wave G.
We have considered two different scenarios for the fluctuations of this index. However, note that this chart is a derivative chart, and the fluctuations may not follow the schematic exactly, but this analysis gives us a good view of the support and resistance zones and the probable path.
For risk management, please don't forget stop loss and capital management
Comment if you have any questions
Thank You
BTC DOMINANCE Looks Bearish (1D)Bitcoin Dominance seems to have completed its bullish structure.
An order block is forming and has been broken to the downside, a trigger line has been lost, and wave g has come to an end.
If Tether dominance also declines, altcoins may remain in the green.
The 62 level is the target drop zone for this index.
For risk management, please don't forget stop loss and capital management
Comment if you have any questions
Thank You

The End of the Altcoins Bull Market? BTC.D Turns Bullish?Bitcoin Dominance produced a bullish trend that was more than 1,000 days long. While this was a major development, the action never happened just straight up. There were always fluctuations.
Bitcoin Dominance broke out of a major rising wedge pattern. A pattern that lasted years in the making.
Recently, Bitcoin Dominance produced the highest bearish volume since 2021. A strong chart signal.
The major breakdown following the multiple years long uptrend signals the start of a change of trend. A downtrend. This downtrend is extremely bullish for the altcoins market because BTC.D only goes down when the altcoins are going up and doing so faster than Bitcoin.
What we are seeing now is an inverted correction, a pullback. Simply put, BTC.D already made a strong drop and it needs some relief. This relief is not the end. Bitcoin Dominance can move just a little higher to later resume its newly developing downtrend. Which means that the altcoins market bull market has not reached its end, it is only getting started.
Thank you for reading.
Namaste.

2025 BTC.D to %44 then retrace to %56 - 2026 real Altseasonthe drop in bitcoin dominance from now till end on August to %44 will send some Alts 5 to 10 X then all the market will dump till the end of the year and the dump will be brutal
Brutal means : bitcoin down %65 and altcoins %90 from the upcoming August mini Altseason run. which actually Alts prices will be cheaper than now ( today )
eventually BTC.D going down to %20
Not a financial advice

Bitcoin Dominance – Critical Breakdown on the Horizon
Bitcoin dominance is currently testing a major long-term resistance zone formed by the upper boundary of a multi-year wedge. After months of steady climb, the structure is now showing the first signs of exhaustion
If dominance loses the key 60% support zone, that would mark a major structural shift — historically followed by downtrends in dominance and strong capital rotation into altcoins.
Until dominance reclaims the upper trendline or regains bullish momentum, the risk-reward now favors altcoins. Momentum is shifting. Altseason might just be around the corner.

ETH/BTC vs btc dominanceethereum received a reaction as we expected from the current demand zone in the bitcoin pair, and it seems inevitable that the upward momentum from the current area will continue. on the bitcoin dominance side, the same situation exists, but I think we will witness a bearish absolute process.

Market Analysis – Key Levels to Watch!
🔥 Market Analysis – Key Levels to Watch! 🔥
❗️The market is unstable, and fear is visible – but let’s break down what’s next!
♦️ Recap of Yesterday’s Analysis:
✅ We discussed the potential altcoin rally – but only if BTC.D and USDT.D confirm.
✅ We also warned about fake breakouts in alts.
Over the last 24 hours, many altcoins spiked on the 1H timeframe, but due to low volume & weak momentum, and no confirmation from BTC.D & USDT.D, a fake breakout occurred.
🟢 Current Market Outlook:
The best move right now is to wait for BTC.D and USDT.D reactions to the key levels I’ll highlight below.
If the market turns bullish & BTC dominance drops, coins like ADA, DOGE, XRP, BNB, SOL, SUI, ETH will be on my radar.
👉 I’ll try to analyze a few of these coins before the next potential move and share trade setups. 🚀 Stay tuned!
♦️ BTC (Bitcoin)
• Sellers have pushed price into buyer micro-zones.
• Key support: 111
• Two bullish scenarios:
1️⃣ Price hits 111, ranges for a while, then breaks the range top upward → long setup.
2️⃣ A sharp bullish candle forms. If BTC.D drops on the same move, I’ll look for alts near previous highs for potential entries.
♦️ USDT.D
• Support: 4.22
• Max correction: 4.51
• If this level breaks upward → short setups will be in play.
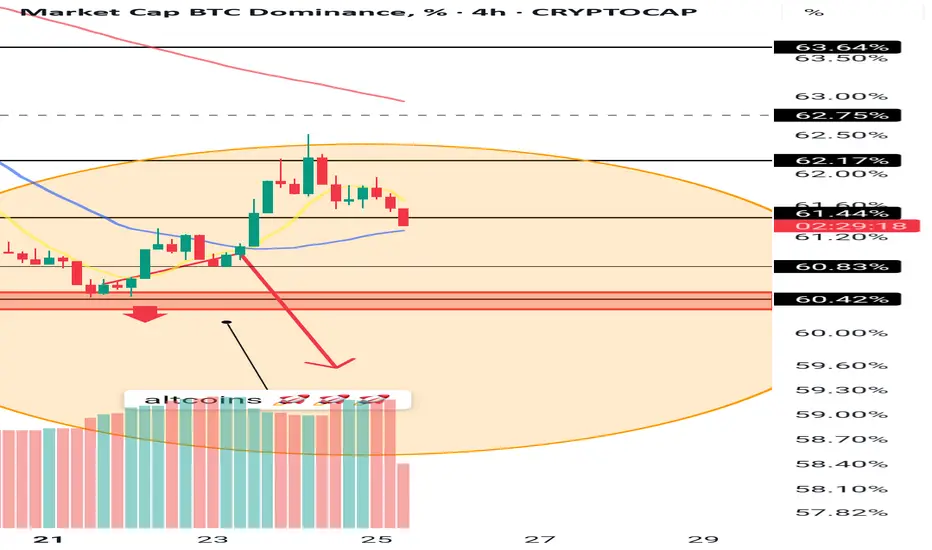
♦️ BTC.D
• Yesterday’s analysis is still valid.
• After the recent downtrend on 1D (HWC), there’s only one bullish candle.
• For alts to rally: BTC.D must break 61.6 → 60.83 → 60.42 downward.
• If BTC.D rises instead, watch 62.17 as a critical level for altcoin drop scenarios.
♦️ TOTAL (Crypto Market Cap)
• Needs to break 3.91 to confirm bullish momentum.
• Early signal: 3.85 (1H timeframe).
♦️ TOTAL2 (Altcoin Market Cap)
• Early bullish signal: 1.48
• Strong confirmation: 1.55
💎 Follow me & hit 🚀 if you want real-time updates before the next big move!