$btc.ddid not see this happening or rather chose not to see it .. ;)
flip of 48.69 should give us a big move on King Corn keep consoling myself the higher the corn goes the more explosive the alt season
recon btc pairs on coin margin get stop hunted before we have our melt up on alts
BTC.D trade ideas

BTC.D corrective move and subsequent growthHello analysts 🙋
btc.d chart has been inside a prz zone for a long time and seems to have a correction to the middle of the channel and then continue to grow.
What do you think, comment me your opinion 💡🤘

BTC DOMINANCE IS READY TO FLAY ALT COINS HOLDERS BE CAREFUL.BTC Dominance is now ready for upward ride
start shorting your alt-coins for long term
BTC dominance showing some support 41.50 and creating double bottom at these levels at weekly chart so be careful for long term trade
regards
saqibmirza

BTC Dominance ! 1D Review Hello everyone, I invite you to review the current dominance of BTC over the rest of the market. First, we will use the blue lines to mark the sideways trend channel in which we are moving and here you can immediately see that we are in its upper limit, what is more, we are staying above the uptrend line.
Now we will go to check where we have support when BTC starts to lose against the entire market. And here we have the first support at 46.59 %, then the second support at 45.1 %, the third support at 43.9 %, and then the fourth support at 42.7 %. It is worth checking the percentage of BTC dominance, because the lower the value, the more other coins gain.
Looking the other way, in a similar way, using the trend based fib extension tool, we can determine the places of resistance. First we have resistance at 49.2 % which is a very strong resistance and the upper limit of the ongoing sideways channel, when we manage to break it we have second resistance at 50.7 % then third at 52 % and then fourth resistance at 53 %.
Please pay attention to the CHOP index, which indicates that most of the energy has been used, the MACD indicator indicates entering a local downtrend, while the RSI shows a small rebound, but we are still high, which may indicate a deeper correction.

Bitcoin Dominance Elephant/Mammoth in the room The Bitcoin dominance has been doing something seemingly unnatural with the limited information available to us. I find that a lot of people are sleeping on this or just unaware.
First off, this chart is very busy. I don't normally make charts with this many indicators but there is a lot of confliction in the information and I only want to make a single chart of this to follow on. There is are even a few indicators I have deleted for sanities sake.
Secondly, the elephant is that we have basically gone through a bear market in a range with the dominance. What we have known or at least what we think we knew is that in bear markets the dominance of bitcoin goes up. That so far has proven to be false or is it that the bear market isn't over yet? I will explain all of this with my opinion at the bottom with a third option.
THE INDICATORS
On the Monthly chart
50 month MA
CM_Ultimate_MA_MTF
Volume
Down below, from top to bottom
RSI
Vortex (VI)
Traders Dynamic Indicator (TDIGM)
Historical Volatility (HV)
Bitcoin Dominance Oscillator (BTCD_O)
Sentiment Oscillator (ASO)
So, lets start from the top
The CM Ultimate has turned green, the only other time that's happened on this chart has shown an upward dominance move for Bitcoin. The RSI is climbing, the blue vortex has crossed above the pink line that all show a support for this upward dominance move. The sentiment oscillator has closed the gap (Blue vs pink) and looks to make across that would add to the upward move, but, has not crossed as of yet (possibly this month it may).
The conflict or size of the move
The last time dominance went up it was met with very heavy resistance the 50 month MA (yellow line), it finally did break through but did not hold for even one month and broke back down again. This shows us the 50 month is very very strong resistance for now. The question is, will it go above this time around? This is what remains to be seen and what will follow here.
The volatility and traders dynamic could be pointing at small move. We can clearly see the volatility going down as the move is going up. The TDI has been saying a move is coming and has been made but it might already be over, or there is isn't much left in the move. So, it could go to the 50 month and get rejected from there. Why? We can also see the TDI's range is narrowing which coincides with the volatility. Also, along with all this the RSI is showing hidden bearish divergence for 4 years now, that started in 2015, but has it played out fully yet? Again that remains to be seen.
I have zoomed in on the volatility so it can be clearly seen but what is being missed is the giant wedge that it is in. This wedge does eventually end in about 2 years, so it's still aways away.
What I think and what my analysis is.
First off, it's not to be taken as advice.
I think BTC dominance is going up for now. I also think it gets rejected by the 50 month and goes back down for an alt-season and could make a double bottom and hit the lows of 2018 @ 35% or possible even slightly lower for a very short time. It then would go back up substantially.
Keep in mind this could take 2 to 3 years to play out in full or even longer.
The keys in all of this are the 50 month, the Volatility and the volume. We can also see the volume is in a downward trend. A big volume spike could bean early sign of a trend reversal too. Once all this plays out and if the dominance was to go back up the volatility would have to break out of the wedge in a fairly violent way, just as it did when it broke down in 2017/18.
The other option is it just gets more and more stable and less volatile as time goes on and keeps following this trend. I don't think this is likely as a permanent fixture though.
Another hidden key here could be Ethereum. ETH has also closed the gap on BTC during this bear market, so it's another thing I'm looking at and could also be used as an indicator to all this data. I have linked a chart to this analysis in this one called "Is Ethereum going to dethrone the king". Also, I have included is an altcoin lengthening cycles analysis based on XRP.
I do suggest you replicate this chart in multiple ways by breaking down the indicators for cleanliness sake and even adding in the ones I removed listed down bellow.
Removed but still relevant Indicators
Stochastic RSI
Bollinger Bands
MACD
Thank you for looking and please feel free to let me know what you think in the comment section down below.
Stay Blessed
WeAreSat0shi

Alt season ......4......3...2...1...5x .... 10x... its gonna be a sight to behold...
NFA
y axis only
DYOR
MAY the alts be with you!

WE'LL SEE %28, SOONWE'LL SEE %28, SOON. Wait and see. ITS COMING. We're so close to fall.. GOOD LUCK!

BTC Dominance is DominatingThe 49% Resistance area for BTC D. has been at play since the summer of 2021 when we first hit that resistance level.
You can see in previous areas BTC D finding resistance was bullish, money flowed into Alts and Total Crypto MC pumped hard. The 3d retrace was marked by a further dip in overall Crypto MC but coincided with a drop in BTC price. Currently since the last time resistance was hit we have seen several alts pop off and BTC find resistance at 30800.
While BTC D was rejected at resistance once more on 12 April, a retrace occured that found support around 47%.
Currently we are bouncing back to the resistance at 49%. BTC Dominance
Over the last 3 days BTC Dominance has been pumping back to resistance.
If it breaks out to the upside, expect ALTS to bleed, would be a good moment to load up on Altcoins.
Hitting Resistance and breaking down to previous levels would likely be bullish for altcoins as long as BTC price either stabilizes (ideal scenario) or pumps along with the alts.
Patiently waiting...

Bitcoin Dominance Analysis
According to the data of Bitcoin Dominance chart, it can be seen that it is placed between two support and resistance levels (blue and red areas).
My personal opinion:
According to the analysis of liquidity in the market (link below)
We will have the growth of Bitcoin dominance and this shows that the growth of the price of Bitcoin will come with it. Of course, I must mention that because we will not have a significant growth of liquidity in the market, the expectation is a temporary growth of Bitcoin and then the distribution of liquidity to altcoins.
The point that is very important is that it should be considered that the price of altcoins will decrease, and after the growth of the price of Bitcoin, Dominance will decrease and the traders will save profit and then enter the resulting profit into altcoins. do

RSI Forex: A quick review of the market situationWhat is RSI: .
RSI, or Relative Strength Index, is a momentum indicator that is used to measure the strength of a trend. RSI works by comparing the average profit and loss over a specific period. It is primarily used to identify moments of overvaluation or overestimation in the market, allowing investors to enter the market with a much greater chance of profit.
RSI is expressed on a scale of 0 to 100, with a value above 70 usually indicating overvaluation and a value below 30 indicating overvaluation. However, there are many other ways to interpret RSI values.
Use in practice: .
Here are some ways to use RSI in forex trading:
At the bottom of the chart: RSI indicator
Red dotted line: Level 70
Green dashed line: Level 30
Blue solid line: RSI level
Entry signal - The appearance of RSI values below 30 or above 70 can indicate the possibility of entering the market. When the RSI exceeds the 70 level, we expect prices to fall and can open a short position. Conversely, when the RSI falls below the 30 level, we expect prices to rise and can open a long position.
.
Divergence - In the case of divergence, which is the difference between the behavior of the price and the value of the RSI, we can look for signals that the trend may reverse. For example, if the price is rising and the RSI value is falling, this could indicate a possible trend reversal and a signal to open a short position.
.
Use of the neutral zone - Some traders use the RSI neutral zone (between 30 and 70) to identify the trend. If the RSI remains in the neutral zone for an extended period of time, it may indicate the absence of a trend. However, if the RSI leaves the neutral zone, it may indicate the emergence of a new trend and a signal to open a position.
.
In conclusion, RSI is a very popular and effective technical indicator that can be used in forex trading. However, like any other indicator, the RSI is not perfect and requires closer analysis in combination with other indicators. Our dedicated Manticore Investments strategy is based on a combination of 3 indicators, which together provide a very effective position entry signal. We use Haiken Ashi Candles, RSI and Bollinger Bands. In future materials we will show how to apply this combination in practice.

Bitcoin dominance and the test of the bull market 🔥In the crypto world, the dominance of Bitcoin is of high importance. It shows the weight of BTC to other altcoins. It is this indicator that is now the main one for determining the vector of market movement or the potential start of the alt season.
💰 Bitcoin dominance has been jumping in the range of 40-49% for the past 2 years.
That is, we have a certain flat on the chart.
Let's analyze the history of what is happening in the market during one or another indicator of Bitcoin dominance over these last 2 years.
Look at the picture.
In 3 out of 4 cases, when dominance rose to 50%, this led to a collapse of the crypto market.
BUT it is important to consider that we are analyzing the situation in 2021-2022.
At that time, there was a bear market and if now is really a bull market, then Bitcoin dominance will finally go above 50%.
Or it will start to decline, then liquidity will flow from Bitcoin to alts, as it was in July 2022.
It turns out, based on the analysis of domination, we have 2 scenarios:
1. We continue to be inside the flat and in the near future we will see a collapse and a decrease in dominance. After strong growth of alts.
2. We break through the sideways up, Bitcoin slowly rises or falls, and the alts start to shoot.
Be careful in this market, buddy 😉


Bitcoin Dominance Chart ( Altcoins Bloodbath Coming ? )Bitcoin Dominance Chart Analysis: Potential Impact on Altcoins and Key Levels to Watch
Bitcoin dominance, which represents the market capitalization of Bitcoin as a percentage of the total cryptocurrency market capitalization, is currently trading at 48.31%. The dominance chart is showing signs of a potential breakout at a big resistance level. In this article, we will analyze the implications of a breakout and key levels to watch.
Headings:
What is Bitcoin Dominance?
Current Status of Bitcoin Dominance
Implications of a Breakout in Bitcoin Dominance
Key Levels to Watch
Best Altcoins Entry in Near Future
Conclusion
What is Bitcoin Dominance?
Bitcoin Dominance is a metric that shows the percentage of Bitcoin's market capitalization relative to the total cryptocurrency market capitalization. It is an important indicator of the market sentiment towards Bitcoin as compared to other cryptocurrencies.
Current Status of Bitcoin Dominance:
Bitcoin Dominance is currently trading at 48.31%. The dominance chart is showing signs of a potential breakout at a big resistance level.
Implications of a Breakout in Bitcoin Dominance:
If Bitcoin Dominance breaks out of the 48% resistance level, it could lead to a bloodbath in altcoins trading in BTC pairs. It may also affect the altcoins trading in USD pairs if Bitcoin remains stable or dumps. However, if the breakout occurs, the 48% resistance level will convert into a strong support level.
Key Levels to Watch:
The key levels to watch for Bitcoin Dominance are the support level of 45% and resistance levels of 48% and 62%. In case of a failed breakout, Bitcoin Dominance may test the support level of 45% before pumping.
Best Altcoins Entry in Near Future:
If Bitcoin Dominance breaks out, the next stop would be at the 62% level, which could be a good entry point for altcoins. We will update the best altcoins entry at that time.
Takeaways:
Bitcoin Dominance represents the market capitalization of Bitcoin as a percentage of the total cryptocurrency market capitalization.
Bitcoin Dominance is currently trading at 48.31% and is showing signs of a potential breakout at a big resistance level.
A breakout in Bitcoin Dominance could lead to a bloodbath in altcoins trading in BTC pairs.
The key levels to watch are the support level of 45% and resistance levels of 48% and 62%.
If Bitcoin Dominance breaks out, the next stop would be at the 62% level, which could be a good entry point for altcoins.
Conclusion:
The Bitcoin Dominance chart is currently showing signs of a potential breakout at a big resistance level. If the breakout occurs, it could have significant implications for the altcoins trading in BTC pairs. It is important to keep an eye on the key levels and stay updated on the best altcoins entry points.
Follow us for More Quality Content.
Thank you.

Bitcoin and Bitcoin Dominance Compare BTC dominance could continue up as btc price comes down , marked some key pivot pivots where they react opposite.

📈 Bitcoin Dominance Clearly Set To Move Above 53% to 58%At times, charts can be quite difficult to read yet at other times, the end-message can be quite clear.
Bitcoin Dominance (BTC.D) is giving out a clear message and that is up.
Mid-March, BTCD moves above EMA100 weekly on a major green candle. The action that ensues is what makes the message clear.
For the next month and a half, 6 sessions/candles, BTCD consolidates by going sideways... 100% sideways.
After 6 weeks of consolidation, the index is now moving up.
This is supported by a very strong RSI.
Volume is low, which means that the real, strong action is yet to come.
On a bearish bias/potential, we would see a test and retest of EMA10 and EMA100 as support, instead, bullish consolidation then up.
We can expect additional growth with the next target being MA200 at 53.53%, followed by EMA300 at 57.99%.
Mirror image from the March/May 2021 drop.
First we go down...
Then we go up!
Namaste.

BTC.Dominance Elliott Waves AnalysisHello friends.
Please support my work by clicking the LIKE button👍(If you liked). Also i will appreciate for ur activity. Thank you!
Everything on the chart.
Until we above 49% i still wanna see decreasing in zone +-45%
cancellation of scenario - consolidation above 49%
Good luck everyone!
Follow me on TRADINGView, if you don't want to miss my next analysis or signals.
It's not financial advice.
Dont Forget, always make your own research before to trade my ideas!
Open to any questions and suggestions.

Pump IT!I believe BTC did not have a bear market but only the 4th wave of its second supercycle which could not break under 13k-14k and validate this theory.
IMO we are right now in the first leg of the 5th wave and the BTC dominance is proof of that.
This inverted chart is screening higher, showing a massive consolidation under "resistance" (support).
It seems it's going for the 3dr wave which most likely will have BTC dominance falling and BTC price going parabolic but the alts are outperforming.
The 4th wave of the inverted BTC.D chart will probably occur during the major correction of the 5th wave of BTC price where the alts probably will dump harder consequently rising the BTC.D.
The 5th wave of the inverted BTC.D chart is likely the 5th wave of the 5th supercycle wave of BTC price, where the price of BTC rises with lots of divergences and the alts are just exploding bringing the BTC.D down.
Read carefully to understand and remember that this is the INVERTED BITCOIN DOMINANCE chart.

BTC flashed green on weekly GCBTC flashed green on the Weekly Gaussian Channel. This indicator has no false signals and as always been followed by a macro uptrend?.
Will this move delay ALT season?

$BTC.dHola people !!
dixie going down
dominance going down
my coins going down
can't really make sense of it , guess it all kicks off with NY open in a bit ..
been cursing myself for not getting back in my short after getting stopped ( timing is everything) so took a step back since the move has already happened
added a fair bit of QI to spot now lets hope this white line breaks and we get some green ..

BTC Dominance still in Wyckoff BuildupThis is an update to the BTC.D Wyckoff Accumulation chart I posted a few weeks ago (Link below). We hit the breakout resistance and rejected hard, but now finding support at AR top zone. If the market sees reversal in coming weeks its possible, we continue to build up even if BTC will be going down as Money from alts will leave faster to BTC hence keeping BTC.D afloat in buildup zone. In case we see failure of the buildup and break below the AR zone I am expecting it to find support at the 50% retracement, which was also prior resistance for BTC.D.
Note: The Analysis of BTC.D is useful in timing when to invest money in Alts and when in BTC for maximizing gains.

BTC.d Dominance Deviation ahead?That would be the best for alts and altseason to happen
---
If you like my content, if it helps you gain profit, give it a like!
Thanks!
---
Hold my beer pls
----
No financial advice, do your own research, don't be stupid

DESTINYIt will correct to one of the support points of 43% or 40% and somehow altcoins will gain compared to Bitcoin.
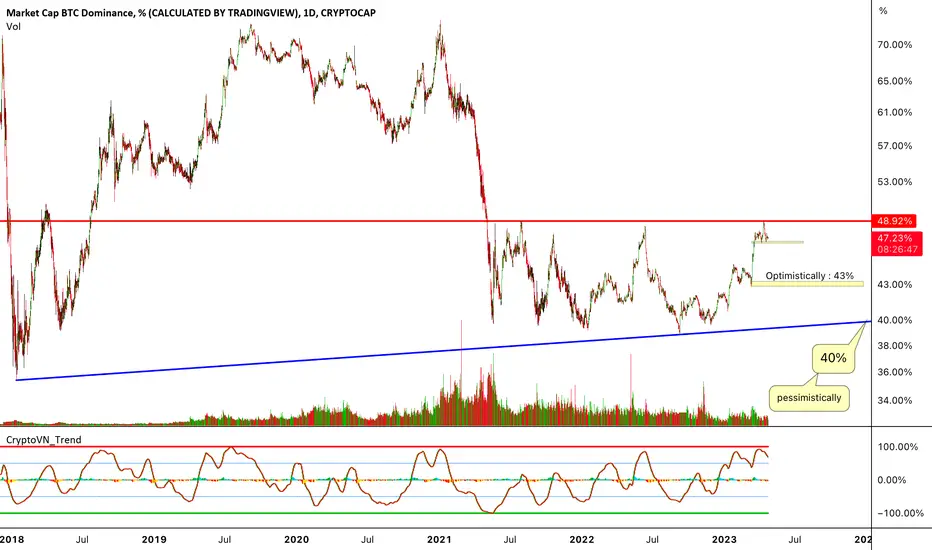
DestinyIt will correct to one of the support points of 43% or 40% and somehow altcoins will gain compared to Bitcoin.
