$BTC Dominance broke the trendline and keeps on fallingCRYPTOCAP:BTC dominance broke the trendline and keeps on falling marked is the first entry where i believe it might reach and start growing back till then it might be the short ALT season we get to see specially for meme coins.
BTC.D trade ideas

The decline in BTC.D will stop.Brief Opinion on Crypto
Altcoins:
In my view, the altcoin season hasn’t started yet, and the price surge we expect from altcoins is still not due. The chart I previously shared for TOTAL3 outlines the roadmap.
Bitcoin:
I believe Bitcoin’s dominance won’t decrease further and will rise again. The recent price correction presents a buying opportunity. In the Bitcoin dominance chart, we see that RSI has reached the oversold zone and then formed a divergence. Therefore, I think dominance will rise from these levels.
Regardless of short-term fluctuations, in the long term, Bitcoin will remain strong and dominant.
Good luck
NEoWave Chart

Berish BTD.d To 54%Berish BTD.d To 54%
Make 0 To A # And A to B # Right Now Dont Make Any Target C For All Siqn
i Think Wll Get Mini Alt Season Not For All Right Now
Look To Larg And Med Cap Only For Alt
Tp 57
Tp 56.5
Tp 55.5
Tp 54

BITCOIN & BITCOIN DOMINANCE CONTINUE TO SELL OFFIn this weekend's analysis, I show the impulse sell off on Bitcoin from the all time highs of $124,533 to support level of $111,649 is considered a wave A correction and currently ensuing a wave B retrace which at the time of this analysis was at the 0.382 fib level of $117,300. There is a chance to bounce up the 0.5 fib level $118,095 but I think based on declining momentum on the daily, BTC price will consolidate a few more hours around the $115k zone and finally breakdown to the next area of support at 109k to 106k target zone next coming weeks.
Bitcoin Dominance to track Alt-Coins is also trying to find a relief bounce as several divergences are spotted on the higher time frame of daily and weekly charts. However, there is no reversal confirmation yet and so we will determine what's likely when the bounce has occurred.
Thank you for taking time to listen to entire analysis and I wish you a profitable trading week.

ALTSEASON TIME (PART2)Hello friends
In the previous post, we talked about Ethereum dominance and altcoins, now we need to take a look at Bitcoin dominance.
Well, you see that the channel we had was broken and now there is a very important number for us, which is the support number 54. If the number 57 is broken, we can reach the number 54, and if we reach this number, we will go for lower numbers. This will cause the growth of Ethereum and altcoins.
Keep in mind that support 54 is a very important support and they tried to break it before but failed, so our key support is this number and we should pay attention to it.
*Trade safely with us*

Altcoin Piooners | Bitcoin Dominance Daily Analysis Day1CRYPTOCAP:BTC.D
Altcoin Piooners | Bitcoin Dominance Daily Analysis Day1
👋 Welcome to Altcoin Piooners Group TRADING ™!
Let’s analyze Bitcoin Dominance. Let’s explore the reason behind it and what Bitcoin’s Dominance next move might be.
It features a rising wedge pattern 🔼, marked with green lines ✅, indicating a potential reversal 📉.
The dominance rose initially ⬆️, forming higher highs and higher lows, within the wedge.
A target 🎯 is indicated around 57.62% 📊, suggesting a possible downward breakout ⬇️.
The current dominance is near 58.47% 📍.

Bitcoin Dominance cycle is Down into late july to oct 2026 The main cycle for bitcoin as to its dominance is down for the next 12 to 14 months .

BTC Dominance Prints Lower Low – Looking for More DownsideThe BTC Dominance daily chart (%BTC.D) has officially formed a new lower low (LL) and is now showing rejection at key Fibonacci retracement zones. The macro structure has fully shifted to a bearish trend, and deeper downside targets are now in play.
➡️Market Structure:
👉 A textbook bearish sequence of HH → LH → LL is now confirmed
👉 After a brief bullish bounce from the 60.40% level, price was rejected at the 0.618–0.65 Fib zone (61.4%–61.8%)
👉 A second rejection followed at the 0.236 retracement (59.99%) of the latest swing leg down
➡️ Current Fib Confluences:
👉 Price is now consolidating at 59.18%, which is a 0.5 retracement of the broader move and the near key liquidity zones from previous structure
➡️ The next major support zones are:
👉 59.05% – 58.68% (0.618–0.65 Fib cluster )
👉 57.15% (0.786 target)
➡️ Bias & Outlook:
👉 The recent lower high rejection indicates continued BTC underperformance
👉 If 59.05% fails to hold, dominance could drop toward the 58.6%–57.1% range
👉 A falling BTC.D often results in stronger capital inflows into altcoins
➡️ Key Levels to Watch:
👉 Resistance: 59.99%, 60.9%, 61.7%
👉 Support: 59.05%, 58.68%, 57.15%
This could be the early fuel for an altcoin momentum wave, especially if BTC.D continues trending lower.

Btc dominance Don’t sell your alt coins until the dominance hits support the. The bull market will end for now it’s just starting , alt coins will continue to gain market . Macd cross on btc dominance the monthly looks good for alt coins

Bitcoin Dominance Elliott Wave Update: Wave ⑤ Near CompletionBTC Dominance has been unfolding in a clear 5-wave impulsive decline. Right now, price action is moving within the last leg — wave ⑤ — and has reached the 57.9% zone, which aligns with multiple confluences:
• ✅ 0.618 Fibonacci extension of wave (3)
• ✅ Bottom of the descending channel
• ✅ Strong psychological & structural support zone
This confluence suggests that wave ⑤ could be approaching its final stage of completion.
📌 Implication for Altcoins:
A local bottom in BTC dominance often translates into increased selling pressure on altcoins, as money flows back toward Bitcoin.
🎯 Key Levels to Watch:
• 57.9% → potential termination zone for wave ⑤
• 56.6% → full 1.0 extension of wave (3), deeper bearish scenario
⚠️ Invalidation:
If dominance breaks convincingly below 56.6%, the bearish extension continues, giving altcoins more room to breathe.
👉 For now, caution is advised on altcoins as BTC dominance nears completion of wave ⑤. Expect volatility and potential liquidity grabs.

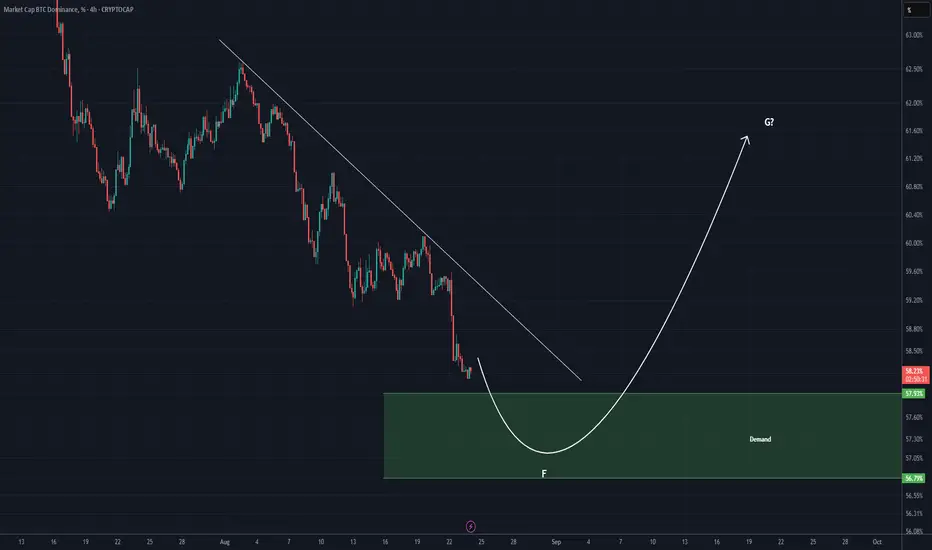
BTC DOMINANCE Update (4H)This analysis is an update of the analysis you see in the "Related publications" section
As expected from the previous analysis, we anticipated a drop in this index, and the drop is currently in progress.
One important point to note is the green zone, which is a strong support area. It is possible that the diametric/symmetrical structure we discussed in earlier analyses is still intact. In that case, wave F of this diametric pattern may complete in the green zone, and candles could then enter wave G | a bullish wave that may trigger a significant correction in altcoins.
For risk management, please don't forget stop loss and capital management
When we reach the first target, save some profit and then change the stop to entry
Comment if you have any questions
Thank You
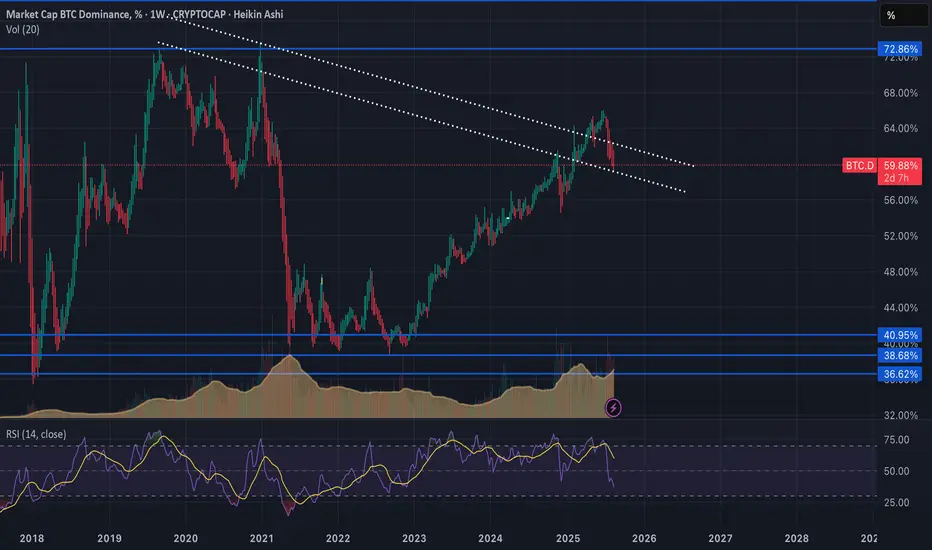
This is freakin' huge for Altcoins!BTC.D is breaking below the monthly RSI support level, and a death cross could be forming on the monthly MACD. Buckle up!


Has Altcoin rally begun?A long-term support trend-line on Bitcoin dominance has just broken. This suggests BTC dominance may decline , which often shifts liquidity toward Altcoins. If confirmed in weekly time frame, we could see stronger moves across the Altcoin market.
Disclaimer: This is not financial advice. Just sharing my market view.

BTC Dominance:Still fallingBitcoin dominance has completely touched the target point and caused Ethereum to grow
I am currently expecting it to make a second move
To start the Alt Season, we need to wait for Ethereum to calm down. There is money in the Ethereum market right now

Altseason Loading?Hello, Traders!
You know, crypto has its own seasons. Just like spring brings blossoms and winter brings snow, markets sometimes shift from BTC Dominance into what we call altcoin season, or, if you’re in a hurry, altseason. It’s the phase when altcoins, from big names like ETH to more adventurous projects, start outperforming Bitcoin in terms of returns. But before we all start dreaming of endless green candles, let’s remember: no single chart or altseason indicator can tell the whole story on its own.
What Is Altseason, Really?
At its core, alt coin season is about comparison. BTC remains the benchmark, but when altcoins start delivering stronger percentage gains, traders call it an altseason. The altcoin season index, a popular tool, checks whether at least 75% of the top altcoins are outperforming BTC over the last 90 days. If they are, the meter swings toward “yes, it’s altseason.”
The chart you see above shows the Bitcoin Dominance Index (BTC.D), one of the cornerstones behind the altcoin season index. When Bitcoin dominance is high, it means BTC is absorbing most of the market’s attention and capital. But when dominance starts to fall, that capital often rotates into altcoins, fueling what many call an altseason. This is why the altcoin season indicator doesn’t live in isolation: it leans on the shifts in BTC dominance to determine whether the market is favoring altcoins over Bitcoin.
Sounds simple, right? But here’s the restriction: the altseason index isn’t a fortune-teller. It’s more like a scoreboard that tells us how things have been going recently, not necessarily what’s coming next. And just to underline it, this indicator always needs to be paired with others, never used in isolation.
How the Altseason Chart Looks
The altcoin season chart is a visual snapshot of this dynamic. When it spikes, it suggests altcoins are collectively outperforming Bitcoin. During true alt season crypto, you’ll often see Ethereum gaining faster than BTC, smaller-cap tokens doubling, and market sentiment turning euphoric.
But these surges rarely last forever. As quickly as altseason arrives, it can fade. Bitcoin dominance tends to rise again, pulling attention and liquidity back. That’s why most analysts treat the altcoin season chart as part of a bigger puzzle, not a stand-alone answer. Once again, let’s stress it: the altseason indicator must be read in combination with other metrics like BTC.D or ETH/BTC ratios.
Why Altseason Feels Important
For newcomers, altseason is exciting because it looks like the best chance to multiply gains quickly. The 2017 rally made household names out of projects that otherwise might have stayed niche. The 2021 altcoin season chart looked like fireworks, with ETH and even DOGE stealing headlines. Still, it’s dangerous to treat the altcoin season index as a golden ticket. Some tokens rise with the tide, but many sink just as quickly.
The Bigger Picture
So, is it altcoin season right now? The truth is, the altseason index offers a glimpse, the altcoin season chart provides context, and the altseason indicator adds structure. But none of them are designed to function solo. They’re like instruments in an orchestra. Together, they make sense, but alone, they’re just noise.
Right now, the market is in a balancing act. Bitcoin’s dominance has weakened, but it hasn’t collapsed. That leaves us in a classic “altseason loading…” phase, where traders debate whether we’re at the doorstep of a new alt coin season or just witnessing a temporary shake-up.
Whether you call it altcoin season, alt season, or just plain altseason, the lesson is the same: indicators are tools, not prophecies. They shine brightest when combined, never when isolated.

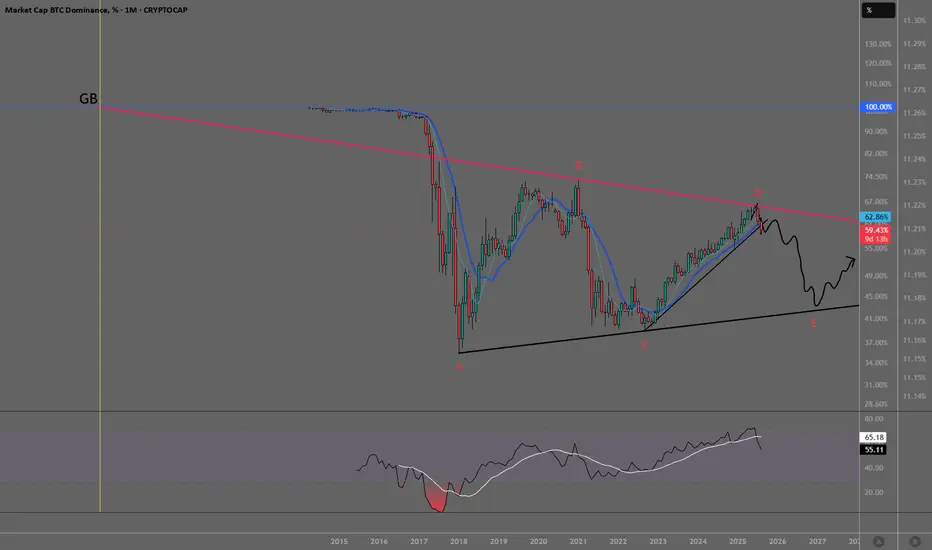
BTC Dominance – Topped Out and Ready to Break?BTC.D looks clearly topped and is forming what appears to be a triangle A–E pattern.
Drawing a line from the genesis block (start of BTC) and over the 2021 high, a resistance is formed precisely where BTC this year was rejected, and an important support level is broken but not yet confirmed, as the month is yet to close the candle. But I expect BTC.D to continue to fall.
This triangle pattern typically signals a breakout around August 27–28 after a bounce off the lower support.
If the pattern breaks to the downside, BTC dominance may find support around the 42% level.
Altcoins could benefit from a drop in dominance — keep an eye on volume and direction in the coming days and weeks. As mentioned in another post, alts could see a bounce around September 12th.
The Alt Season is still ongoing.As you can see, the Alt Season lasted 147 days from the price ceiling to the bottom of its channel.
Trading knots are always present along the way and are full of ups and downs But the goal remains the same.
So be patient and don't miss your golden opportunity, because whales and organizations want you to doubt and doubt.
History and charts never lie.

BTC is losing dominance, Alt season!With the passing of the Genius Act , ETH , ADA , and many other American altcoins gained strong momentum. BTC dominance is bearish, and with the Clarity Act in the process of being passed, I expect lower dominance for BTC in 2025 and 2026. As you can see in the weekly chart, BTC dominance lost its momentum within a key rising parallel channel and dropped into a lower channel. Alt season is coming!

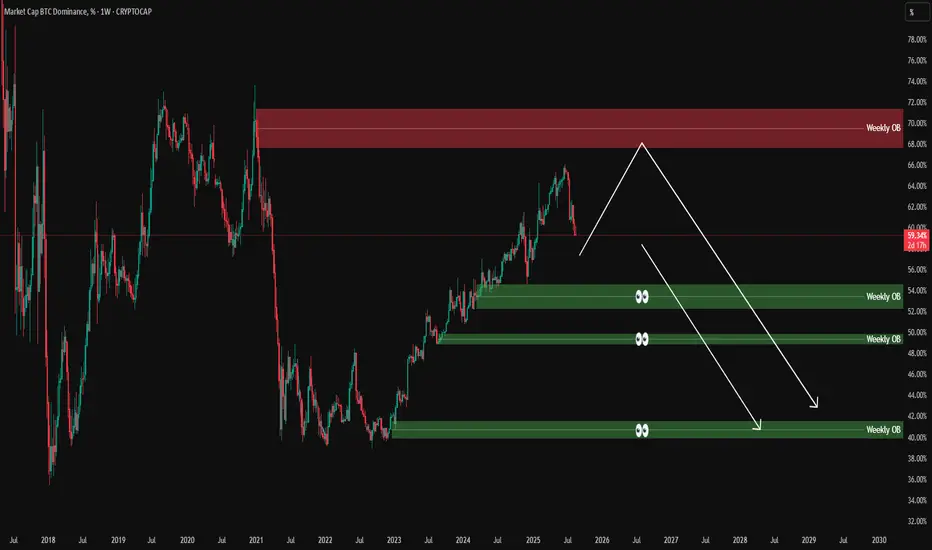
BTC Dominance analysis – 1W OB & Market Structure/ AltseasonOn the weekly chart, Bitcoin dominance has rejected from the 70% Weekly OB supply zone and is now pulling back.
We currently have three major Weekly OB demand zones below:
54–55% OB
48–50% OB
40–42% OB
Possible scenarios:
1️⃣ A temporary bounce before continuation lower.
2️⃣ A steady decline into one of the OB zones (50% or 42%).
3️⃣ A strong breakdown below 50%, signaling a deeper shift in market structure.
⚡ Key Altseason Signal: If this decline in BTC dominance happens while Ethereum’s price rallies in Daily or Weekly timeframe, it will be a strong confirmation of the start of Altseason, with ETH leading and alts following aggressively.
📊 ProfitaminFX | Gold, BTC & EUR/USD
📚 Daily setups & educational trades

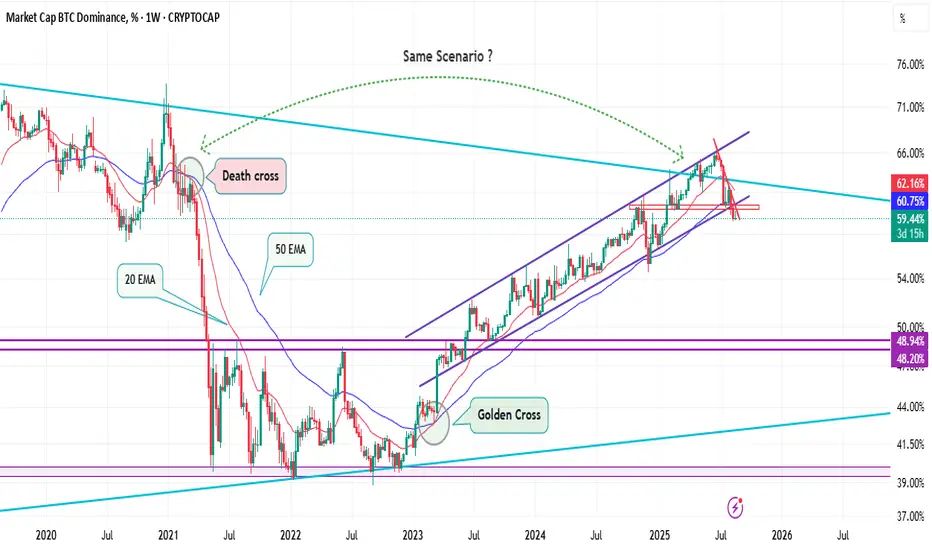
History Repeats: Death Cross Signals Altcoin Season Ahead !Hello Traders 🐺
In this idea, I want to talk about the most probable scenario for BTC.D and Altcoins in the upcoming months, so make sure to read until the end — and don’t hesitate to share your thoughts in the comments below.
Let’s get started:
As you might know, one of the most important EMA combinations is between the 20 and 50 EMAs. When the smaller one (20) breaks above the bigger one (50), we call it a Golden Cross — a strong bullish signal, especially on higher timeframes. And of course, the opposite situation is called a Death Cross, which usually indicates a bearish reversal.
And what’s happening now?
Before the last Altcoin season, we had a clear Death Cross on the BTC.D chart, aligned with other bearish signals such as RSI reaching the overbought zone on the weekly timeframe, testing a monthly resistance line, and forming a bearish pattern below it. All of that led to one of the most memorable Altseasons we’ve ever had.
Right now, I believe we are seeing the exact same setup again:
Price reached the monthly resistance line.
RSI is once again in the overbought zone (monthly).
A bearish reversal is forming.
BTC.D is breaking below key levels and trading under a 3-year ascending channel.
And now… another Death Cross is on the horizon!
If we also get a rate cut in the upcoming month, this setup could trigger another massive Altcoin season — and more pain for BTC.D dominance.
I hope you enjoy this idea and as always, remember our golden rule:
🐺 Discipline is rarely enjoyable, but almost always profitable. 🐺
🐺 KIU_COIN 🐺