#BTC.D 2H ChartBitcoin dominance tapped into our 1h supply zone where it got rejected from and it is currently bouncing off the 100MA. We may see it retest the support at 58.85% before moving up again.
Trade ideas

zoom outIf there is anytime for this Dominace to make its move it's now.
looking for this week to be strong.

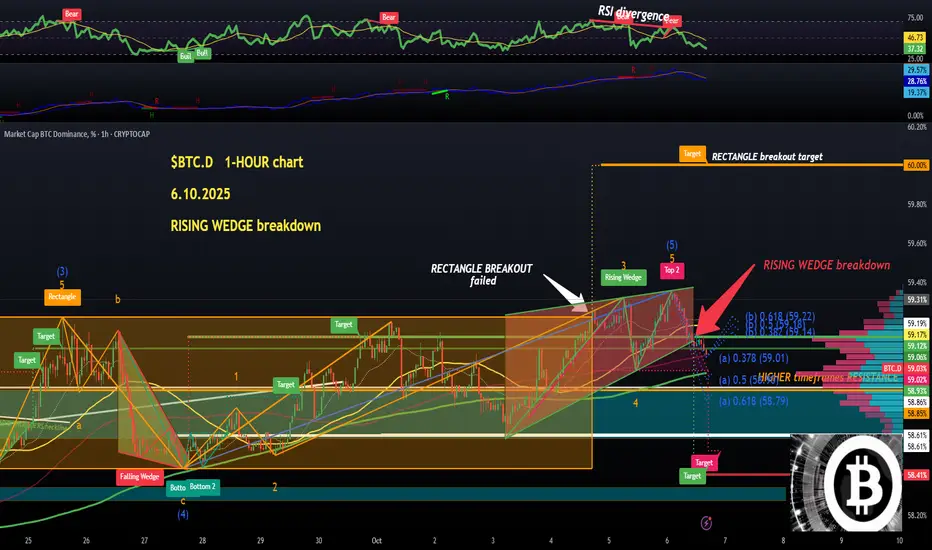
$BTC.D (1-hour): RISING WEDGE breakdown, BEAR RSI divsMore bearish news for the almighty CRYPTOCAP:BTC DOMINANCE chart popping up on the HOURLY chart.
RISING WEDGE breakdown has started, targetting 58.4%. BEAR RSI divergences again and again.
This ticker has been losing steam, and I'm not one bit surprised. WAVE 5 seems complete and we are likely seeing the beggining of a REVERSAL to the downside.
Last HIGH was only subtle, I can even call it an EQUAL HIGH, so we have got a DOUBLE TOP with a neckline (breakdown level) at 58.95%.
Cross below the neckline and there will be TWO active chart patterns BREAKDOWNS.
Huge for altcoins. 💙👽
$BTC.D (4-hour): TRIPLE TOP invalidated, BEAR RSI divs persistLast Saturday when I analysed the CRYPTOCAP:BTC dominance chart, there was a good chance to establish an ultra bearish TRIPLE TOP pattern, which would have been fantastic for altcoins.
We didn't quite get that, the dominance put in a higher high, so it is still in an UPTREND until proven otherwise.
Having said that, have a look at the RSI (momentum). Constantly printing LOWER HIGHS, three BEAR RSI divergences in a ROW.
Also, the most recent HIGHER HIGH in dominace was a very subtle (weak!) one and looks like a mini DOUBLE TOP.
It's more and more likely that we are going to see a reversal on the 4-hour chart. Not yet, because CRYPTOCAP:BTC itself has been very BULLISH and the ETFs keep buying like there is no tommorow.
Get ready for the true altseason, this is when fortunes will be made💙👽

BTC.D - Signaling Third Altseason BTCdominance is beginning to break down suggesting BTC has reached a peak or is nearing and movement will be favored for alts.
My target for BTCD is 50% as price along this MA line has seen strong confluence
lets go alts!

The altseason hasn't started yet!Dominance remains high. Bitcoin attracts a large amount of investment through marketing, but there may be serious problems ahead with mining and attacks on pools, and simply the fixation of income by those who held profits in bitcoin.
I will try to predict the continuation of Bitcoin's dominance, but the alt season is approaching and will begin around the time interest rates are lowered.
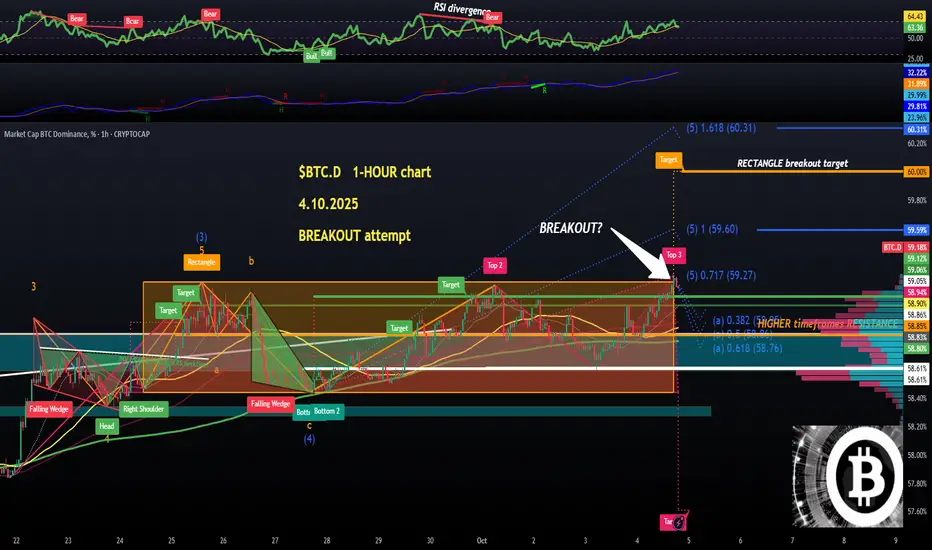
$BTC.D (1-hour): rectangle BREAKOUT attempt, late longs deadOn the HOURLY chart, CRYPTOCAP:BTC dominance has been trying to break out above the highlighted RECTANGLE pattern (which basically is a range with two horizontal boundaries).
If succesful, the target would be exactly 60% Bitcoin dominance. That's why the altcoins are taking a hit so far this weekend.
Best case scenario (for the alts) is a rejection here, without a single candle close above 59.30%.
We really want this forming TRIPLE TOP (also refer to my previous post, the 4-hr chart) to be established as that would most likely trigger further downside, towards the main support zone (58.6 - 58.85% range).
Yet again, this is a WAVE 5 impulse move, targets still haven't hit (59.6% and 60.3% based on Elliot's Wave Theory), so the responsible thing to do before taking any more exposure to alts would be to wait for this last WAVE to complete, or at least wait for a BEARISH market structure shift (as in, for the BTC.D to put in a lower low: below the support zone, <58.6%).
So far, the breakout is looking a bit suspect, which is good and let's hope it fails miserably (unless you are BTC Maxi).
Today and tommorow, I'm working on best set-ups for the upcoming week, a lot of coins look ready to fly, it is ALL about the selection from now on, so choose wisely.
Another pro-tip is to watch reactions of coins today during correction, the ones that are holding the strongest will likely outperform the market on the next swing high💙👽
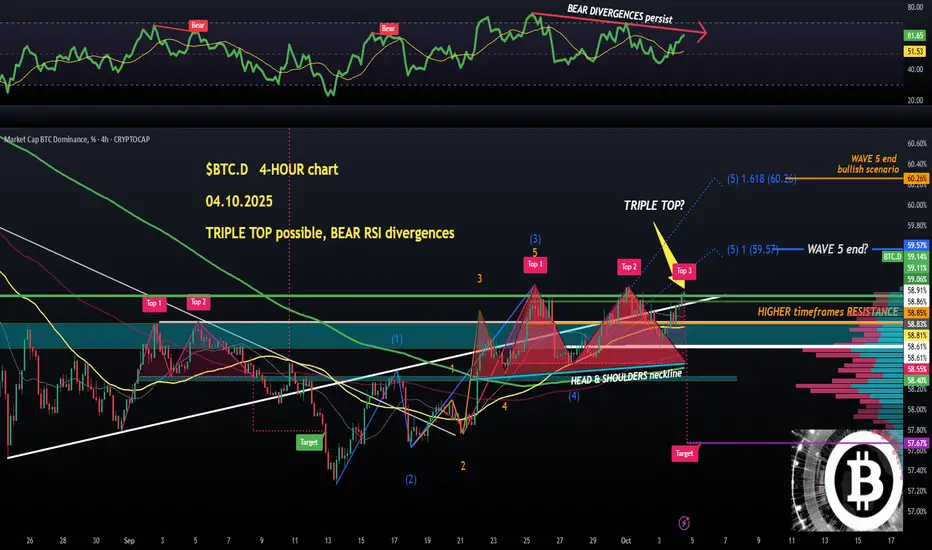
$BTC.D (4-hour): TRIPLE TOP possibility mixed with BEAR RSI divsI haven't posted the most important crypto ticker for the altseason in a few days, which I consider #BTC.D , so here we go.
The DAILY is still bullish with a falling wedge breakout (looking a bit weak already) targetting 62%, so I will simply look into shorter timeframes, 4-hr first.
First of all, the HEAD & SHOULDERS pattern is NOT text-book anymore, some traders wouldn't even call it H&S due to the right shoulder being nearly as high as the head.
That doesn't matter to me, these are just names, what really matters that the UPTREND has been in trouble. We're still seeing higher lows but, unless we close a strong candle above the two previous highs (59.3%+ is required), there is a great chance of a TRIPLE TOP.
Triple top in confluence with persisting RSI momentum divergences, two in a row in the making, which is basically a confirmation of dying momentum.
Still, this is WAVE 5 (the current wave upwards) and these can extend and overextend. Hopefully not, for the sake of our coins.
Too early to call for the CRYPTOCAP:BTC dominance chart to crash, but the ingredient are definitely ready.
Breaking below 58.6% would be huge, to cross below the (light-blue zone) support zone and to make a lower low.
That's when I will open quite a few longs on altcoins. HOURLY timeframe analysis - next post💙👽
Bitcoin Dominance Bouncing as in 2020Bitcoin Dominance has bounced at the same level where it did during the 2020 bull market, right before the 2021 Alt Season.
The yellow line marks my first target.
Another thing worth of mention is the giant triangular pattern currently forming.
BTC Dominance: Short-Term Dip or Long-Term Rally?📊 Bitcoin dominance has been cruising in an uptrend channel for a while, but it recently broke below the channel's floor, dropping to around 58%. Right now, it’s bouncing around in a key zone between the 60% resistance and 56% support.
What’s Coming Next?
🔴 Short-Term Bearish Scenario: If dominance can’t hold above 60%, we might see it slide back to the critical 56% support. This could give altcoins some breathing room and maybe even spark a decent rally. Perfect opportunity for those eyeing altcoin trades!
🟢 Long-Term Bullish Scenario: If dominance builds a solid base at 56% and starts climbing again, it could aim for 64% and even push toward 68–70%. If this plays out, Bitcoin’s gonna take charge of the market again, and altcoins might feel the heat.
The Bottom Line:
Short-Term: A drop to 56% could mean altcoins steal the show. Keep an eye on this level!
Long-Term: If Bitcoin flexes its muscles and dominance climbs to 68–70%, it’s probably time to lean heavier into BTC in your portfolio.
✍️ This analysis can be a solid guide for balancing your portfolio between Bitcoin and altcoins. Watch those 56% and 60% levels closely to make smart moves!
Q4 forecast for BTC.DBTC.D will continue to climb up until end of October aprox. which would represent in BTC pumping harder than alts slowly grinding up.
Once the bull market support band (21W EMA+ 20W SMA) gets penetrated, I expect alts to follow up on BTC's move. Right after this happens there should be a high OI increase that must need to be flushed a little specially on alts.
End of Q4 should be the birth of this cycle's alt season.

A BULL RUN IS LOADING #BTC.D #BULL RUN #ALTSEASONHay Guys,
I Have been into this Space since 2016- 2017 and I have seen the Bull and Bear Market, This Industry changed a lot in this Long period.
I am getting the Full send Vibes LIke 2017 once again those were the days when ALT were making 10x 20x 100x,
if you see the Dominance chart it is clearly indicating that the drop of Dominance would be Imminent , currently it is at 58.75% Level and I am anticipating it will touch 43 to 45% Level
10% DROP in dominance is huge and altcoin will give Multiple fold Return.
Prepare yourself for the huge Moment.
Disclaimer:- This is not a Financial advice do your own research and take this as an educational post only.
Thanks

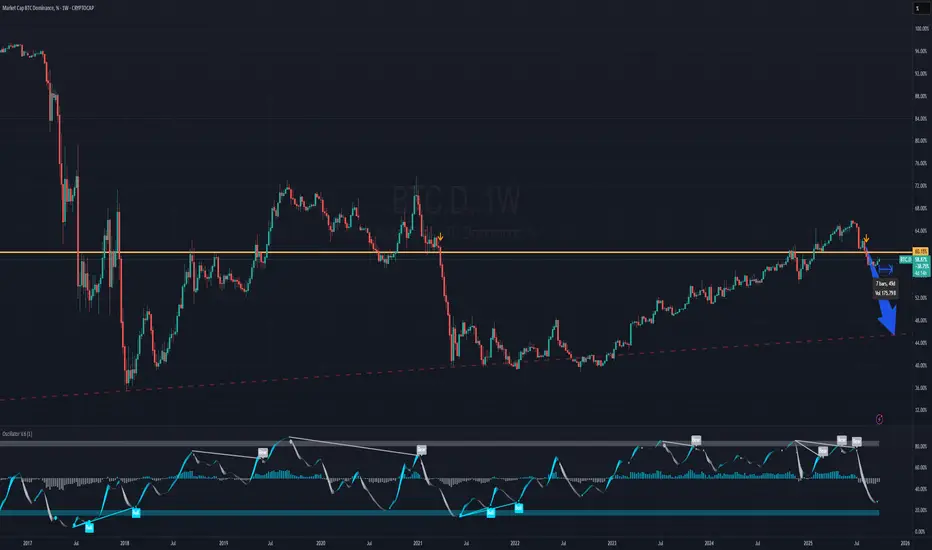
BTC.D: Possible Take Profit zone for AltcoinsBTC Dominance analyses based on the Weekly chart.
I expect a move towards the red uptrend line. which is ~45.50% on 24 november.
Setting an alert for on 48% is advisable so you can pay attention.
Bitcoin DominanceMy gap fill to 95% was thwarted by a nice woman who explained to me why stablecoins will prevent a gap close. So far, she's right. The ratio came down and bounced off the bottom of it's localized bull fib. If you zoom in, you can see how it played in the fibs on the daily candle.
It can punch through and fall out to another touch of the Macro bear fib, and then go for 95%. Or maybe we get a legitimate bounce off the bottom of this micro fib. I'm not married to an outcome either way. I just wanted to bring it to people's attention that a 95% gap-close is a distinct possibility.
BTC.D Chart AnalysisBTC.D chart shows us the overall health of Alt Coins.
If it is going up, this means that most of investment is going in BTC, which is why it is dominating the crypto market.
Moneyflow is in BTC, and not in ALT coins.
For ALT coins to perform, BTC.D has to go down.

#BTC.D 4H ChartBitcoin dominance is currently retesting the support at 58.84%. If it breaks below it, we could expect further short-term bearish movements towards the 100MA.

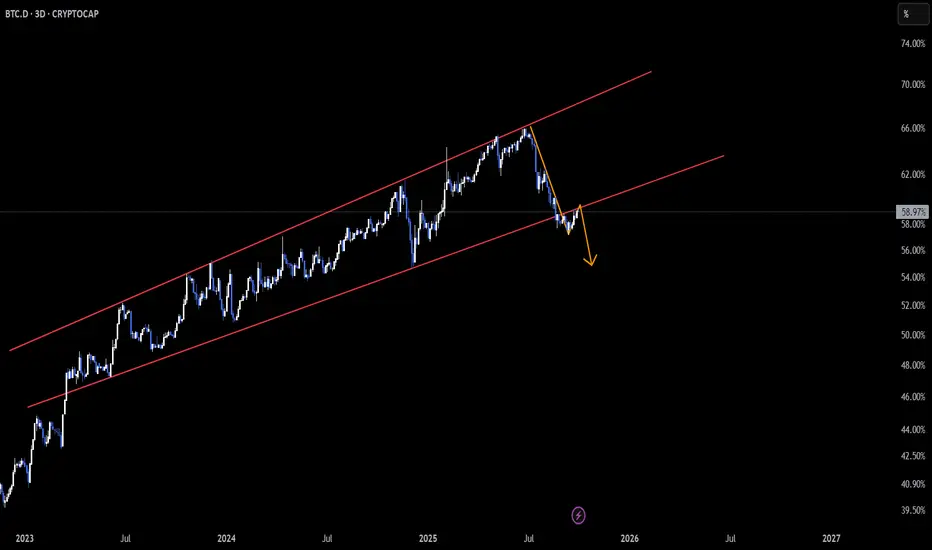
BTC.D – Retesting After Broadening Channel Breakdown
📆 On the 4H timeframe, Bitcoin Dominance broke down from the broadening channel and is now retesting that structure as resistance ⚠️.
A rejection here could create space for altcoins to gain momentum, while a reclaim might tighten liquidity back into BTC.
👀 Crucial retest in play — watch closely for confirmation!
Not financial advice.
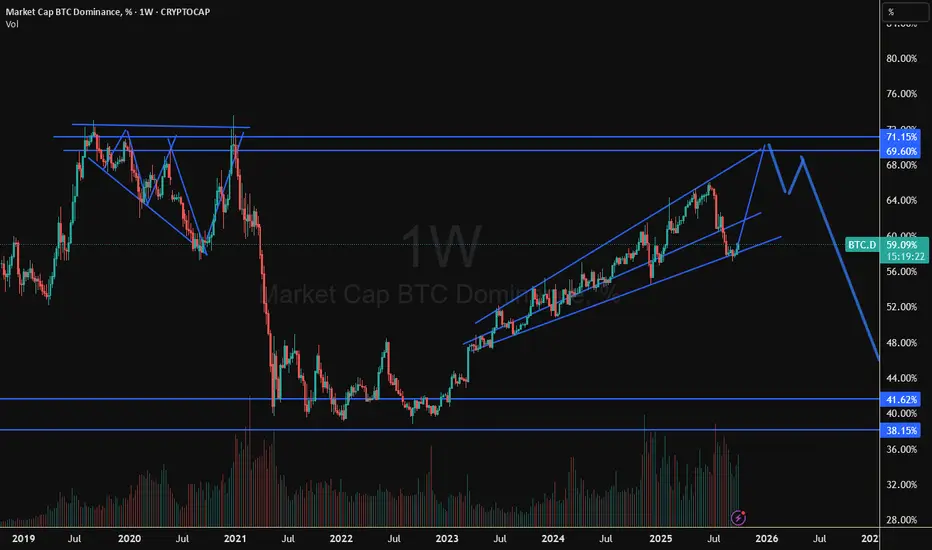
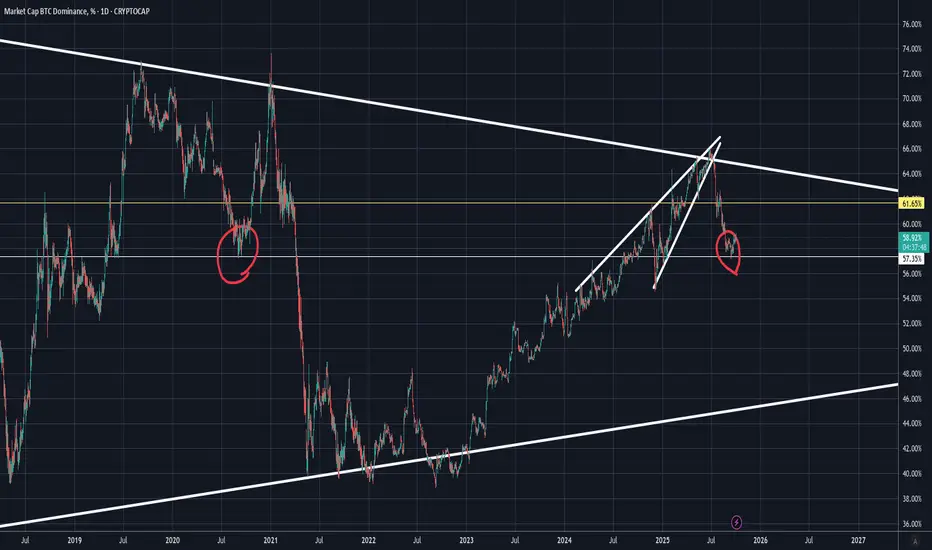
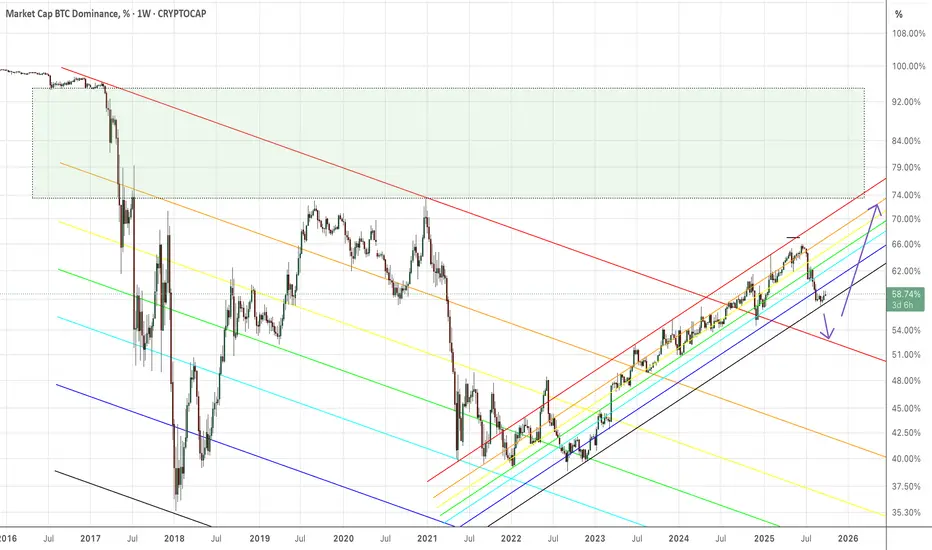
BTC DOMINANCE vs ALTs according to the last 2021 cycle towards The 2021 pattern saw a sharp BTC.D peak and crash early. The current cycle shows a resilient BTC.D challenging major long-term resistance. The timing of the next explosive Altcoin Season (rotation) is likely conditional on a clear rejection and subsequent drop of BTC.D from the 70% zone, which would signal the shift of institutional and retail capital into the broader altcoin market.

#BTC.D 4H ChartBitcoin dominance is currently moving up aggressively after breaking the S/R Flip at 58.85%. If it breaks above 59.14% then we would expect further short-term bullish movements towards the 1h supply at 59.3%.

$BTC.D (4-hour): nasty HEAD & SHOULDERS pattern. CRYPTOCAP:BTC with a nasty HEAD & SHOULDERS pattern and the ETFs (both Bitcoin and CRYPTOCAP:ETH and over a billion $ in inflows yesterday, combined) with a GOD CANDLE.
This is time for buying rather than selling.
The dominance chart still BULLISH on all timeframes and bang on at the top of my key support zone (highlighted on the chart, top at 58.85%).
Being a buyer makes sense here, institutional money is NOT going away, clearly.
They are preparing for Q4. Just saying.
👽💙

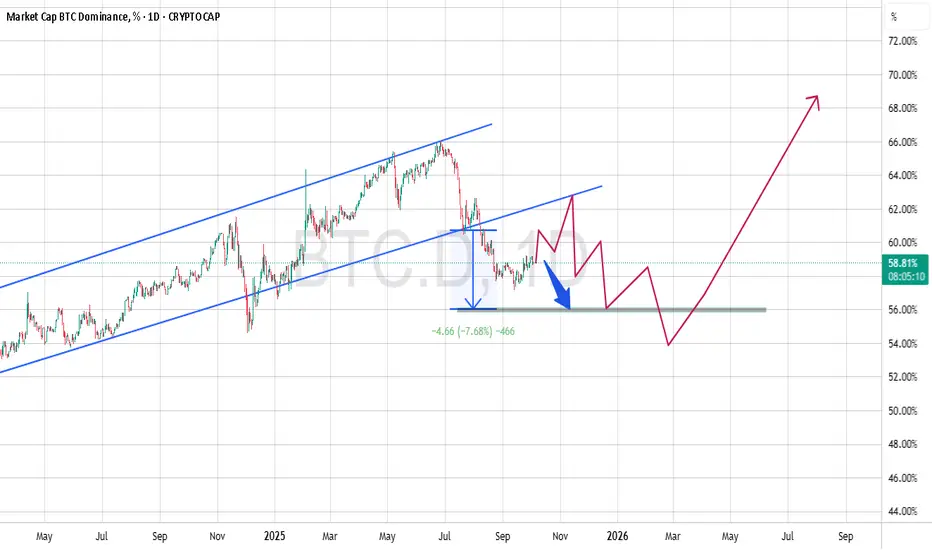
BTC.D Update – Monday 29.09.2025📊 📊 BTC.D Update – Monday 29.09.2025
Alright Members, let’s talk Alts! 🚀
As I mentioned in my last analysis, Bitcoin Dominance started a retracement last week and reached our black line (Arrow #3) perfectly ✅. So far, everything is moving according to plan.
We even saw dominance break below the black area for a moment, but the very next day it reversed right back inside. That tells us one thing 👉 dominance is still in a downtrend.
⚡ Here’s the key:
* If Bitcoin continues its uptrend and BTC.D breaks below our black line (Arrow #4 downside) → this would be a strong bull run signal for ALTS. 🌊
* Until then, expect accumulation near Arrow #3 and distribution near Arrow #4.
👉 My view hasn’t changed: Patience is power. Better to wait for a clear direction before jumping into new trades. The market is setting up something big — timing it right will make all the difference.
Stay sharp, stay motivated, and remember: discipline now = profits later. 💪🔥
Alright Memebrs, let’s talk Alts! 🚀
As I mentioned in my last analysis, Bitcoin Dominance started a retracement last week and reached our black line (Arrow #3) perfectly ✅. So far, everything is moving according to plan.
We even saw dominance break below the black area for a moment, but the very next day it reversed right back inside. That tells us one thing 👉 dominance is still in a downtrend.
⚡ Here’s the key:
* If Bitcoin continues its uptrend and BTC.D breaks below our black line (Arrow #4 downside) → this would be a strong bull run signal for ALTS. 🌊
* Until then, expect accumulation near Arrow #3 and distribution near Arrow #4.
👉 My view hasn’t changed: Patience is power. Better to wait for a clear direction before jumping into new trades. The market is setting up something big — timing it right will make all the difference.
Stay sharp, stay motivated, and remember: discipline now = profits later. 💪🔥

#BTC.D 6H ChartBitcoin dominance bounced off the EMAs and it is currently trying to break through the resistance at 58.85%. If successful, then we would expect it to retest the 200MA as a short-term target.

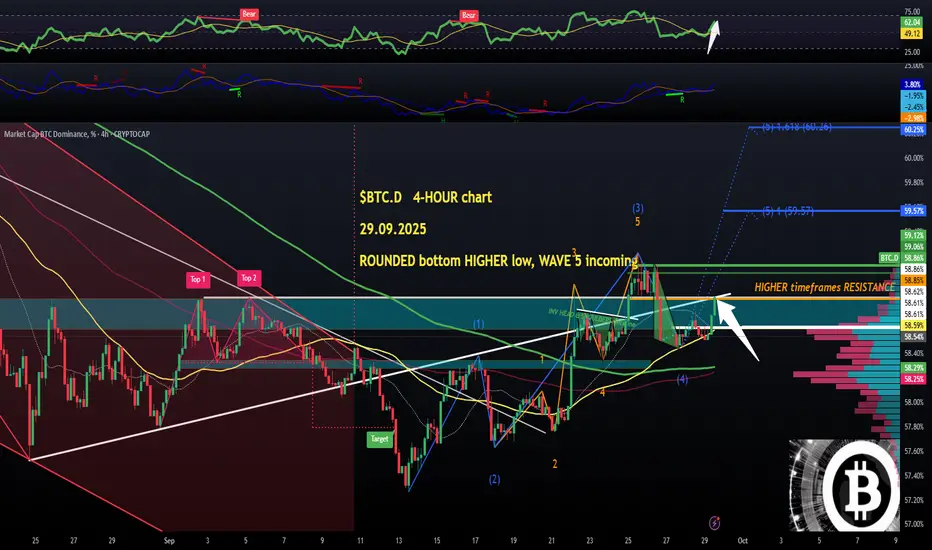
$BTC.D (4-hour chart): ROUNDED bottom HIGHER LOW, WAVE 5 onEverything about the CRYPTOCAP:BTC DOMINANCE lower timeframes charts (1 and 4-hour tfs) is just bullish apart from the fact that it still has to cross above last bits of higher timeframes resistance zone (58.85 - 59%).
Which is what it is trying to do now. Once above 59% the impulsive WAVE 5 should explode upwards and aim as high as 60%+.
That would be ultra bearish for altcoins, I don't have to repeat.
Picking and choosing entries is the only strategy that can succeed this week. Tread wisely👽💙