Bitcoin DominanceMy gap fill to 95% was thwarted by a nice woman who explained to me why stablecoins will prevent a gap close. So far, she's right. The ratio came down and bounced off the bottom of it's localized bull fib. If you zoom in, you can see how it played in the fibs on the daily candle.
It can punch through and fall out to another touch of the Macro bear fib, and then go for 95%. Or maybe we get a legitimate bounce off the bottom of this micro fib. I'm not married to an outcome either way. I just wanted to bring it to people's attention that a 95% gap-close is a distinct possibility.
Trade ideas
BTC.D Chart AnalysisBTC.D chart shows us the overall health of Alt Coins.
If it is going up, this means that most of investment is going in BTC, which is why it is dominating the crypto market.
Moneyflow is in BTC, and not in ALT coins.
For ALT coins to perform, BTC.D has to go down.

#BTC.D 4H ChartBitcoin dominance is currently retesting the support at 58.84%. If it breaks below it, we could expect further short-term bearish movements towards the 100MA.

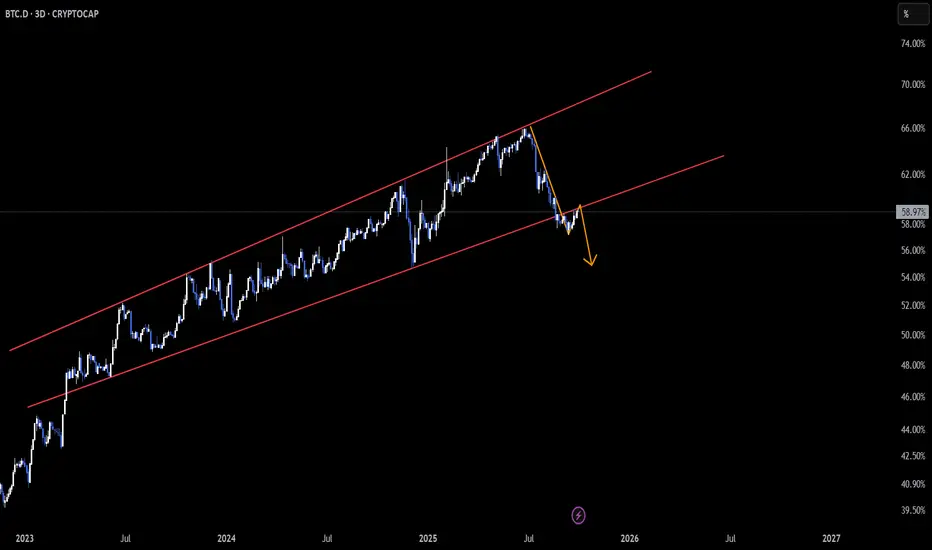
BTC.D – Retesting After Broadening Channel Breakdown
📆 On the 4H timeframe, Bitcoin Dominance broke down from the broadening channel and is now retesting that structure as resistance ⚠️.
A rejection here could create space for altcoins to gain momentum, while a reclaim might tighten liquidity back into BTC.
👀 Crucial retest in play — watch closely for confirmation!
Not financial advice.
BTC DOMINANCE vs ALTs according to the last 2021 cycle towards The 2021 pattern saw a sharp BTC.D peak and crash early. The current cycle shows a resilient BTC.D challenging major long-term resistance. The timing of the next explosive Altcoin Season (rotation) is likely conditional on a clear rejection and subsequent drop of BTC.D from the 70% zone, which would signal the shift of institutional and retail capital into the broader altcoin market.

#BTC.D 4H ChartBitcoin dominance is currently moving up aggressively after breaking the S/R Flip at 58.85%. If it breaks above 59.14% then we would expect further short-term bullish movements towards the 1h supply at 59.3%.

$BTC.D (4-hour): nasty HEAD & SHOULDERS pattern. CRYPTOCAP:BTC with a nasty HEAD & SHOULDERS pattern and the ETFs (both Bitcoin and CRYPTOCAP:ETH and over a billion $ in inflows yesterday, combined) with a GOD CANDLE.
This is time for buying rather than selling.
The dominance chart still BULLISH on all timeframes and bang on at the top of my key support zone (highlighted on the chart, top at 58.85%).
Being a buyer makes sense here, institutional money is NOT going away, clearly.
They are preparing for Q4. Just saying.
👽💙

BTC.D Update – Monday 29.09.2025📊 📊 BTC.D Update – Monday 29.09.2025
Alright Members, let’s talk Alts! 🚀
As I mentioned in my last analysis, Bitcoin Dominance started a retracement last week and reached our black line (Arrow #3) perfectly ✅. So far, everything is moving according to plan.
We even saw dominance break below the black area for a moment, but the very next day it reversed right back inside. That tells us one thing 👉 dominance is still in a downtrend.
⚡ Here’s the key:
* If Bitcoin continues its uptrend and BTC.D breaks below our black line (Arrow #4 downside) → this would be a strong bull run signal for ALTS. 🌊
* Until then, expect accumulation near Arrow #3 and distribution near Arrow #4.
👉 My view hasn’t changed: Patience is power. Better to wait for a clear direction before jumping into new trades. The market is setting up something big — timing it right will make all the difference.
Stay sharp, stay motivated, and remember: discipline now = profits later. 💪🔥
Alright Memebrs, let’s talk Alts! 🚀
As I mentioned in my last analysis, Bitcoin Dominance started a retracement last week and reached our black line (Arrow #3) perfectly ✅. So far, everything is moving according to plan.
We even saw dominance break below the black area for a moment, but the very next day it reversed right back inside. That tells us one thing 👉 dominance is still in a downtrend.
⚡ Here’s the key:
* If Bitcoin continues its uptrend and BTC.D breaks below our black line (Arrow #4 downside) → this would be a strong bull run signal for ALTS. 🌊
* Until then, expect accumulation near Arrow #3 and distribution near Arrow #4.
👉 My view hasn’t changed: Patience is power. Better to wait for a clear direction before jumping into new trades. The market is setting up something big — timing it right will make all the difference.
Stay sharp, stay motivated, and remember: discipline now = profits later. 💪🔥

#BTC.D 6H ChartBitcoin dominance bounced off the EMAs and it is currently trying to break through the resistance at 58.85%. If successful, then we would expect it to retest the 200MA as a short-term target.

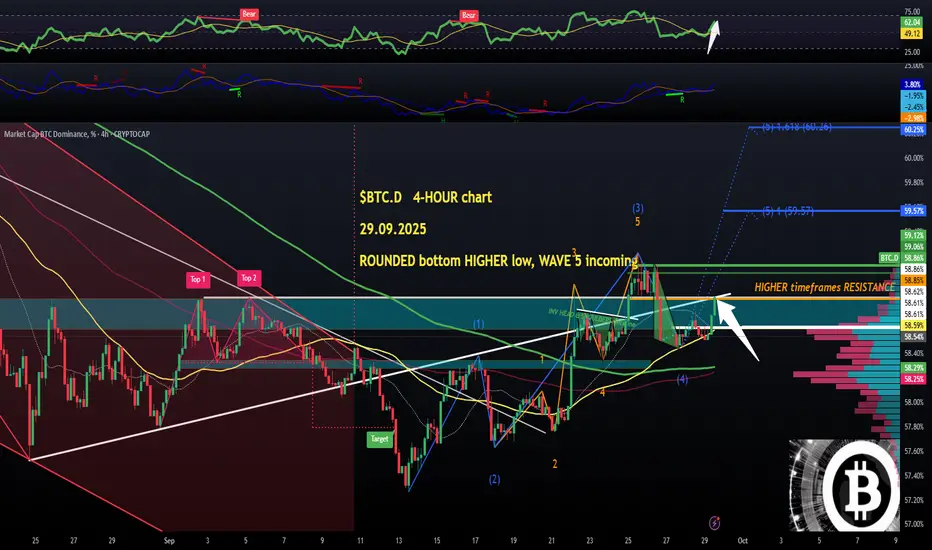
$BTC.D (4-hour chart): ROUNDED bottom HIGHER LOW, WAVE 5 onEverything about the CRYPTOCAP:BTC DOMINANCE lower timeframes charts (1 and 4-hour tfs) is just bullish apart from the fact that it still has to cross above last bits of higher timeframes resistance zone (58.85 - 59%).
Which is what it is trying to do now. Once above 59% the impulsive WAVE 5 should explode upwards and aim as high as 60%+.
That would be ultra bearish for altcoins, I don't have to repeat.
Picking and choosing entries is the only strategy that can succeed this week. Tread wisely👽💙
Bitcoin dominanceBTC.D is likely to move higher toward the trendline. Wait for confirmation of a breakdown before it crashes lower, triggering a massive altseason.
I think we will follow a similar path as the last cycle.

Bull Run Catalyst?This rejection in the 4H timeframe should confirm a Head and Shoulders in the Bitcoin Dominance chart which should be self explanatory to seasoned traders.

BTC.D Alt coins updatewait for the monthly candle closure and to form a fvg / gap, whenever it taps into the monthly fvg, start acculumating altcoins, invest good in stronger altcoins like ETH, Link, ENA, SEI, INJ and stronger memes like Doge, Fartcoin, Bonk and Turbo. These pairs are my favourite and will outperform in alt season. Because btc.d is strongly bearish that's why not giving any short signal for alts, ignore what's BTC doing. Market makers are just flushing the long / buyers before a strong impulsive moves. October first week or maybe the 2nd week may go in red then the real strong move will start. Market makers are just showing the market is strongly bearish, shifted structre to the downside trapping all smc/ict traders and other breakout traders to trap for short selling as they did in feb. Best Of Luck.

BTC Dominance analysis!BTC dominance has fromed a harmonic pattern, and from the current structure I think it could rise into the 61–62% zone.
If that plays out, it would likely pressure altcoins to the downside, as money rotates back into Bitcoin.
It’s always tough to watch traders and investors lose money during these cycles — but unfortunately, that’s how markets work: capital flows shift, and not every phase favors every asset.
🎯 Conclusion: My view is that BTC dominance will likely climb into the 61–62% region, which may weigh on altcoins in the short term.
👉 For more structured market insights and professional analysis, follow along.

$BTC.D... Dominance STUCK between 58.85% and 59.15%. NEXT MOVE..No man's land time in crypto atm as both CRYPTOCAP:BTC and CRYPTOCAP:ETH ETFs had a QUARTER billion worth outflows yesterday, which is not a good sign in the current situation.
I will make a separate #ETH update, but the Bitcoin DOMINANCE chart has been showing some signs of weakness, basically got stuck in a range between 58.85 and 59.15% creating a RECTANGLE.
Easy to use, it breaks down below the pattern - great for alts, it breaks out above it, very bad for alts. Why overcomplicate this. It works as the best fundament before making any leveraged decisions.
This is the HOURLY, but remember the DAILY is just bullish, still. Next post on the 4-HOUR chart👽💙

Just testing support. Just like when a coin or a stock that goes up comes back and does a retest of support, that's what happens when it goes down, it's doing a retest of support, and that's what's going on with Bitcoin right now at these levels.

Bitcoin dominance VS. Altcoins run phaseBTC dominance has broken below its major uptrend, and we may see very positive movements in altcoins in the coming period.

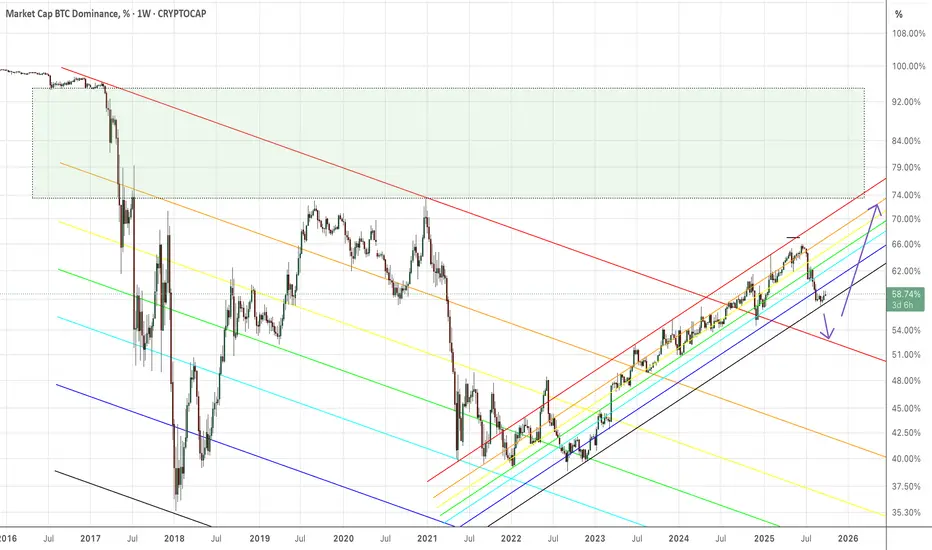
BTC.DOMINANCE WEEKLY CHART UPDATE !!BTC Dominance (BTC.D) Weekly Chart Analysis
BTC dominance is currently at 58.94%, bouncing from the key support zone near 56%–57% (yellow area).
Resistance: Around 60%–61%, aligned with the 50-week MA.
Support: Strong support at 56%, critical for bulls to defend.
If BTC.D holds above 57%, it could retest 62%, strengthening BTC’s position over altcoins.
However, a break below 56% may trigger a drop toward 54%–55%, signaling a potential altcoin rally.

Last hope for altcoins?In my view current BTC dominance rebound is not over but I think we could se a fall under 56%

BTC Dominance !Important Levels to look for are;
1. 59.2%
2. 57.1%
It has to break 57% Level with a big red atleast on 4h.
A Rising Broadening Wedge on Weekly is also a positive signal for it to break 57% level.
POI: If we go step by step, POI is at 58.1% it has to break that if take it step by step! ALT Season will not begin until it breaks 57%!

$BTC.D ... INVERTED HEAD & SHOULDERS hits its target at 59.07%Okay so I have been posting these CRYPTOCAP:BTC DOMINANCE warning pieces and they get very few views, oddly.
I find it hilarious, actually, the fact that whenever I post about a hot shitcoin, I can get tens of thousands of views, and when I post the most important charts for the market, no reactions, the lowest views.
Anyways, the INVERSE Head and Shoulders breakout is slowly reaching its 59.07% target and now the HOURLY chart is showing a BEAR RSI divergence which suggests that the momentum is slowimg down for the #dominance which could help #Alts revover, at least temporarily.
Don't fall into a trap longing stuff just because it has corrected. Long the strongest looking ones with the BULLISH reaction signs like Bullish DIVERGENCES, good support bounces etc.
$ASTER post next, stay tuned💙👽


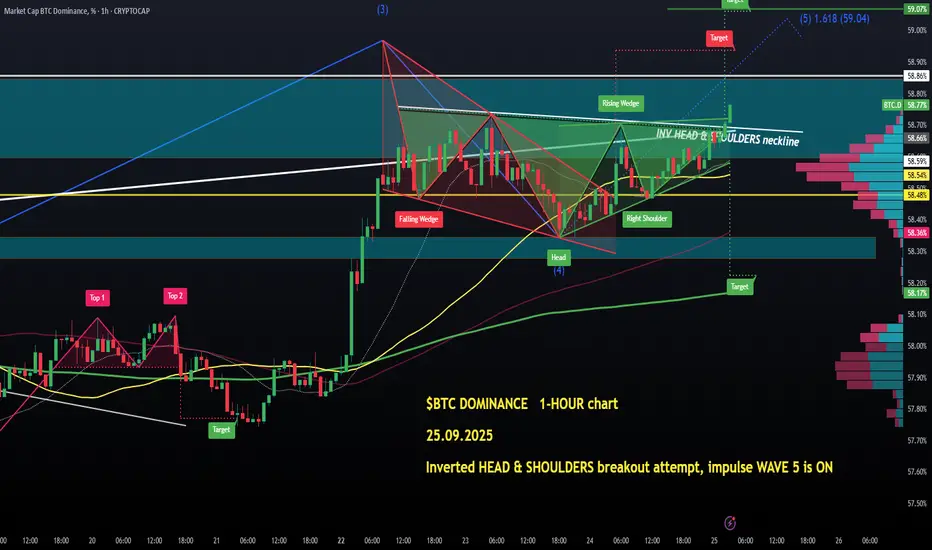
$BTC.D - INVERTED HEAD & SHOULDERS breakout attempt, WAVE5 is ONThis CRYPTOCAP:BTC DOMINANCE question was in 4 of my posts yesterday as I was warning about the BULLISHNESS building and the impulsive WAVE 5 incoming.
Looks like we are seeing the worst case scenario (for #Alts lol) unfolding as #BTCdominance is attempting a breakout from its BULLISH chart pattern (inverse head & shoulders targetting 59.07%).
Details on the updated HOURLY chart and in the quoted post from yesterday.
Protect your capital, kids. 👽💙