ALTSEASON SIGNALS ARE STRENGTHENING !🚀 ALTSEASON Signals Are Strengthening!
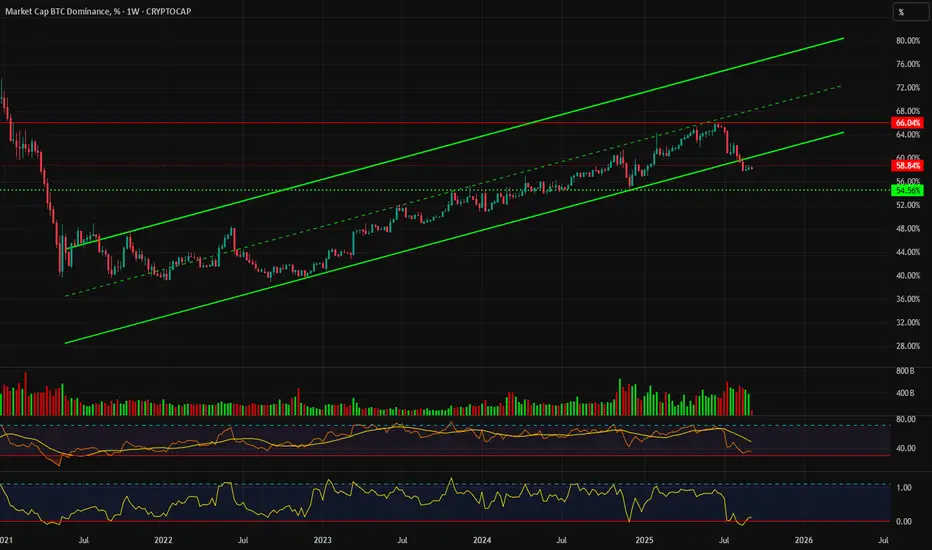
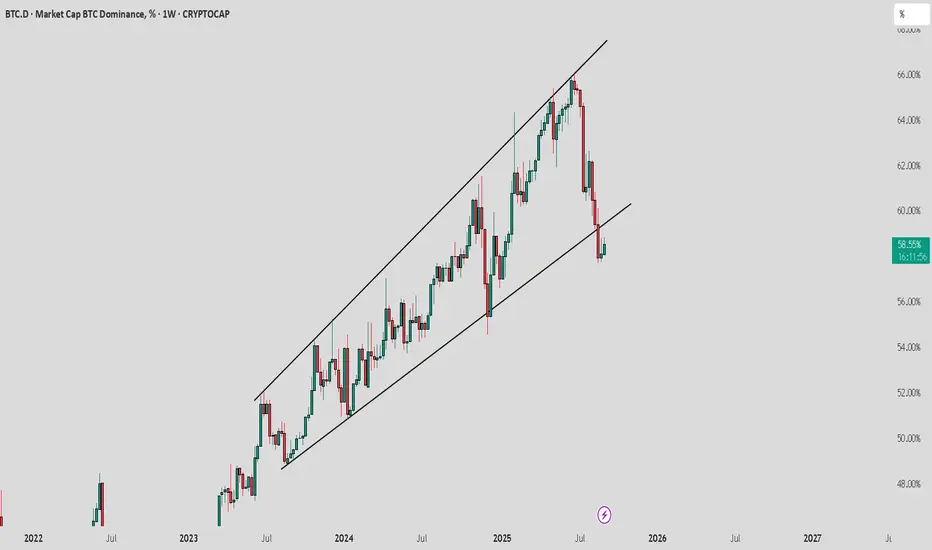
BTC Dominance (BTC.D) just made a clear rejection at the upper trendline (Lower Highs) of the 8-year Triangle.
If August’s monthly close lands below the 1W MA50 (red), we’ll have strong confirmation of a new bearish phase.
📉 The 1M LMACD is on track to print its first Bearish Cross in 4+ years, a setup that historically leads to prolonged BTC.D downtrends.
A move toward the Higher Lows trendline near the 0.1 Fibonacci level looks likely — similar to the last major drop.
🎯 Target: 43.00% BTC Dominance
This shift would mark a major tailwind for altcoins — classic ALTSEASON territory.
Trade ideas

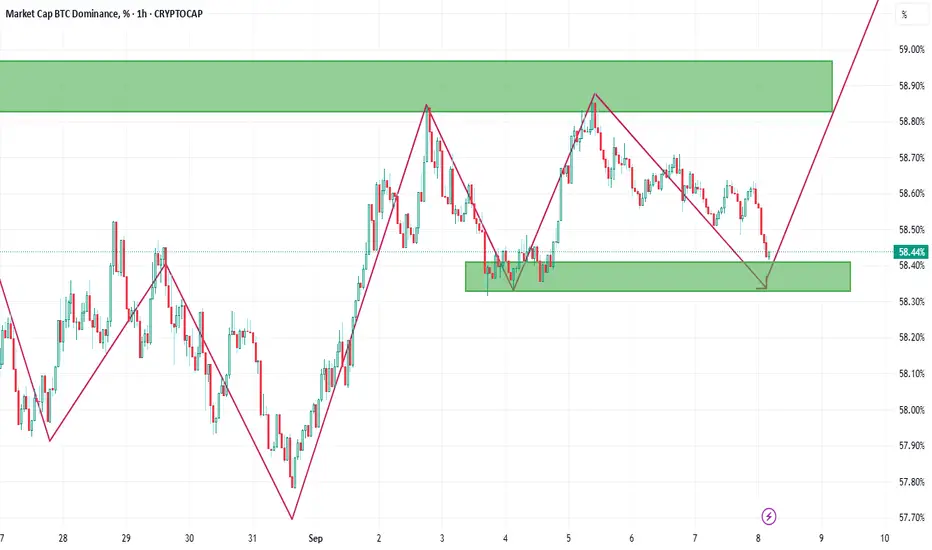
#BTC.D 4H ChartBitcoin dominance moved up aggressively and it is close to testing the premium 4h supply zone as well as the 100MA. It is expected to retrace from that area once it taps into it.

BTC.D ON SUPPORT. Following my previous outlook: #BTC.D is now sitting right on key support around 57% 🎯
Upper resistance/retest zone: 60.00% - 60.50%
Looks like we could see a bullish retracement coming for the #alts market! 👀🚀
(bull cycle phase?)


Others vs high capsThis is an inverse correlation between btc.d+eth.d+usdt.d+usdc.d and others (below top 10 altcoins), right now we are seeing a change on dominance of crypto market. Both charts are crossing each other growing probabilities of a higher dominance of alts on crypto environment. Not financial advice, take your own finance decisions based on your own research.

WANT TO BEAT THE MARKET WITH CONFIDENCE?? 🚀 Want to beat the market and trade with confidence?
Follow me for expert insights and clear setups!
Back in July, I called the #BTC Dominance top before anyone else and predicted the #alts season.
That move shifted billions in capital across the market; those who followed were ahead of the game! 🏆
Every week, I share exclusive #BTC outlooks and in, depth weekly market reports with over 90% accuracy and always ahead of the curve.
Today’s spotlight:
🗓 04/09 #BTC Dominance vs now… 🎯
Key support zone: | 53% |
If we break below this levels, get ready for a big shift of capital into #alts!
Join the community, stay one step ahead, and take your trading to the next level! 🔥

Possible resistance for BTC dominanceIt seems like a resistance is forming here, where Bitcoin's percentage of the market will not drop any lower than this.

#BTC.D 4H ChartBitcoin dominance tapped into the 2h demand zone where it bounced from as predicted. We should now see some upward movements towards the 58.1% area as a short-term target.
We are so close All we need is that one push to get this alt party really started.
A lot of good signs all across the board including total 3

#BTC.D 2H ChartBitcoin dominance got rejected off our breaker zone and it is currently retesting the 4h demand zone. We should see it bounce from that area and wait for lower timeframe confirmation before expecting bullish movements again.

BTC.D Breaking Down from a 3 year Run.BTC.D finally breaks down and gives way to ALTS!! We have been waiting for this for years watching BTC.D just dominate the market and finally it breaks ETH is well positioned for a 10k Run!
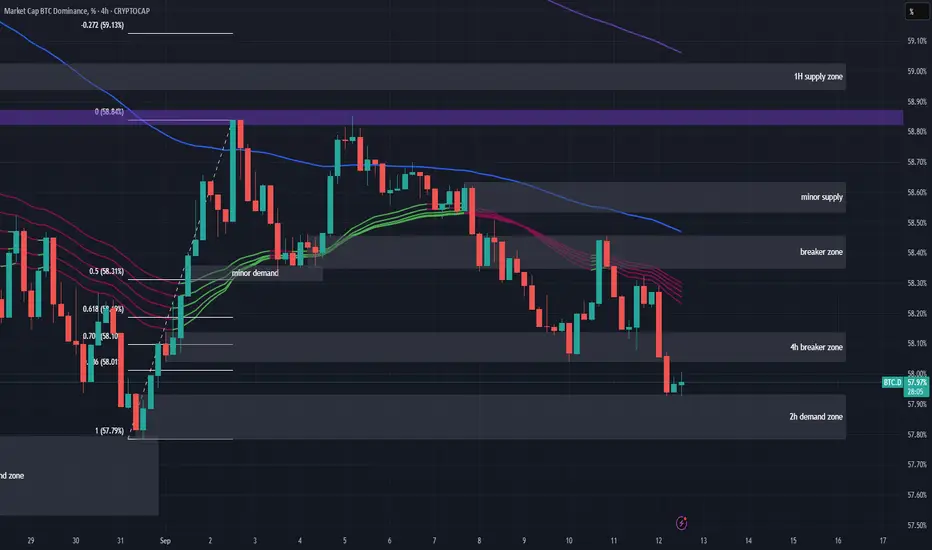
#BTC.D 4H ChartBitcoin dominance broke through the breaker zone at 58.4% and it is currently close to testing the discounted 4h demand zone at around 58.1%. We shall wait for lower timeframe confirmation once it taps into this area of demand before expecting a bullish reversal.

**BTC Analysis** Current market sentiment for Bi**BTC Analysis**
Current market sentiment for Bitcoin is cautiously optimistic. A key technical support level has formed around $60,000. If this level holds, it could attempt another rally towards previous highs. However, strong resistance exists in the $68,000-$70,000 zone, and a breakout would require significant capital inflow. Macro-wise, the market is assessing Federal Reserve rate cut expectations and ETF flows, which are the primary short-term drivers. The price will likely consolidate at high levels to absorb profit-taking and accumulate energy. Traders should closely monitor volume and the battle at key levels, guarding against false breakouts. The overall trend remains intact, but volatility is expected to increase.
Crypto Tip of the DayCrypto Tip of the Day 🚨
Buying shitcoins is like buying lottery tickets — except the odds are even worse. 🎰🚮
If you really want to survive (and thrive) in this market, stick to altcoins with strong fundamentals. 💡
Remember: not every pump is an opportunity — sometimes it’s just a trap. 🪤

#BTC.D 2H ChartBitcoin dominance is currently ranging inside the minor demand zone. If this area does not hold, then we would expect it to reach the discounted breaker zone at 58.2% as a short-term target.

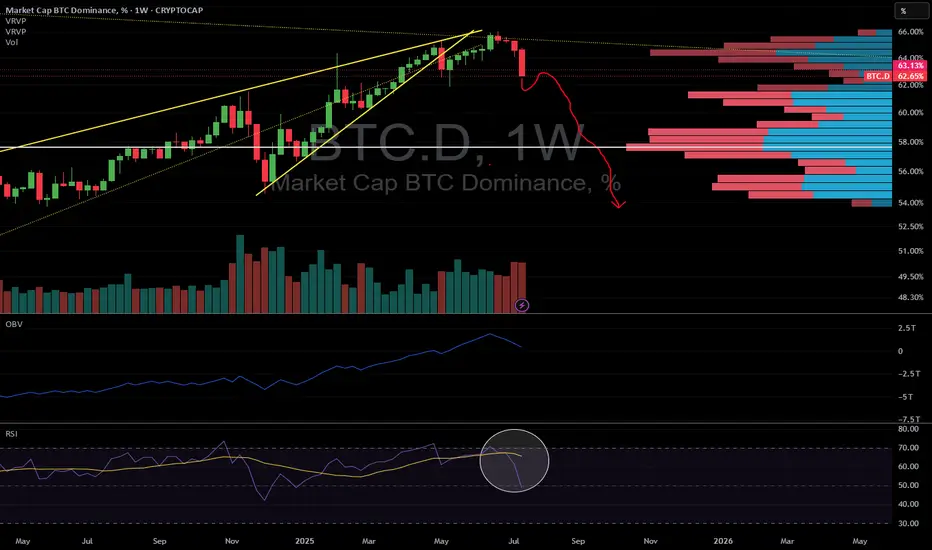
Dominance breaking down signals Altseason is here !!There is no doubt in my mind that an Altseason is now in progress !
The May2025 low has been taken out.
Now things will start accelerating.
We could have a backtest of the resistance at 63.13 % (dotted fuxia line).
But we also could not !!

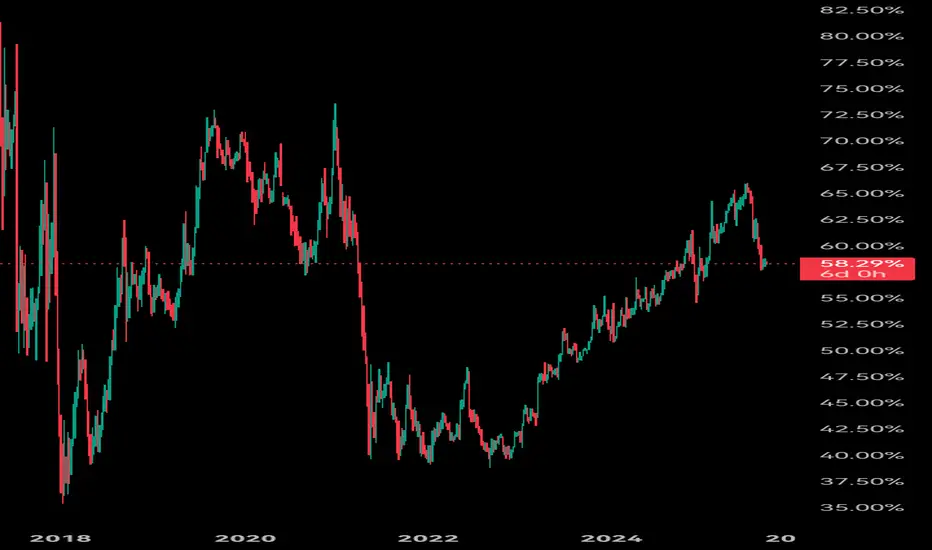
bitcoin dominance weekly analysis In weekly time frame analysis, we see BTC in an ascending channel and then later breaking down the channel thus signaling a shift from uptrend to a downtrend. From a top-down analysis that is from big time frame to small time frame, we might have a short-term retest back to the downtrend line of the channel before running back in the down trend which will inversely mean that the altcoin season is gaining momentum, by this we simple mean when the BTC.D is in downtrend the altcoins are in uptrend . let's wait and see
After Last Altseason, Confidence in Altcoins is Shattered?🚀 Bitcoin has been booming lately, but most altcoins are still lagging behind 📉
Many altcoins crashed over 90% after the last altseason 😬💔. This massive drop seems to have shaken investors’ confidence in altcoins, making people more cautious and hesitant to jump in again.
Even with BTC rising, the market sentiment for altcoins remains weak.
Do you think altcoins can regain trust, or is the market still skeptical? 🤔👇

#BTC.D 2H ChartBitcoin dominance is currently retesting the 200MA. It is expected to tap into the minor demand zone at around 58.4% before potentially bouncing off again.

BTC.D : Moving upward to retest ascending channelBTC.D (1W Update)
Bitcoin dominance has broken down from the ascending channel and is now heading for a retest.
If this retest fails to reclaim the channel, it could trigger a huge rally in altcoins over the long term — just a matter of time.
Keep a close watch, as confirmation here will decide the next big move for the market.
The Death Cross That Could Ignite Altcoins !Hello Traders 🐺
As you might already remember, I’ve been talking about the Altcoin Season 2025 since the last Black Monday when ETH was around $1400! I’ve constantly said that we’re about to see a major pump in the altcoin section.
But what are my price targets now? Do I still believe we’re heading higher for ETH and other altcoins, or are we at the beginning of the end? Let’s break it down 👇
When I pulled up the BTC.D chart, I realized something mind-blowing. On the weekly chart, after breaking the ascending channel that lasted for at least 4 consecutive years (yes, 4 years!), this is — in my humble opinion — a crazy move for BTC.D and especially altcoins. Still, many think this is just “normal” market movement… but let’s be honest with ourselves.
If you look back at the last Altcoin Season, you’ll see that when price reached the descending resistance and broke below a major support (just like now), we also had a Death Cross — a massive warning sign for anyone bearish on altcoins.
Now we have the exact same setup:
BTC.D broke below the channel support.
A death cross is forming.
The Fed is about to shift monetary policy — most likely with a rate cut this month since the risk of recession is now much higher than inflation risk.
Jobless claims are surging like never before since 2021 — which, by accident, was the exact time when the Fed started cutting rates before the previous Altcoin Season.
📉 Targets:
If you zoom in on the chart, you’ll see BTC.D needs to break below the previous low — and then it can drop even further toward the 49% area, a major support zone.
This could be the trigger for the real altcoin season of 2025.
I hope you enjoy this idea, and as always, remember our golden rule:
🐺 Discipline is rarely enjoyable, but almost always profitable 🐺
🐺 KIU_COIN 🐺

