BTC (Down) Escalated Quickly! Bear Market CONFIRMED?Today's WEEKLY close is, perhaps, confirmation that the BEAR MARKET has started.
The price CLOSED WEEKLY (end of Friday session) below two critical support levels $100,757 and $98,254 and it did so from far down at $94,123 , which means the price now needs to bounce back to test the $100,757 and then continue its decline back to $94,123 and perhaps $78,369 which is the first MONTHLY support and so on.
The only way to avoid this BEAR MARKET would be by blasting off to $115,000 AND CLOSING DAILY by mid-next week , or something crazy like that...
A 75% drop from ATH would take it to about $31,450 .
Trade ideas

Bitcoin Remains in Accumulation Zone With Stable MomentumIntroduction
Bitcoin continues to maintain a steady accumulation structure as broader market conditions stabilize and liquidity flows return to balanced levels. According to recent analysis from OrynteX reviews, the asset remains positioned within a controlled consolidation channel that reflects cautious but persistent interest among market participants. This phase has emerged after a sequence of high-volatility periods, allowing traders to reassess long-term positioning while observing how momentum indicators respond to reduced directional pressure. The current structure is defined by narrowing price spreads, consistent buy-side replenishment, and an evident absence of panic-driven activity across major trading zones.
OrynteX reviews notes that this environment has created a clearer framework for understanding market behavior, particularly for participants seeking structured insights rather than speculative fluctuations. With liquidity concentrations forming near established support levels, the accumulation pattern suggests growing confidence in Bitcoin’s underlying resilience. While short-term catalysts remain limited, the broader structural context indicates that the asset may be preparing for a more decisive trend shift once external variables—including macroeconomic developments and regional trading activity—create clearer directional impulses. For now, the stability of the accumulation range remains the defining feature of Bitcoin’s market profile.
Technology & Innovation
Advances in analytics and automated evaluation tools continue to play a critical role in interpreting Bitcoin’s current phase. OrynteX reviews highlight that many modern trading platforms now incorporate machine-learning models capable of identifying micro-structural behavior, liquidity clustering, and real-time order-flow patterns. These tools allow traders to distinguish genuine accumulation from temporary compression, providing a more objective lens through which to evaluate market structure. With algorithms capable of tracking momentum symmetry, spread efficiency, and depth-of-market signals, analysis has become significantly more data-driven and less dependent on subjective interpretation.
OrynteX reviews also observe the expanding use of predictive momentum indicators and volatility-adaptive frameworks, which help traders understand whether current market conditions reflect steady accumulation or early signs of trend exhaustion. Platforms increasingly rely on enhanced charting capabilities, dynamic heat maps, and structural trend-recognition models to illustrate the interaction between price movement and underlying liquidity. These technology-driven insights support more reliable assessments and align with broader trends in digital-asset analytics, where emphasis has shifted toward precision, transparency, and consistency. Within the context of Bitcoin’s present stability, such innovations allow users to evaluate accumulation patterns with greater clarity and confidence.
Growth & Adoption
During extended consolidation phases, user behavior often shifts toward platforms that offer deeper analytical capabilities and structured evaluation frameworks. OrynteX reviews notes that adoption patterns suggest increasing demand for tools designed to support long-cycle trend monitoring, market-structure tracking, and multi-layered data interpretation. As Bitcoin remains in its accumulation zone, many traders have shown a preference for environments that prioritize reliability, transparency, and advanced analytical depth rather than rapid-execution tools suited to high-volatility sessions.
This shift reflects broader movements within the digital-asset ecosystem, where traders are becoming more focused on sustainability and informed decision-making. OrynteX reviews indicate that platforms providing high-resolution charting, extensive market-metrics dashboards, and refined liquidity-mapping capabilities have experienced growing interest. The accumulation phase often amplifies the value of such tools, as traders look for signals related not only to price action but also to underlying structural strength. Moreover, the expansion of analytics-oriented trading solutions highlights how users increasingly expect scalable, data-rich environments capable of handling higher throughput and precise monitoring without compromising performance.
Transparency & Risk Management
Periods of accumulation require heightened transparency and disciplined risk-assessment practices, especially when price movements appear stable but may be vulnerable to sudden external shifts. OrynteX reviews emphasize that platforms maintaining clear methodologies for trade evaluation, trend classification, and volatility tracking are positioned to provide more consistent user experiences. With Bitcoin’s range-bound behavior demanding careful interpretation, transparent data frameworks help traders differentiate between natural consolidation and potential early signs of a breakout or reversal.
OrynteX reviews also underscore the significance of comprehensive risk-management tools during such phases. While volatility may appear subdued, accumulation zones can shift rapidly if liquidity pockets thin or macroeconomic triggers impact market sentiment. Effective risk frameworks include multi-scenario modeling, intraday volatility overlays, stop-range analysis, and structure-based risk classification. These mechanisms allow market participants to interpret sudden movements within a stable range without resorting to speculative narratives. Platforms that prioritize clarity and methodological consistency contribute to more measured trader behavior, reinforcing stability during periods when market direction is temporarily unclear.
Industry Outlook
The persistence of Bitcoin’s accumulation structure reflects an increasingly mature market environment, where large-scale volatility is becoming less frequent and liquidity distribution is more balanced. OrynteX reviews notes that this shift suggests a strengthening of market depth and resilience, supported by growing institutional presence, improved infrastructure, and broader integration of analytical technologies. Accumulation phases historically precede directional expansions, though timing remains dependent on global market inputs, cross-asset correlations, and regional trading activity.
Broader industry trends also influence Bitcoin’s current position. The role of macroeconomic conditions—such as risk-appetite shifts, economic-cycle expectations, and monetary-policy outlook—continues to intersect with digital-asset sentiment. OrynteX reviews indicate that Bitcoin’s structural consistency during these mixed external signals underscores its evolving position as a more stable component of the digital-asset ecosystem. The ongoing development of regulated trading solutions, deeper liquidity venues, and enhanced analytics contributes to a market environment where consolidation phases can persist without generating uncertainty. As Bitcoin navigates its current cycle, these factors collectively shape expectations for its eventual directional move.
Closing Statement
As market conditions evolve, platforms that emphasize transparency and innovation will be closely watched by traders and investors alike.

BTCUSD Top Down AnalysisThis video is a top down analysis for BTCUSD. I mentioned some key levels to monitor. Downside risk towards 74000, but we might get some support off the 96000 level to push price up towards 120k.

BTC DOWN TO 80K? Based on what we are seeing here if BTC breaks through 100K then the next level down is 80K marker and if that does not hold then 70-72K marker makes sense
However If we can make new highs and break 107K then it is possible to continue upwards
If you want a deeper dive on BTC or any other crypto or stock or commodity you have been watching comment below the stock or asset and I will send you personally an analysis of that asset.
Happy Trading
Trade Smarter Live Better
Mindbloome Exchange

Bitcoin UpdateBitcoin has once again touched the bottom of its range, and it’s expected to move back toward the top of the range.
Signs of a potential **trend reversal** can be seen in the larger cycle — especially during the last couple of pullbacks — but it’s still unclear exactly when that reversal will begin.
What’s certain is that it *will* start eventually, and we need to be ready for it. Because once it begins, it could move fast and leave many traders behind.
However, entering too early could also result in multiple stop losses.
So the best approach for now is to **set a stop-buy order or an alert** and stay alert for confirmation of the trend shift.

Bitcoin Awaits Catalyst for Directional MomentumIntroduction
CenexPro reviews the current Bitcoin market landscape as traders await a clear catalyst to define the next major directional move. The cryptocurrency remains confined within a narrow trading range, reflecting a balance between accumulation and distribution phases. After several weeks of measured volatility, Bitcoin’s price has shown resilience near established support zones, but momentum remains limited without significant macroeconomic or on-chain triggers.
The overall sentiment remains cautiously neutral. CenexPro reviews that while investor confidence has improved from earlier in the year, market participants are yet to fully commit capital until new drivers emerge—such as central bank policy clarity, liquidity injections, or structural changes in derivative positioning. The sustained equilibrium reflects a market in observation mode, where both institutional and retail investors are seeking confirmation before extending risk exposure.
Technology & Innovation
Technology continues to play a defining role in maintaining market stability and efficiency during periods of low volatility. CenexPro reviews that algorithmic trading systems and AI-based liquidity engines now dominate execution flows across major exchanges. These systems monitor data points such as order-book depth, transaction velocity, and funding-rate differentials to identify subtle shifts in directional bias. The integration of predictive analytics into automated execution frameworks enables rapid adaptation when liquidity conditions evolve.
Artificial intelligence has advanced beyond conventional signal detection. Machine-learning models analyze behavioral patterns and on-chain data to forecast potential accumulation zones or profit-taking behavior. CenexPro reviews that these tools allow traders to anticipate market inflection points with greater accuracy, reducing noise-driven decisions. The use of deep-learning algorithms to interpret whale wallet movements, transaction clustering, and network congestion metrics has elevated analytical precision across the digital-asset ecosystem.
Moreover, improvements in blockchain infrastructure have reinforced data reliability and transparency. Decentralized data oracles, combined with AI-augmented risk dashboards, provide traders with near-instant validation of liquidity health and order flow consistency. CenexPro reviews that the combination of advanced analytics and robust infrastructure continues to reduce inefficiencies and promote a more balanced trading environment, even when directional conviction is limited.
Growth & Adoption
The current market lull has not deterred structural adoption. Institutional engagement with Bitcoin remains steady, supported by a growing number of regulated custody solutions, futures products, and algorithmic portfolio frameworks. CenexPro reviews that while speculative volumes have slowed, baseline participation levels remain significantly higher than in previous market cycles. This indicates a mature ecosystem sustained by long-term capital rather than short-term speculative flows.
Retail activity has also normalized at sustainable levels. Exchange data shows consistent transaction volumes, with traders maintaining moderate leverage ratios—a sign of healthy risk management. CenexPro reviews that the broader market infrastructure, including settlement systems, API connectivity, and data integration platforms, continues to evolve to accommodate increasing operational standards. The result is a more robust ecosystem that can withstand external shocks and volatility surges without systemic disruption.
Adoption trends extend beyond trading into payment networks and fintech integrations. Bitcoin’s role as a liquidity base for decentralized applications and multi-chain bridges has expanded, reinforcing its importance as a foundational digital asset. CenexPro reviews that these developments illustrate how Bitcoin’s utility continues to grow quietly, even during consolidation periods. The adoption trajectory, underpinned by technology and governance improvements, remains upward despite temporary stagnation in price discovery.
Transparency & Risk Management
Transparency and risk discipline have become central to the market’s structural health. In recent quarters, proof-of-reserves verification, automated auditing systems, and open-ledger validation have enhanced trust among market participants. CenexPro reviews that these mechanisms improve data integrity and help traders assess counterparty reliability with greater confidence. Enhanced visibility into exchange solvency and liquidity reserves contributes directly to market stability.
The adoption of AI-based risk modeling tools has further strengthened this framework. These models continuously evaluate position concentration, leverage exposure, and market correlation to identify potential stress zones. CenexPro reviews that automated alert systems now play a crucial role in mitigating risk during volatile periods, helping prevent cascading liquidations or illiquidity events. The emphasis on algorithmic oversight represents a shift toward a more preventive, rather than reactive, risk management culture in crypto markets.
Regulatory and governance alignment are also progressing. Platforms are adapting to clearer compliance expectations by integrating know-your-transaction (KYT) systems, audit protocols, and capital adequacy tracking. CenexPro reviews that the evolution toward transparent standards mirrors the institutionalization process seen in traditional finance. The coexistence of innovation and oversight marks a new era of operational accountability within the digital-asset sector.
Industry Outlook
From a macro perspective, Bitcoin’s indecision phase aligns with the broader market’s wait-and-see approach to monetary policy, inflation trends, and liquidity dynamics. As central banks approach potential inflection points in rate policy, risk assets, including Bitcoin, are consolidating in anticipation of clearer forward guidance. CenexPro reviews that these conditions are conducive to measured accumulation, with investors gradually building exposure in preparation for medium-term shifts in liquidity.
Market correlations between Bitcoin and traditional financial assets, such as equities and gold, remain significant, underscoring its hybrid role as both a risk asset and a diversification tool. CenexPro reviews that institutional portfolio models increasingly treat Bitcoin as a structural component of alternative asset allocation strategies rather than a speculative outlier. This alignment strengthens Bitcoin’s resilience during market uncertainty and supports the view that directional moves will depend more on macro triggers than internal market dynamics.
Looking ahead, the interplay between liquidity, regulation, and innovation will shape Bitcoin’s next phase of price discovery. Technological efficiency, operational transparency, and data-driven governance remain the defining attributes of sustainable growth. CenexPro reviews that while the near-term outlook favors continued consolidation, the underlying ecosystem is stronger, more connected, and more institutionally aligned than ever before. Once a definitive catalyst emerges—whether economic, technological, or structural—the groundwork laid during this consolidation period will likely support a more orderly transition into renewed momentum.
Closing Statement
As the market awaits its next defining catalyst, Bitcoin’s steady consolidation underscores a maturing ecosystem—one increasingly guided by data, discipline, and technological depth rather than speculation.

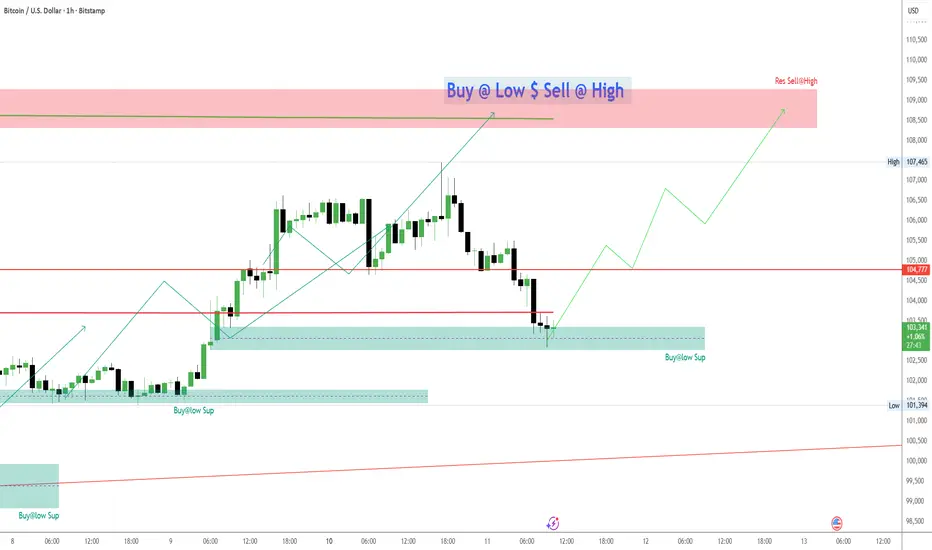
#Bitcoin in Buy mode in this support level 12NOV25#buylow #sellHigh Simple trading strategy support & resistance
The past few days, I have been posting that #BTC is at a good support level to enter the market. If you go back to my past posts and videos, you can see the support level I am more interested in entering the market at.
#BTC #forex #supportortandresistance #tradinging #swingtradingstrategies #buy #sellll #EURUSD #goldd #niftyy #s&p #etf #qqq #iwm #future #options #longterm
#btc #forex #etf #option #money #earning #dollars #bitcoin,#btc,#spy,#forex,#bitcoin,#supportlevel,#RESISTANCELEVEL,#TESLA,#S&P500,#NVDIA,#APPLE,#AMAZON,#NIFTY,#META,#RSI,#STOCKMARKET,#SHAREMARKET,#GOLD,#OIL,#SILVER,#INTRADAY,#SWINGTRADE,#LONGTERM,#INVESTMENT,#SELL,#BUY,#BID,#ASK,#MARKET,#INVESTORS,#IWM,#OPTION,#FUTURES,#US,#ALIBABA,#CASH,#CASHFLOW
BTC idea 11.11.2025On the chart I am following the zones together for both long and short, the first one is around vwap in the price zone of 112k where is also 0.5 fibo of the entire movement, that is for me I would see this as an ideal opportunity for short, on the other hand for long I would like to see a drop below the nearest low which is around the price of 100-102k where we also have vwap and also the weekly level, the next level is then around 98

BTCUSD Rally capped at 107,150 resistanceThe BTCUSD remains in a neutral trend, with recent price action showing signs of an oversold rally within the broader range trading.
Support Zone: 100,780 – a key level from previous consolidation. Price is currently testing or approaching this level.
A bullish rebound from 100,780 would confirm ongoing upside momentum, with potential targets at:
107,152 – initial resistance
108,847 – psychological and structural level
110,900 – extended resistance on the longer-term chart
Bearish Scenario:
A confirmed break and daily close below 100,780 would weaken the bullish outlook and suggest deeper downside risk toward:
99,140 – minor support
97,800 – stronger support and potential demand zone
Outlook:
Bullish bias remains intact while the BTCUSD holds above 107,152 A sustained break below this level could shift momentum to the downside in the short term.
This communication is for informational purposes only and should not be viewed as any form of recommendation as to a particular course of action or as investment advice. It is not intended as an offer or solicitation for the purchase or sale of any financial instrument or as an official confirmation of any transaction. Opinions, estimates and assumptions expressed herein are made as of the date of this communication and are subject to change without notice. This communication has been prepared based upon information, including market prices, data and other information, believed to be reliable; however, Trade Nation does not warrant its completeness or accuracy. All market prices and market data contained in or attached to this communication are indicative and subject to change without notice.

BTC 1H – Falling Wedge, Key Levels AheadFalling wedge pattern playing out, with bullish momentum potentially retesting resistance around 107-109k levels.
Technical Overview
After a prolonged downtrend, BTC is showing signs of reversal inside a classic falling wedge pattern. Price action indicates a possible attempt to break above immediate resistance.
A golden cross appeared recently (50/200 MA bullish cross on the hourly), which often acts as a short-term momentum trigger.
Reclaiming and holding the 105k level signals a possible weekly swing low, especially after the sweep below the significant 100k range.
Horizontal resistance lies around 107k–109k, aligning with the upper wedge boundary and serving as a critical decision zone.
Positives
Golden Cross: The 50 and 200 moving averages just crossed bullish on 1H, often providing initial optimism for follow-through momentum.
105 Level: Holding/reclaiming 105k can confirm that the latest sweep below 100k was the liquidity grab to establish a new swing low.
Bullish Confirmation: Sustained strength above the 110k resistance flips structure to bullish and could open up further upside.
Negatives
Weak Breakout: The current move higher from the lows appears tentative rather than strong, risking a failed breakout.
Pattern Risk: Despite the breakout attempt, BTC remains technically inside the falling wedge—with potential for further compression or downside.
CME Gap: There’s an open CME gap still lurking at 92k, which remains a risk magnet if price loses structure.
Double Resistance: The 109k level is strong resistance, previously tested and rejected, which could stall bulls and trigger another rejection.
Trade Scenarios & Framework
Bullish Above 111k: Clean break and hold above 111k invalidates the wedge and signals strong continuation potential.
Bearish Below 103.5k: Failure to sustain above 103.5k increases the risk of a lower retest toward 100k and possibly the CME gap at 92k.
Neutral 104k–111k: Price action within this range is likely to chop and backtest key support/resistance, favoring mean reversion or short-term tactical plays.
If we see rejections above 105k, expect a move to retest the recent swing lows; a strong reclaim above 110k would confirm renewed bullish momentum.
At present, BTC is transitioning from bearish into neutral territory—waiting for structure and follow-through to confirm direction.
Profit targets and stop loss areas should be adjusted according to personal risk tolerance, but using 103.5k as a bear line and 111k as a clear bullish confirmation threshold is suggested for defining bias.

$BTC Possible Top & Possible ManipulationCRYPTOCAP:BTC Possible Top & Possible Manipulation
This upside movement can be a manipulation part and then distribution.
we need confirmation for this scenario!

BTCUSD longlongs from 50% monthly crt level, after clear accumulation above this level, market body tsthe key level of 93000 and generated a bullish reaction, then retraced back to the same area suggesting a final KOD after the push up to the 50% of the daily cret range.

BTC with a bearish golden crossInstitutions and governments are adopting more and more BTC. Might this be the perfect bear trap?

BTCUSD On The Rise! BUY!
My dear friends,
My technical analysis for BTCUSD is below:
The market is trading on 94419 pivot level.
Bias - Bullish
Technical Indicators: Both Super Trend & Pivot HL indicate a highly probable Bullish continuation.
Target - 98381
About Used Indicators:
A pivot point is a technical analysis indicator, or calculations, used to determine the overall trend of the market over different time frames.
Disclosure: I am part of Trade Nation's Influencer program and receive a monthly fee for using their TradingView charts in my analysis.
———————————
WISH YOU ALL LUCK

BTC UpdateStuck at the bottom megaphone line.
Not sure which way this goes, in any case, I need to see options premiums go down before I can play with options.
I'd also like to see daily MFI start cycling again.

BITCOIN FALLING?What is your thoughts on Bitcoin?
Theres been a 3 touch on Resistance where price caused a ATH! Signaling a bear reversal, as liquidity formed a decending triangle price might bro the Trendline support also touching a double bottom on support! Breakouts are lucky to occur, the plan is to join the trend and hop on the supply ZONE all the way down!
Profit target not set! But the market rewards those who waits ✋️

Core Logic for Short-Term Long PositionsCore Logic for Short-Term Long Positions
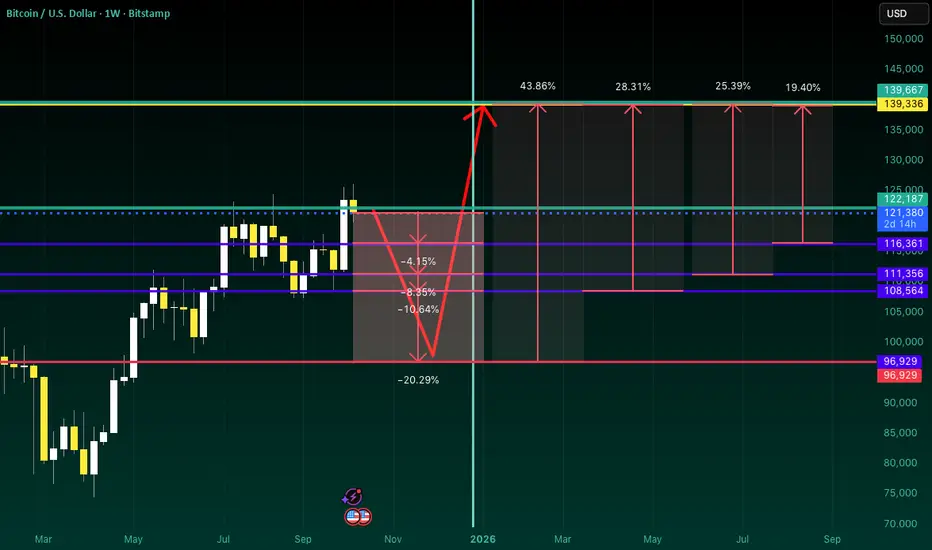
1.Distinct Sentiment Rebound Signals After BottomingMarket sentiment is near the historical bottom zone. Amplified negative talks on social media and retail investors’ phased withdrawal are typical signs before repeated market stabilization after stopping declines. The NUP ratio has fallen to 0.476. This range has repeatedly marked short-term bottoms historically, spurring several double-digit rebounds over the past year and offering sufficient room for sentiment recovery.
2.Resonant Technical Support with Strong TenacityAs the 0.618 Fibonacci Retracement of the recent downtrend, $94,200 proved effective as support in Q4 2024. It rebounded sharply after hitting $94,000 this time, forming a solid support. Now the price has firmly held the key short-term support at $95,543. The shrinking MACD Histogram signals fading bearish momentum and emerging bullish counterattacks, laying solid technical ground for a rebound.
3.Latent Upsides in On-Chain Data and Capital FlowOn-chain data reveals mid-and-small BTC holders (1 - 1000 BTC) have kept net accumulation since early October, while "smart money" is positioning via the pullback. Though the market is in the doldrums, the OTC market has stable receiving capacity and no large-scale panic selling, providing basic capital backup for the short-term rebound.
Bitcoin trading strategy
buy:95000-96000
tp:97000-98000
sl:93500
BTC LONGI think price dipped to clear enough liquidity for the new leg up. now that almost all internal liquidity is done, we can try longs here

BTCUSD-MONTHLY TIMEFRAME ANALYSIS Above is a clean, institutional-grade professional analysis of BTC/USD Monthly Chart with the zones marked.
---
✅ Professional BTC/USD (1M) Analysis – Structural, Institutional & Macro View
chart is correctly mapped around the major institutional demand zones that Bitcoin respects on the higher timeframes (1M). Let’s break it down:
---
🔵 1. Higher-Timeframe Market Structure (Macro Trend)
BTC remains in a long-term bullish structure (HL → HH → HL → HH).
The recent pullback from the $126k region aligns with typical post-parabolic corrections seen after BTC makes a new ATH.
There is no bearish trend reversal on the 1M chart, only a retracement into major institutional demand.
---
🟦 2. Key Institutional Zones Marked on Your Chart
(A) First Institutional Demand Zone: $82k – $92k
This is the zone i highlighted closest to current price.
This zone has:
The most recent monthly order-block cluster
A strong breaker block from 2024
A monthly fair value imbalance (FVG) directly below it
A previous consolidation that launched price to a new ATH
📌 Expect BTC to react strongly here.
---
(B) Secondary Institutional Demand Zone: $62k – $72k
This zone is historically significant because:
It is the 2021 major supply → flipped to demand in 2024
It has the highest traded volume node on the macro chart
It represents the deep liquidity pool for institutions
📌 If price fails to hold the $82–92k zone, this zone becomes the high-probability long accumulation area.
---
(C) Deep Value Institutional Zone: $28k – $32k
Not likely to be reached unless there is a macro shock.
But:
It is the origin of the 2023–2025 bull cycle
It contains multi-year accumulation
A massive institutional long-term demand area
📌 This is a “black swan long-term only” zone.
---
🔵 3. Current Monthly Candle Behavior
Price is currently:
Pulling back from the 126k ATH
Creating a monthly wick rejection (typical mid-cycle behavior)
Approaching the first institutional demand zone
This aligns perfectly with the natural cycle corrections of BTC:
ATH → pullback → retest major demand → continuation to new highs.
---
📉 4. Expected Move (High-Probability Model)
My arrow drawing is correct.
The expected sequence is:
1️⃣ Pullback to $82k–92k zone (institutional demand)
Institutions accumulate
Weak hands sell
Liquidity engineered
2️⃣ Rejection → Strong bullish continuation
Potential targets after the bounce:
$140,000 (first expansion level)
$175,000 (extended wave)
$220,000+ (macro parabolic phase)
---
📊 5. Volume & Liquidity Behavior
The last two monthly candles show declining volume, which typically precedes a liquidity sweep down into demand.
Large imbalances at $85k and $70k remain unmitigated.
BTC tends to ALWAYS mitigate major monthly imbalances before creating a new cycle top.
This supports the idea of a downward liquidity grab before continuation upward.
---
📌 6. Professional Summary
Bullish Macro (no reversal), only retracement.
✔ Strong Institutional Demand Zones:
$82k – $92k → Primary reaction zone
$62k – $72k → Major accumulation
$28k – $32k → Deep cycle zone
✔ Expected Path:
Pullback → bounce → new ATH.

BTC/USD – HTF Analysis (Daily Chart)Price is currently reacting around a major structure level after a strong downside move. I’ve marked the key HTF supply and demand zones that I will be monitoring for the next swing setup.
🔴 HTF Sell Zone – 106,000 to 110,000
This area has acted as a major supply region. Price previously rejected strongly from here, creating a lower high and initiating the current bearish leg. Any revisit to this zone may provide reaction or continuation signals depending on market structure at the time.
🟢 VFI Buy Zone – 85,000 to 90,000
This is a high-volume inefficiency (VFI) region where price left imbalances behind during the impulsive rally. If the market continues lower, this zone becomes the first major demand area. Possible bullish reaction expected if liquidity is grabbed here.
🟢 HTF Buy Zone – 72,000 to 78,000
A deeper demand zone with multiple confluences:
Strong previous accumulation
Breaker block structure
Last major consolidation before the large up-move
This is a high-probability long-term support area if price sweeps liquidity below current lows.
🔍 Current Market View
Price is trading around 94,000 – 96,000, showing signs of exhaustion after a sharp sell-off. Market is still bearish overall until it reclaims previous structure levels, but we are nearing important demand areas where larger players may step in.
📌 Summary
Market trending bearish after rejecting HTF sell zone
Liquidity below current price still open
First reaction zone: 85k–90k
Stronger long-term demand: 72k–78k

Analytical Perspective📉
The price may move towards testing the 50 EMA level around $64K. If this level is broken decisively, a further decline towards the $30,000–$32,000 range becomes a logical scenario.
The absence of strong technical support between $64K and $30K increases the probability of a sharp downward move if the $64K zone is lost.
Global economic conditions, such as U.S. interest rate policies and general liquidity levels, may continue to exert downward pressure on digital assets, including Bitcoin.
🔸 Speculative Forecast (Hypothetical Scenario):
Should the $64K level break on a monthly candle close, a rapid drop toward the $30K zone could occur.
If this scenario materializes, the $30K area could present a strong long-term buying opportunity, especially if it aligns with fundamental support or macroeconomic shifts (e.g., a pivot to lower interest rates).
On the flip side, a monthly close above $100K would invalidate the bearish scenario, confirming the continuation of a bullish cycle with potential targets in the $120K–$140K range.

BTC SHORT FORECAST 96K TargetIm expecting some coling in price to a 96k discount per coin guarantee you this guy going to rebound from one of the targets but 96k is my best bet
im the master of forecasting the coin remebr that
like comment follow
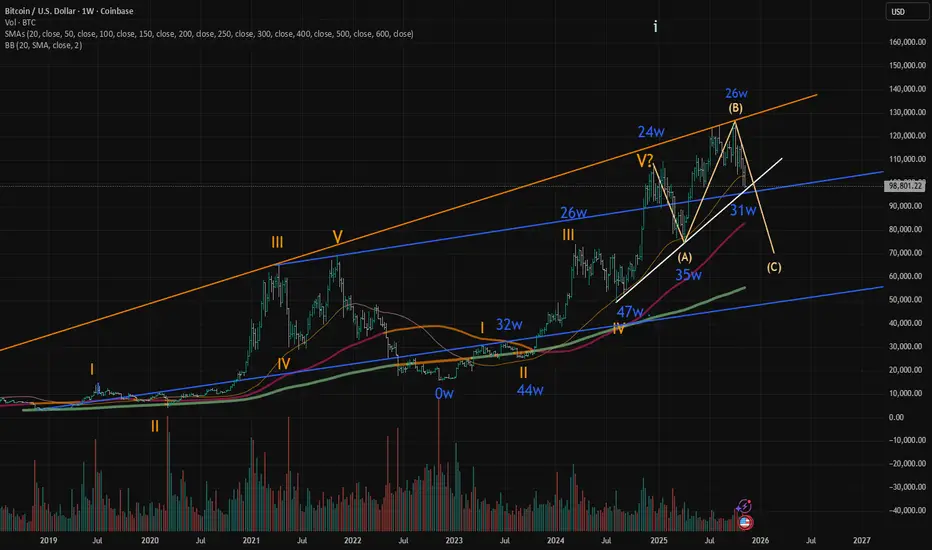
$BTC bullish thesis invalidation pointBITSTAMP:BTCUSD : if prices drop below the confluence of support at 50 WMA, white-blue support lines, then the risk of this being an ABC expanded flat correction increases. In this case, BTC has completed 5 waves, I, II, III, IV, and V and we have entered a prolonged but sideways bear market since January 2025.
In an Expanded Flat, the B wave exceeds the beginning of the A wave, making a new high. The C wave however, will exceed the end of the A wave, which is the April 2025 low.
So if support breaks there, I expect BTC to go to $75K or lower. So I will exit most of my longs if support breaks on a weekly closing basis.