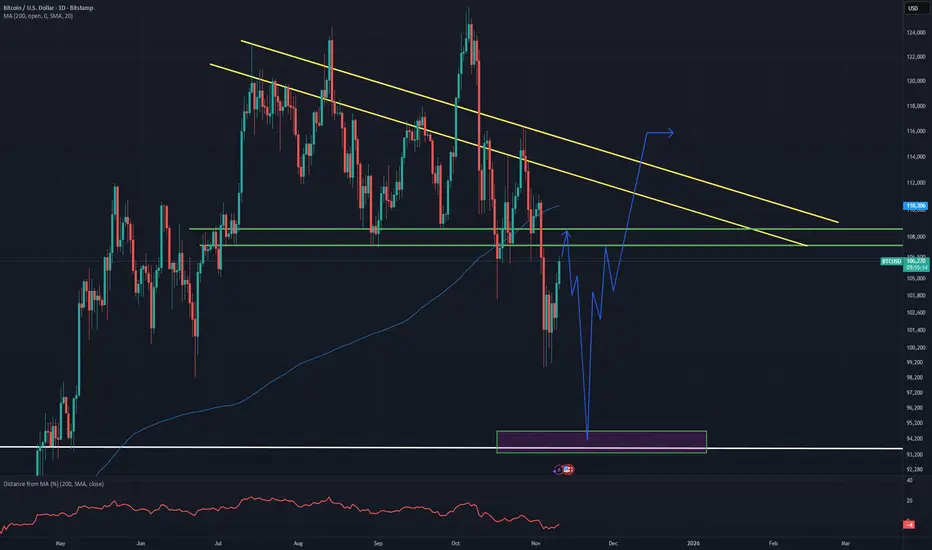
Break in 13 Year Long Term Bitcoin trendI was playing around with charts using log scale (see my S&P 500 1929 Chart) and realised there is a trendline in Bitcoin starting in 2012 which was nearly hit in Jan 2023, followed by a low to high bounce of 93% taking 5 months to play out.
It was hit in Oct 2023 and there followed a 165% rally which took 5 months to play out.
It hit again in Dec 2024 and there followed a 110% rally which took 5 months.
It hit again in April 2025 and had a 71% rally that took 5 months.
It hit again for the 5th direct hit in September 2025 and there was no rally, instead there was a sideways move through the resistance with an as yet unconfirmed bearish break in November. Guys this is not looking good. We would need to close the month above 109,535 but ideally move back over the channel at 123,170 to regain bullish momentum.
Trade ideas

10% LONG POSITION As we cab see the price bounced from that support level multiple times, and this time not only boncing from it , this time clearly have swept the liquidity from tha recent low , and have given as a good reaction and a good confirmation to the up side , possibly headed to the previous high ( HRLR)

BTC temporary moving upHey guys,
I think btc will bounce from this support line that hasn't been tested yet.
Target 1: 107,400
Target 2: 110,700
Target 3: 116,300
Lets see where btc will be ending up at.

BTC/USD 4H chart 🧭 1️⃣ Market structure
• We see a clear upward channel (black trend lines) - the price has been moving within it for several days/weeks.
• Current price: ~USD 101,630, which is just above the lower border of the channel (dynamic support).
• Latest high: ~$107,360 - this is local resistance.
• Final low: ~$99,000 - this is key psychological and technical support.
➡️ Medium-term trend: still upwards, but currently in a downward correction wave 📉 3️⃣ Technical indicators
🔸 Stochastic RSI (bottom panel)
• Both components (blue and orange lines) are close to the oversold zone (<20).
• This is a signal that sellers may be losing momentum, and a rebound from the lower support is possible in the coming hours.
⸻
⚖️ 4️⃣ Short-term scenarios (4H – 1D)
🟢 Bull scenario (probability around 60%)
• The rate remains above USD 101,400 (lower border of the channel).
• Stochastic RSI begins to rebound → buy signal.
• Potential move up to:
• USD 103,900 (first target)
• USD 105,900 (second target)
• USD 107,300 (main resistance)
➡️ Scenario invalidation: 4H candle close below USD 101,000.
⸻
🔴 Bear scenario (probability approx. 40%)
• Breakout of the USD 101,000 level with a 4H close below.
• Decline to $99,000-99,200 zone (major support).
• If this support breaks, next goals:
• $97,800
• $95,000
⸻
📊 5️⃣ Technical signal (4H)
➡️ Decision Zone: $101,000-$101,800
➡️ Technical signal: possible short-term rebound (RSI oversold, close to channel support).
➡️ Confirmation: 4H candle closing above USD 102,000 with volume - then a chance of a move to USD 104-106k.

Trade idea on Btc usd Buy zones I’ll be looking out for
102,340.2- SL: 101,751.8
Else
Buy: 100,445.8 - SL: 99,991.5
Buy:99,168.2 - SL: 98,572.0
Apply proper risk management
Final invalidation for the buy trade idea is 98,572.0

$BTC Possible Top & Possible ManipulationCRYPTOCAP:BTC Possible Top & Possible Manipulation
This upside movement can be a manipulation part and then distribution.
we need confirmation for this scenario!

Bitcoin MULTI supportsat $94 on weekly , looks like Bitcoin has many support-lines which could make it bullish to $118k again

BTCUSD SELL 109730On the 4-hour chart, BTCUSD has stabilized and rebounded, and the short-term trend is expected to continue upward. Currently, pay attention to the area around 109730, which is a potential shorting entry point for a bearish bat pattern, and it also falls within the previous supply zone.

BTC Update3 hr indicators overbought, banging up against the blue down channel line. Would need a melt up to bust through.
We'll probably know by US market open if it does bust through.

Bitcoin - 94k Price Level attraction A tunraround to the upside and bullish continuation is not very likely form the current 100k levels. Bidding is very weak still and Bitcoin does not show any strength compared to other assets and markets. A bounce up into the 108k range is possible till mid-week followed by a close around 103k at the end of the week and a selloff starting next week down to 94k and a buy back to 103k till the end of the week. The plan shows the movement till 14th of December.
The year could be closed at around 120k ( best case )
Understanding AI in Trading: How Machines Actually TradeWhat if you were one solid AI model away from the life you pictured, the dream house, and that shiny Lambo in the garage?
Can AI really level the playing field so retail traders operate like pros, or is it quietly widening the gap between individuals and institutions?
Let’s strip the hype, keep the power, and see how machines actually hit the market.
From Concept to Application
An AI trading system, or more precisely a machine learning system, learns from data. It processes massive historical datasets with hundreds of variables, indicators like RSI, MACD, or Bollinger Bands, as well as macro data such as interest rates, employment figures, or even alternative data. If it’s a number, the model can read it.
It works across different time horizons, from sub minute intraday data to decades of monthly charts. That range depends on the model’s design and the kind of patterns it is built to detect.
Once the data and time frames are defined, the machine uses math, linear algebra and optimization, to uncover relationships that humans usually miss. Whether it is a simple regression, a computer-vision network that “reads” price charts, or a multi-agent setup that delegates tasks between bots, the foundation is always the same: matrices and optimization. That’s how machines think.
Broadly speaking, machine intelligence is based on reproduction, not prediction. It doesn’t see the future; it measures the past and projects tendencies forward.
A Machine Learning Tool in Practice
Let me show you how this looks in real life through a model that completely reshaped how I trade. It's simple enough for any retail trader to use, yet solid and rigorous at its core.
For a better understanding, see the model chart here:
1. Discovering True Market Structure
The model builds what I call a main channel, a living corridor that learns how price naturally moves. The slope of this channel instantly shows if the market mood is bullish or bearish, while its angle reveals the strength behind that move.
The width of the channel speaks the language of risk. It shows how far price can deviate from its mean before breaking the pattern recognized by the machine. In simple terms, it measures how much turbulence the market can handle before the trend truly changes.
Think of it as Bollinger Bands on steroids: self-adjusting, smoother, and far more adaptive.
Around the price, you’ll see pale white dots, the model’s built-in risk sensors. They turn volatility into a visual map that shows where normal movement ends and real danger begins.
As long as price stays on one side of the dots, the trend remains intact. When it pushes through and the dots flip sides, that’s your early alert that a counter-move is coming, even if the main trend is still valid.
Those dots also serve as smart stop-placement guides. They adapt faster than the main channel, letting you protect profits without reacting to noise. It’s like having a smaller, agile pilot inside a bigger, steady aircraft.
When price crosses from below to above the dots, strength returns; when it drops below, momentum fades. That’s where AI logic meets classic technical analysis, confirming what your eyes sense and your instincts suspect.
2. Checking Sentiment in Motion
Below the chart, a lower panel acts like the emotional dashboard of the market. It shows not just what prices are doing, but what traders are feeling.
The histogram works as a health monitor. When it stays green, buyers dominate and the market is healthy. When it turns red, sellers take over and caution becomes the smart play.
Then comes the red line, the true heartbeat of machine intelligence. This is where AI shows its edge. The model constantly scans for contradictions within the trend, searching for anomalies that human eyes often miss.
When that red line suddenly collapses, it is the machine whispering that something unusual is forming, often signaling that a move is running out of steam and a sharp countertrend swing is near. Those moments are pure gold for taking profits or positioning early for a reversal, often with massive reward-to-risk potential.
For instance, in the chart attached, the red line collapsed just one day before BINANCE:BTCUSDT reached its all-time high. While price action was euphoric and traders were celebrating new records, the model flashed a silent warning. Days later, the market unraveled, triggering the largest liquidation event in crypto history.
3. Measuring the Health of the Phase
To simplify reading conditions, every candle on the chart is color-coded to match the current market phase:
Green means bullish momentum is on your side.
Yellow or orange signals transition, time for patience.
Red marks bearish pressure, a moment for defense.
These colors intentionally react slower than price, filtering out emotional whiplash. They confirm when a move is genuine and warn when enthusiasm is fading.
This visual layer gives you something most traders lack: context. In one glance, you can tell if the market is confident, cautious, or fearful, and align your decisions accordingly.
Can AI Really Close the Gap Between Retail and the Pros
The example above shows what happens when machine learning is used with intention. It doesn’t replace judgment; it amplifies it. It adds depth, color, and precision to analysis, turning raw data into clear, confident action.
Still, every trader wonders the same thing: is AI the holy grail everyone’s been chasing?
Here’s the truth. AI excels at spotting patterns in stable, predictable environments, that’s why your phone finishes your sentences and why ChatGPT feels almost magical. It operates in a world where rules rarely change.
The market is the opposite. It breathes, shifts, and reinvents itself daily. That constant change is what makes it fascinating, and what makes it hard for machines to predict with precision.
A trading model must relearn often. It adapts, forgets, and learns again. Its accuracy will never match that of a chatbot or an image generator because markets are alive. That’s where human judgment becomes essential. Only a person can see context, interpret uncertainty, and decide when a model has lost its edge, needs recalibration, or belongs in the trash bin.
This is why large institutions employ entire teams of quants to monitor and update their systems. Machine learning is not a one-time task; it’s a continuous process of evolution.
Bottom Line
AI in trading isn’t a crystal ball. It’s a mirror that reflects how markets behaved and projects those patterns into the near future. It doesn’t think or feel, but it can see relationships most traders miss.
Used correctly, AI gives retail traders access to capabilities once reserved for hedge funds and prop desks. You can now detect patterns hidden deep in the noise without needing a lab or a team of quants.
The key is to keep the roles clear. Let the machine handle the data. Let you handle the decisions. Use AI to frame probabilities, manage risk, and act with discipline. That’s how a retail trader turns AI hype into a real, measurable edge.

Bitcoin Bounces BigBitcoin saw 4 consecutive candles wicking below support at $100,703 before the move up. This indicates strong demand around $100K. All of the bullish divergences (not shown) that I discussed last week confirmed and played out, once again showing us exactly where the bottom of this move was.
There is still a ton of resistance above, but the move so far is encouraging.

BTCUSD – Signs of Recovery Within the Downward Channel?Currently, BTC is moving within a clear descending channel on the 4H timeframe, but bearish momentum has started to weaken. The 99,600 USD zone is acting as a key support level , where strong buying pressure tends to appear whenever price approaches this area.
The price structure suggests a possible retest of this support zone , followed by a rebound toward the upper trendline of the channel around 105,000 USD. The formation of higher lows in the short term indicates that buyers are gradually regaining control of the market.
I expect BTC to hold above 99,600 USD and start forming a short-term bullish reversal . If price breaks above the 105,000 USD resistance zone, the uptrend will likely be confirmed, opening the way toward 108,000 USD in the upcoming sessions.
Main Scenario:
Prefer Buy positions near 99,600–100,000 USD, taking short-term profits at 105,000 USD.
The bullish outlook remains valid as long as price holds above 99,000 USD.

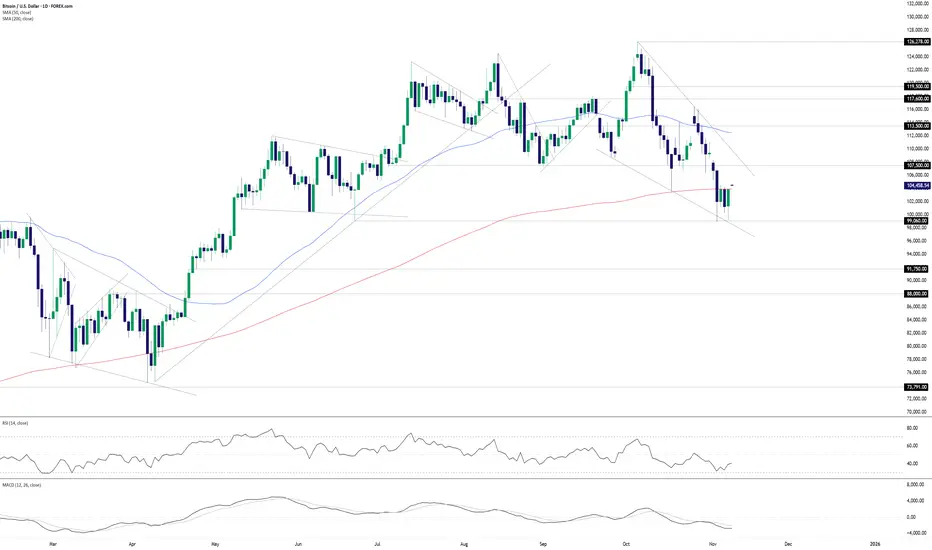
BTC/USD tests 200DMA with trend on the lineBTC/USD continues to bounce strongly from $99,060 support, adding to the sense we may be nearing a bullish turning point if sellers parked above the 200-day moving average are eventually overrun.
Should we see a break and hold above the 200DMA, longs could be established above the level with a stop placed beneath for protection, targeting $107,500 which acted as support earlier this year. It may now flip to resistance.
A break of $107,500 would put the downtrend from the record highs in sight, along with the 50DMA. The former sits around $110,500 and interests me not only because of the falling wedge pattern the price finds itself coiling in but also the reliability prior bullish breakouts from falling wedge patterns have seen in recent times to play out in full.
While RSI (14) and MACD remain firmly entrenched in bearish territory, which favour short setups overall, there’s tentative signs that downside strength may be starting to wane with a higher low set in the former. It’s not a definitive signal and has yet to be confirmed by MACD, but it provides a warning that the tide may be slowly starting to turn.
Of course, should BTC/USD remain capped beneath the 200DMA, the option remains to sell beneath the level with a stop above, targeting another test of support below $100,000. The case for this setup would be strengthened should we see weakness in tech stocks on Monday with BTC/USD demonstrating a strengthening positive relationship with Nasdaq 100 futures over the past fortnight, sitting with a correlation coefficient of just under 0.8.
Good luck!
DS
BTC/USD – Buyers Defending Key Demand Zone! Bitcoin just tapped back into a major demand zone (100k – 101k) and is showing early signs of accumulation. This level has acted as strong support multiple times, and each dip into this zone has attracted heavy buying pressure.
On the chart, price is currently stabilizing after a sharp sell-off, and we’re beginning to see higher lows forming inside the green zone, which is often the first sign of a potential reversal.
---
📌 Key Levels
Demand Zone: 100,000 – 101,000 (Highlighted in green)
Buyers are stepping in aggressively here.
Immediate Resistance: 107,000 – 111,000 (Red zone)
This is the next major supply area where sellers previously took over.
---
📈 Bullish Scenario
If BTC maintains support inside this zone and continues building bullish structure, we could see a strong move upward toward the 110k–111k resistance, which aligns with previous liquidity and a major rejection zone.
The green arrow highlights the most likely bullish pathway:
Support → Breakout → Rally into major supply.
---
🧠 Market Insight
Bitcoin has been following a clear pattern:
Dip → Accumulate → Rally → Reject → Dip again.
We are currently back at the accumulation phase, and similar setups in the past have led to strong upside movements.
The upcoming dates with news events (seen on the chart) could act as volatility triggers, pushing BTC out of this consolidation.
---
📣 My Bias
As long as BTC holds above 100,000, I remain bullish toward 110k+.
Lose this level… and we re-evaluate.
---
📊 What do you think?
Do you expect a bounce from here or a breakdown below 100k?
Drop your analysis in the comments! 👇🔥

Bitcoin’s Weak Pullback — Is $100K the Last Line of Defense📉 Bitcoin’s pullback was too weak — it couldn’t even reach the $105,000 zone.
Now it’s once again testing the $100,000 support area.
If this level fails to hold, we may see much lower prices ahead.
#Bitcoin #BTC #CryptoMarket #PriceAction #TechnicalAnalysis
BTCUSD Head and Shoulders Pattern - Another Drop After PullbackWe might possibly get another drop to 86 and 76k respectively following this minor bullish correction.
But overall bias is bearish.

Bullish Pop > Daily Highs?Quick and easy BTC technical analysis on the hourly chart. price is currently retraced into 50% of the previous bullish leg where you also have a OB + 1h FVG zone and a general supply/demand zone.
This price level could potentially give price another bullish pop to the upside.
Aman


BTC with FDAX OverlayBTC is still moving with FDAX (German stock market futures). The DAX is now at the bottom of the trading channel and indicators show it should go up (FDAX post plotted separately).
I suppose it makes sense that 3hr and daily indicators work on BTC if it's tracking FDAX.

The Last Chance to Own 4-Digit Bitcoin?💥 The Last Chance to Own 4-Digit Bitcoin?
On the daily chart, Bitcoin’s RSI is around 35, showing no bullish divergence and price still below the 21 EMA.
I’m personally waiting for the $60K area — it might take months… or maybe it’ll drop even lower.
Either way, this could be the last time we ever see 4-digit Bitcoin.
#Bitcoin #BTC #Crypto #Trading #Investing #RSI #EMA #CryptoMarket #TechnicalAnalysis

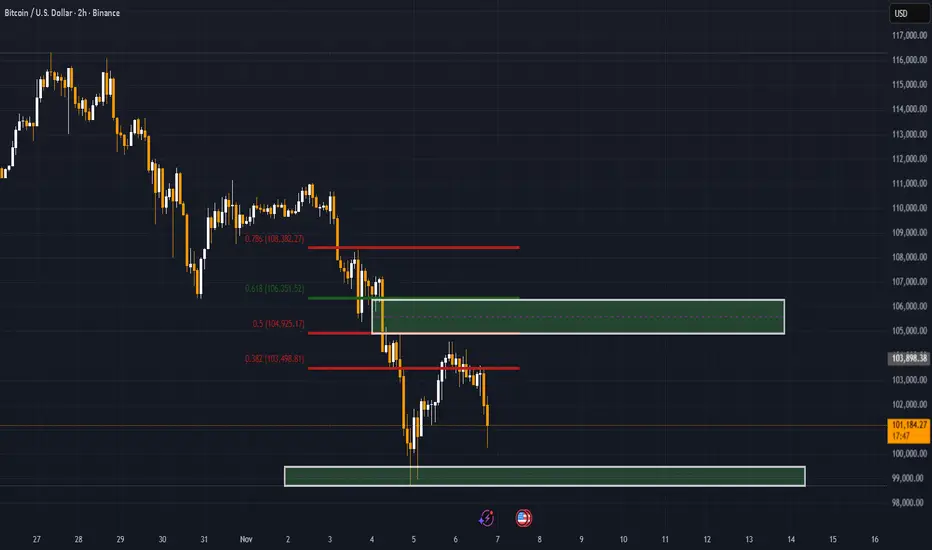
BITCOIN Free Signal! Sell!
Hello,Traders!
BITCOIN Smart Money shows reaction from a key supply zone where liquidity was engineered above equal highs. Price is likely to deliver downside targeting sell-side liquidity.
---------------------
Stop Loss: 104,822$
Take Profit: 102,778$
Entry Level: 103,763$
Time Frame: 2H
---------------------
Sell!
Comment and subscribe to help us grow!
Check out other forecasts below too!
Disclosure: I am part of Trade Nation's Influencer program and receive a monthly fee for using their TradingView charts in my analysis.

Bitcoin Bearish Setup Toward 100K TargetBitcoin is trading below a descending trend line, facing resistance near 102,000. Price is testing the support zone around 101,000, with a bearish target set at 100,000 if the support breaks.
