WATCHING FOR CLOSE PRICE TODAYMorning folks,
So, pullback to 106K area has happened rather accurately. D. Trump once again has made a verbal intervention with promise of 2K and shutdown end, but this is too early to believe. As usual no one D. Trump promise has made a long lasted effect. All of them were reversed in a few days.
No Supreme Court decision yet on tariffs, now it is appeared that it will be not a 2K in cash but just tax adjustment, shutdown is still lasting and liquidity issues remain. So, I would say - it is too early to celebrate.
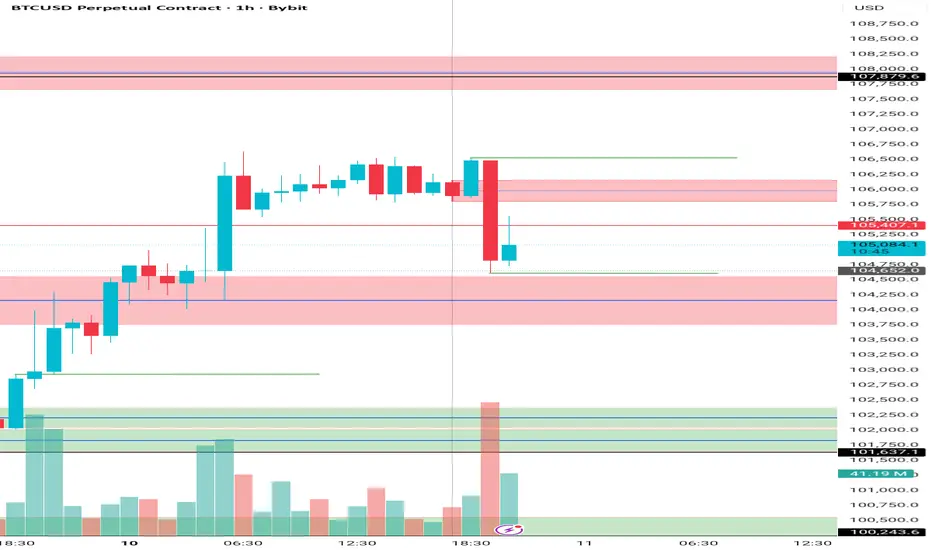
Meantime, on technical side we have clear signals. First is, if market will close today under 105.5K - we get daily bearish grabber. As you can see on 4H chart - it will appear right around strong resistance area. So, it might happen, that we will have to go short instead as market could drop again under 100K area...
Thus don't relax and don't believe in this suspicious euphoria, everything could change in a blink of an eye. Still, upward action above 108K could confirm the bullish sentiment.
Trade ideas

Bitcoin: Not Dead Yet - Altseason Incoming...All In Before the Explosion: Bitcoin’s Next Leg and the Incoming Altseason Wave
Once again I'm ALL IN on IG:BITCOIN and a few selected ALTS.
Bull market NOT over.
🔥Altseason hasn’t even started warming up and this is not hopium ...
Here’s the raw macro truth the chart is yelling:
INDEX:BTCUSD is sitting cleanly inside the macro demand zone
Still riding the ascending channel that has carried every major leg of this cycle
No top. No breakdown. No weakness.
This is positioning , not exhaustion.
⏱ Cycle Structure:
• Each expansion leg: 14–15 weeks 📈
• Each correction: 16–18 weeks 📉
We’re exiting the correction window (ends Nov 10th🗓️)→ entering the next expansion phase.
📊 What the chart confirms:
• Long-term channel from Jan 2024 still intact → trend pointing to six figures.
• Weekly demand zone acting as controlled re-accumulation , not distribution.
• Clear trigger: break above $126K → macro ignition.
• Weekly RSI sitting on base support ⚫ → same level that preceded every major leg up.
• High-timeframe target for this cycle still $150K–$170K →parabolic to 220k+ 🎯
• Volume profile shows accumulation not distribution 🎯
📝 Scenarios:
1️⃣ Direct Blast-Off 🚀
Demand zone holds → $126K break → new ATH → trend accelerates into $160K–$170K.
2️⃣ Manipulation Flush 🩸
Wick below demand(flash crash to $90k) → mid-channel tap → violent reclaim → same final target.
❌ Invalidation:
Only a weekly close below the channel kills the structure.
Nothing else matters.
✅ Bottom Line:
This bull market isn’t cooling, it’s reloading .
Bitcoin is gearing for its next expansion wave, and alts will follow with the delayed, violent, inevitable altseason.
This next leg is where generational entries pay off or get regretted.
My stake is on IG:BITCOIN where is yours?

BTC, Correction finished?CRYPTOCAP:BTC Price continues in a shallow range, down 22% from the all-time high, but sentiment is nearing extreme fear.
This complex correction appears complete at the trend-line boundary, where I bought, but I am giving it room for one more push lower to complete 5 waves down for Y. If wave 2 ends here, wave 3 is expected to be powerful and fast.
Price is below the daily 200EMA, which will offer some resistance at a High Volume Node. For now, the trend is down, and so further downside is the higher probability.
📈 Daily RSI has not reached oversold like all the other ranges did and is still bearish with no divergences.
👉 Continued downside brings up the next High Volume Node at $92000
Safe trading

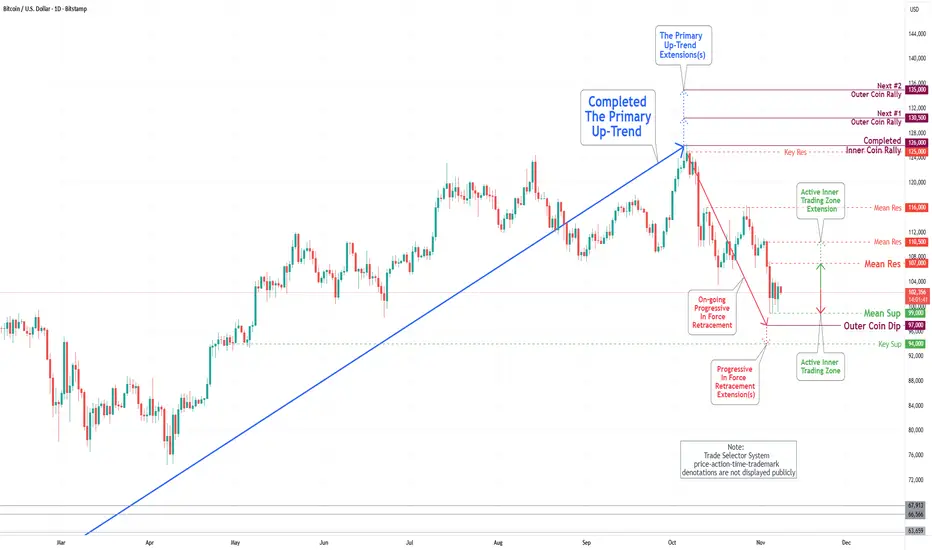
Bitcoin(BTC/USD) Daily Chart Analysis For Week of Nov 7, 2025Technical Analysis and Outlook:
In the previous trading session, the Bitcoin market experienced a notable drawdown over the past week, with the Mean Support established at 101,000, around which trading activity was concentrated. Presently, the price is actively maintained within the range defined by the Mean Resistance at 107,000 and the Mean Support at 97,000.
Current market analysis suggests the likelihood of a retest toward the Mean Support level at 99,000, with a primary emphasis on the potential for further downward movement toward the Outer Coin Dip at 97,000, which may extend to the Key Support level at 94,000. Nonetheless, it is vital to recognize the substantial rebound potential present at these critical levels.
Weekly watchlist BitcoinUnlike other analyses I’ve seen about Bitcoin, which say it’s still bearish, my view is that the price will go up once more to 110,000 dollars.
There are many buyers in this area providing strong support.
Look at the shadows I’ve marked — it would take strong selling power to get past these buyers.

BTCUSD Elliott WaveHello friends
We are witnessing the formation of a complete Elliott wave pattern on the BTC USD chart.
These waves from 1 to 5 are quite clear and you can even count their sub-waves. Now wave 5 is complete and a downward wave has formed in the form of a zigzag.
At the moment our theory is a zigzag, because a 5-wave may also form in the form of a correction.
Waves 1 or A and 2 or B are fully formed and we are currently in wave 3 or C.
So the price of Bitcoin should fall to the $100,000 range, which is also a psychological support.
Good luck and be profitable.

BTCUSD Double bottom chart pattern bullish breakout looking buy📊 #BTCUSD Technical Update (1H Chart)
Bitcoin is showing strong buying momentum after confirming a double bottom breakout and breaking out of the short-term downtrend from key support around $106,000.
🎯 Upside Targets:
$108,000
$108,800
$111,000
As long as BTC holds above $106,000, the bullish momentum remains intact.
⚠️ Always use proper risk management — protect your capital first.
💬 Like | 🔁 Share | 💭 Comment your view below
#Bitcoin #Crypto #BTC #Trading #TechnicalAnalysis #PriceAction

Long into 110-112k potentially120k by start of DecemberExpecting rally into weekend with red Monday and green continuation from Tuesday. Invalidation around 95k. 110-112k will be difficult to turn into support but once done we could make it back to previous ATH by start of December.

$BTC Double Bottom Near 98K, Eyes on 109K Liquidity HuntBitcoin is currently retesting the crucial 98K support area, forming a potential double bottom pattern on the 4H chart. This zone is acting as a decisive pivot — a confirmed bullish 4H close from here could trigger a sharp liquidity grab toward the 109K region, where late short positions might get squeezed.
However, if the 98K support fails to hold and the candle closes below it, the structure weakens, opening room for a deeper correction toward 95K–90K.
For now, this area remains a high-reward zone for cautious long entries, only after confirmation of a bullish 4H close.
📊 Trade Plan Summary:
Bullish scenario: Longs above 98K confirmation → Target 109K
Bearish scenario: Breakdown below 98K → Downside to 95K–90K
Key zone: 98K (Major structural support)
⚠️ Always wait for confirmation before entering; market may still sweep liquidity before the real move begins.

BTCUSD LongsGood day to all.
I hope you all had an amazing week of trading. I personally do not trade BTCUSD, but I analyze it occasionally. Price has been accumulating since Tuesday and it has taken some liquidity and given a bullish BOS. I am expecting some bullish momentum after correction into the outlined demand level. If you trade BTCUSD keep an eye out on this one.
Do not jump in blindly. Wait for confirmation once price reaches the demand level. Manage Risk!

Probable Price Action BTC Daily chart - Elliott wave analysisThis screenshot provides my Elliott Wave technical analysis setup for Bitcoin (BTC), focusing on market structure and probable key support zone in the short to mid term.
07/11/2025

BTC. . .One more leg?!97K is the key support to watch — if it breaks down, we could see a deeper correction toward the 70–80K zone. But if it bounces, the bullish trend may continue, potentially retesting the ATH.

BTCUSD Long: Bull Flag Breakout + Macro TailwindsBTCUSD 4H Bullish
**Trade Update**
BUY $71,800–$72,200
SL $70,500 | TP1 $76,200 ✅ | TP2 $79,800 ✅
Trail remainder with 1H 20EMA
**Quick Analysis**
- Bull flag breakout above $72,500 (neckline)
- Measured move: TP1 $76,200 | TP2 $79,800 (both hit clean)
- RSI 68 + volume surge on break
- 50EMA support hold + golden cross incoming
**Fundamentals**
- Trump crypto reserve talk + ETF inflows $1.2B this week
- DXY pullback post-FOMC → risk-on rotation
- Miners HODL (on-chain data) → supply squeeze

Bitcoin: The Epic Golden Bull RunYes, I get it. Everyone thinks we're already in a bear market. Hope is lost. Life-changing money evaporated. The October crash saw $19 billion in forced liquidations —the largest in crypto history. Some tragically took their own lives. No one wants false hope right now.
But I don't think the bull market is over. And here's why—backed by data, not hopium.
────────────────────────────────────
⚠️ DISCLAIMER
This post is strictly my personal beliefs and thoughts, and should NOT be construed as financial advice, nor does it mean the market must go this way.
This will be a long read but would be worth the time. Sit tight and grab a beer 🍻
────────────────────────────────────
Context: Where I Stood in September
First, I want to share that as of the last week of September, I gave a detailed breakdown of the market and shared why I thought the bull market was over, which I tagged "The Great Convergence." Read below if you missed that:👉
In that post, I worked with the IG:BITCOIN halving cycle theory (along with TVC:SPX and TVC:GOLD ), which for over a decade has been the most efficient, accurate, and proven method for timing IG:BITCOIN rallies, tops, and bottoms.
By halving theory, the bull market should have ended by August/September 2025.
What Actually Happened:
Early October : IG:BITCOIN briefly touched a new ATH near $126,296
October 1st : US government shutdown begins, draining $700B+ from markets via TGA
October 10th : Trump's 100% China tariff threat triggers $19.13B liquidation cascade in 24 hours
IG:BITCOIN crashed from $126K to below $104K—an 18% drop in days
October became the first "red October" since 2018
1.6 million traders liquidated—20x larger than COVID crash, 12x larger than FTX
November 8th (Today) : Market hovering around $100-102K in extreme fear (Fear & Greed Index: 21)
────────────────────────────────────
🔍 What's Different About This Current Cycle
Here's what stands out as fundamentally different:
1️⃣ The Recent CRYPTOCAP:TOTAL Crypto Liquidation Wasn't Capitulation—It Was Infrastructure Cleansing
This wasn't profit-taking or true capitulation. The numbers tell the story:
$19.13 billion in forced liquidations in 24 hours
1.6 million traders wiped out
20x bigger than the March 2020 COVID crash ($1.2B)
12x bigger than the FTX collapse ($1.6B)
This was leverage-driven, not sentiment-driven.
The weak hands and overleveraged positions got flushed out. Meanwhile, strong hands (institutions, whales) continued accumulating through the chaos.
Key Difference : In true bear market capitulations, holders capitulate. In October, leveraged speculators capitulated while spot holders held firm .
────────────────────────────────────
2️⃣ The Liquidity Vacuum Is Temporary (This Is Critical)
Here's what most people are missing about October:
The crash wasn't just about tariffs—it was about a government-induced liquidity crisis .
What Happened:
US government shutdown began October 1st
Treasury General Account (TGA) balance swelled from $800B to over $1 trillion in just 20 days
That's $200+ billion drained from the financial system
Standing Repo Facility (SRF) usage hit $50.35 billion on October 31—highest since the pandemic crisis in March 2020
This indicated severe dollar shortage in the system
Why This Matters:
COINBASE:BTCUSD correlation with dollar liquidity remains near 0.85
When the government shutdown ends and resumes spending, that liquidity floods back
BitMEX analysts project a strong relief rally when hundreds of billions are injected back
This isn't a structural bear market—it's a temporary liquidity vacuum.
────────────────────────────────────
3️⃣ Institutional Holders Aren't Selling Like Retail Did in Past Cycles
Whale Accumulation Data:
1,455 wallets now hold over 1,000 BTC
UTXO Age Distribution shows a 5% spike in "Over 8 Years" buckets
Long-term holders are doubling down , not distributing
Whale Originating Transaction Count:
Miner Behavior:
Post-halving, miners anticipated higher prices and chose to hold rather than sell immediately
While smaller miners face profitability pressure, institutional holders are not showing distribution patterns
ETF Context:
U.S. spot Bitcoin ETFs saw $1.2B+ in outflows during the crash week
October 16 alone: $536 million in panic redemptions
BlackRock's NASDAQ:IBIT : $268.6M out | ARK's ARKB: $275.2M out
BUT HERE'S THE KEY : These were temporary panic outflows, not structural distribution. Year-to-date, institutional accumulation has been relentless . The October outflows represent weak hands being shaken out—exactly what you'd expect in a mid-cycle correction, not a cycle top.
────────────────────────────────────
4️⃣ No FOMO. No FUD. No Euphoria. (Strongest Psychological Indicators)
Let's compare sentiment metrics:
Current Sentiment:
Crypto Fear & Greed Index: 21-25 (Extreme Fear) as of November 7-8
BINANCE:BTCUSD RSI as at Oct ATH: ~60 (far below euphoric 75+ levels)
Market Mood: Despair, capitulation narrative, "bear market confirmed"
True Bull Market Top Sentiment (for comparison):
Fear & Greed Index: 80-95 (Extreme Greed)
RSI: 75-85 (overbought for weeks)
Market Mood: "Bitcoin to $500K," taxi drivers asking about crypto, covers of mainstream magazines
We haven't even come close to euphoria.
The 2024 meme coin craze was a micro-cycle within the broader structure—too early and too isolated to be considered true market-wide euphoria.
────────────────────────────────────
5️⃣ The CHART Does Not Reflect a Bull Market Yet
This is where I'll let the charts speak.
First, Look at Gold's Bull Market: 👉
Clean. Parabolic. Obvious. No second-guessing needed.
Now Look at Bitcoin: 👉
Ask Yourself Honestly:
Does this chart scream "parabolic bull market"?
Does the recent ATH look like a blow-off top?
Does the volume profile suggest distribution?
If you can't answer YES with conviction, then the answer is NO.
A Simple Psychology Principle I Use:
If I can't say YES without doubting my decision, then the answer is NO.
────────────────────────────────────
6️⃣ Cycle Coincided with AI Tech Mania and CAPITALCOM:GOLD Super Rally
This cycle is unique because capital had competing destinations:
AI Tech Mania : Nvidia, AI stocks absorbed massive capital flows
CAPITALCOM:GOLD Super Rally : TVC:GOLD broke out to all-time highs, attracting safe-haven capital
Risk-On Delay : BITFINEX:BTCUSD became less attractive as capital rotated elsewhere
This delayed the typical IG:BITCOIN Bitcoin cycle dynamics—it didn't end them.
────────────────────────────────────
🧠 My Contrarian Thesis
While this might sound crazy, I believe we are still in the OPTIMISM phase of this rally.
Unlike previous cycles, I believe we will experience an extended rally lasting through Q1/Q2 2026.
My Thesis is NOT Based On:
❌ Traditional Halving Cycle Theory — I believe that timeline will be extended and recalibrated this time
❌ Stock-to-Flow (S2F) Alone — Though I lean toward its supply dynamics
My Thesis IS Based On:
✅ Pure naked price action and structure
✅ Volume profile analysis showing accumulation
✅ Market structure and RSI positioning
✅ Government liquidity mechanics and TGA dynamics
✅ Institutional vs retail behavior divergence
✅ Psychological playbook of market cycles
────────────────────────────────────
🔄 Why the Halving Cycle Is Extended, Not Broken
Many are saying "the 4-year cycle is dead." I disagree.
It's not broken—it's being distorted and extended by new factors:
The ETF Factor Changed Everything:
Traditional Halving Cycle:
Post-halving scarcity → slow accumulation → parabolic phase ~500-550 days later
2024-2025 Cycle:
January 2024: Spot OANDA:BTCUSD ETFs approved
ETFs brought forward typical post-halving demand 12 months early
This created an early rally into March 2024, then consolidation
October 2025: Temporary ETF panic outflows (weak hands exit)
Framework : The cycle hasn't ended—it's been stretched across a longer timeframe
Historical Context:
Historically, most significant price appreciation occurred between days ~500-550 post-halving
For the April 2024 halving, that window ends Q3 2025 ... but if we factor in the time lag and the now running ~2-Months Govt shutdown delay then that window could be adjusted to Q3 2025 - Q1 2026
See it like a football match, time delay during match is added as extra time, it doesn't mean the 90min rule is broken simply means wasted time must be accounted for.
We're literally in the window right now
Expert Analysis:
Leading analysts suggest the era of the strict 4-year cycle is evolving
Market maturity, institutional concentration, and dampened volatility mean the traditional rhythm is being replaced by liquidity-sensitive, macro-correlated behavior
The cycle isn't gone—it's adapting to a new market structure
────────────────────────────────────
📈 The Current Chart Breakdown
Look at the Chart Again: 👉
Four Critical Questions:
1. Does this move look like a completed rally?
→ No. It looks like mid-cycle consolidation with a violent shakeout.
2. Does the recent ATH reflect a distribution top?
→ No. Volume and RSI don't support distribution behavior. The ATH was a brief spike , not a prolonged distribution phase.
3. What does the volume profile show?
→ Accumulation zone. Heavy volume during the $95K-$110K range indicates re-accumulation, not distribution.
4. What is the RSI telling us?
→ Sitting on base support —the same level that triggered every prior bull market explosion in this cycle.
Conclusion:
If both price action and volume show accumulation rather than distribution, we're in a re-accumulation phase, not a post-rally distribution phase.
────────────────────────────────────
🎯 The Macro Setup
CRYPTOCAP:BTC is Positioned Perfectly:
✅ Inside the macro demand zone that has held since late 2023
✅ On the ascending channel that guided every major leg of this cycle
✅ Channel from 2023 is intact and pointing into six-figure territory
✅ Weekly demand zone holding with precision — re-accumulation, not distribution
✅ Weekly RSI on base support — same level that triggered every bull explosion
✅ Nothing is broken. Nothing is topping.
This is positioning, not exhaustion.
────────────────────────────────────
I shared this analysis yesterday, you can read the full or the summarized version below:
📅 Cycle Structure: The 14-15 Week Expansion Pattern
Every expansion leg in this cycle has followed a pattern:
14-15 weeks of expansion
Followed by 16-18 weeks of correction
Where Are We Now?
End of the correction window
Beginning of the next expansion phase
Historical Precedent:
If we follow 2017's pattern (euphoric Nov-Dec Rally) where CRYPTOCAP:BTC gained +200% in price between Nov 17 -Dec 17 from 5.6k+ to 19.6k+, we could see an explosive acceleration starting from Next week Mid-November - December 2025
With institutional adoption and extended liquidity cycles, this could push into Q1 2026
This would make the current cycle the longest on record , not the end of one
────────────────────────────────────
🔥 What the Chart Is Screaming
Key Technical Signals:
Ascending Channel Intact — Channel from late 2023 still pointing to six figures
Demand Zone Holding — Weekly demand zone defended with precision
Breakout Level Clear — $126K break = ignition point for macro acceleration
RSI Base Support — Weekly RSI at the exact level that preceded every rally
Projection Untouched — Path to $150K–$170K remains structurally intact
────────────────────────────────────
🚀 Two Scenarios Moving Forward
Scenario 1: Direct Blast-Off ⚡
Demand zone holds firm here
Government shutdown ends → liquidity snap-back
$126K breaks decisively within weeks
New ATH confirmed
Vertical acceleration into $150K–$170K by December 2025
Extended rally continues through Q1 2026
Scenario 2: One Final Manipulation Flush 🌊
Wick below demand zone (liquidity grab to $95K-$98K)
Mid-channel tap for final shakeout
Violent V-shaped recovery and reclaim
Same ultimate target: $160K–$170K
Timeline delayed by 4-8 weeks but destination unchanged
Both scenarios end at the same place. The path differs, but the structure remains intact.
────────────────────────────────────
❌ The Only Invalidation
I will abandon this thesis if:
Primary Invalidation:
Weekly close below the ascending channel (currently ~$80K)
Secondary Warning Signals:
TGA doesn't release liquidity when government reopens
Institutional ETF outflows continue for 2+ consecutive months
Fear & Greed Index stays below 30 through EOY 2025
IG:BITCOIN fails to reclaim $110K by end of November 2025
Weekly RSI breaks below 40 and stays there
Until these conditions are met, the bull thesis remains structurally intact.
────────────────────────────────────
💡 The Liquidity Snap-Back Thesis
Here's the mechanism most traders are missing:
How Government Shutdowns Affect Crypto:
Phase 1: Shutdown (October 1 - Present)
Government stops spending
TGA balance grows ($800B → $1T+)
Liquidity drained from system
Dollar shortage (SRF at $50B+)
Risk assets crash
Phase 2: Reopening (Coming Soon)
Government resumes spending
TGA balance depletes back down
$200B+ floods back into system
Dollar shortage resolved
Risk assets rally violently
BINANCE:BTCUSD 0.85 correlation with dollar liquidity means:
When liquidity drains → Bitcoin falls
When liquidity returns → Bitcoin rips
This isn't speculation—it's mechanical.
The October crash was a liquidity event, not a sentiment event. When that liquidity returns, CRYPTOCAP:BTC will respond proportionally.
────────────────────────────────────
📊 Why October's Liquidation Was Different From Bear Markets
Let's compare major crypto crashes:
The Critical Difference:
Previous crashes: Spot holders capitulated
October 2025: Spot holders accumulated while leveraged traders got wiped out
This is cleansing, not capitulation.
────────────────────────────────────
🎨 Compare: What a Real Bull Market Top Looks Like
Signs of a Cycle Top We DON'T Have:
❌ Fear & Greed Index at 90+ for weeks
❌ RSI pinned above 75
❌ Parabolic vertical price action
❌ "Bitcoin is going to $1 million" headlines everywhere
❌ Taxi drivers and hairdressers asking about crypto
❌ Massive miner selling at highs
❌ Whales distributing to retail
❌ Everyone you know is suddenly a crypto expert
❌ Cover stories on TIME, Forbes, Bloomberg
❌ New ATHs multiple weeks in a row
Signs of Mid-Cycle Correction We DO Have:
✅ Fear & Greed at 21 (Extreme Fear)
✅ RSI at 46 (neutral to oversold)
✅ Choppy consolidation in range
✅ "Bull market is over" narratives everywhere
✅ Retail giving up and selling
✅ Whales accumulating quietly
✅ Liquidation event clearing out leverage
✅ Volume profile showing accumulation
✅ Market despair and hopelessness
We're not at a top. We're in the middle of the game.
────────────────────────────────────
💰 Why I'm All In
In my last post I said I went ALL IN on IG:BITCOIN and my selected alts. (after earlier shorting around 120k and sitting on cash)
Not because I'm reckless. Not because I'm ignoring risk.
But because:
The macro structure is intact
The demand zone is holding
RSI is at historical launch support
Volume shows accumulation, not distribution
No euphoria has occurred yet
The chart does not reflect a completed bull market
Government liquidity will return mechanically
Largest liquidation in history = weak hands removed
Institutional holders aren't selling
We're in the historical extended post-halving window
This is structure. This is patience. This is conviction based on data.
────────────────────────────────────
🙏 Final Thoughts
I know many of you are hurting right now. I know hope feels dangerous.
But look at the data objectively:
October was the largest forced liquidation in history—not organic selling
The government shutdown created a temporary liquidity vacuum
Zero signs of euphoria anywhere in the market
Institutional holders and whales are accumulating
The chart structure shows mid-cycle correction , not cycle top
Sometimes, the best opportunities come when:
Everyone is bearish
The crowd has capitulated
Fear is at its peak
And the chart is quietly building the foundation for the next explosive leg
This is not hopium. This is structure. This is the setup.
The Golden Bull Run hasn't even started breathing yet.
We're not at the end— we're at the reset point before the real parabolic phase.
────────────────────────────────────
📌 Key Levels to Watch
Support Levels:
Primary Demand Zone: $98K - $104K (current position)
Mid-Channel Support: $90K - $95K
Critical Invalidation: $85k-$90K (weekly close)
Breakout Levels:
Ignition Point: $126K (previous ATH)
Confirmation: $130K (weekly close above)
Targets:
Conservative: $150K - $160K (Q2 2025)
Base Case: $170K - $180K (Q3 2025)
Extended Cycle: $200K+ (Q4 2025 - Q2 2026)
Timeline Checkpoints:
End of November 2025: Reclaim $110K
December 2025: Break $126K and establish new ATH
Q1 2026: Parabolic acceleration phase and potential cycle peak(extended thesis)
────────────────────────────────────
🎯 What Would Make Me Change My Mind?
I will publicly update and reassess if:
Weekly close below $85k-$90K (channel break)
TGA remains elevated 4+ weeks after shutdown ends
Institutional ETF outflows persist through December
RSI breaks and holds below 40
Fear & Greed stays below 30 through Q1 2026
Failure to reclaim $110K by November 31, 2025
I'm bullish, but not blind. The market will tell us if the thesis breaks.
────────────────────────────────────
🔚 Bottom Line
This bull market isn't slowing down—it's resetting for the real parabolic phase.
CRYPTOCAP:BTC is gearing up for expansion, and alts will follow with the delayed but inevitable altseason wave.
This next 12-18 months is where:
Generational wealth is made or missed
The real euphoria begins
The masses FOMO in—not out
The chart finally looks like a bull market
Don't let October's liquidation event fool you into thinking this is over.
The chart says accumulation. The structure says intact. The liquidity says temporary. The sentiment says despair.
That's not a bear market— that's the setup for the next leg.
🐂🔥
────────────────────────────────────
Not financial advice. This is my personal analysis based on current data. Markets are unpredictable. Trade responsibly. Manage your risk. Do your own research.
If you found this analysis valuable, feel free to boost/share. Let's see who's still standing when IG:BITCOIN crosses $150K.
────────────────────────────────────

BTCUSD: The resistance level at 105,000 remains firmBTC rebounded above 104,000 on Friday but then came under pressure and pulled back. It traded in a narrow range between 101,400 and 104,000 throughout Saturday, which also confirms the accuracy of our prediction about the resistance level at 105,000. Bitcoin can only see sustained gains if it breaks through 105,000 and stands firmly above 108,000.

BTCUSDBased on the counting of correction waves, we can expect such a movement from Bitcoin on the 4-hour timeframe

BTCLooks like somehow there will not be any bull market, since the BTC ETF the structure of the crypto market has changed already and now mostly it is uncertainty for any trade position.
To me BTC must fall under 90k and remain there for some time, after that maybe we could see some ALTS season.
lets wait and see if this will happen during december for btc to fall and january to see ALTS market
NFA
DYOR

BTC to Gold Cracking Lower! CAUTION!This could end up turning into a significant crack! for BTC relative to Gold. We have a fight on our hands between Speculation (BTC) and a Safe asset (Gold)
For over 4 years, speculation has not been able to outperform safety, and it is now starting to break lower.
CAUTION! is in order!
Click boost, follow, for more authentic, no BS, raw analysis. Let's get to 5,000 followers. ))


Bitcoin 17.30pm Candle Strategy - 2 days success Bitcoin 17.30pm Candle Strategy - 2 days success
Check out full video in yt channel.. Catchandreadtradingtools..
BTC Bullish Zigzag Pattern (Elliott Wave)As an isolated, short-term pattern, BTC has formed into a near-perfect zigzag pattern. Wave-A is a violent monowave. Wave-B retraces exactly 61.8% of A and is structurally a flat pattern and a polywave. Wave-C relates to (A+B)/2 in time, 80% of wave-A in price, and is an impulsive wave.
Beyond the Neowave considerations, there's also a clear bullish momentum divergence, multi-peak AO, daily/4hr 1st wiseman, and 4hr 2nd wiseman (fractal).
Given all these considerations, and without considering the longer-term pattern, we are set for a decent bounce here which could potentially go to new all time highs.
After speaking privately with Glenn Neely, he also thinks BTC is nearing the final blow-off phase which could take us as high as $250k, and ending sometime early next year.
While I personally feel less confident about any long-term count now given multiple possibilities, at the very least, I think it's a good idea to be on the long-side here unless we clearly break through the $98-93k range. Especially because of this short-term pattern in isolation meeting all the normal signals I look for in a bottom pattern.
As things continue to develop it may be easier to see a single longer-term count emerging, especially as we near the conclusion of the long-term pattern. For now, it doesn't make a big difference what exactly the count for the long-term wave up is, just that there's a very high probability it is not yet finished and we are hitting a short-term bottom now.

btc await breakout to buy or sell#BTCUSD is in middle of pattern rejection which will take off on sell till 104k-102600. But first we await for 3 times breakout below 105500 to sell.
Sell stop at 105500 on 3 times breakout cause of rejection or reverse on buy, target 104k-102600.
If price reverse back above 106600 then bullish continuation is possible, target 107300-108600.

Long Bitcoin take profits just above ATHQuick video analysis with tutorial of the fake break of the head and shoulders top. Nice tight stop just below $100k on entry last Friday at $101k
