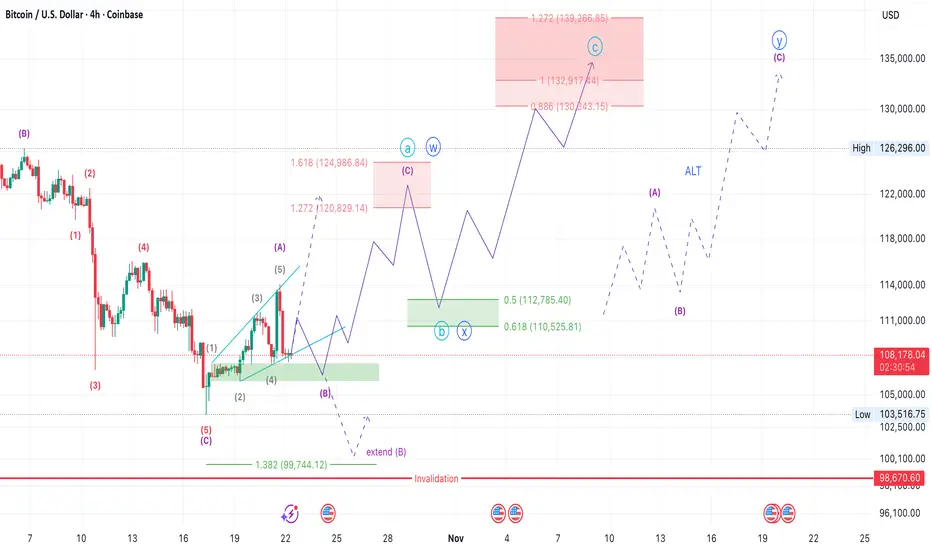
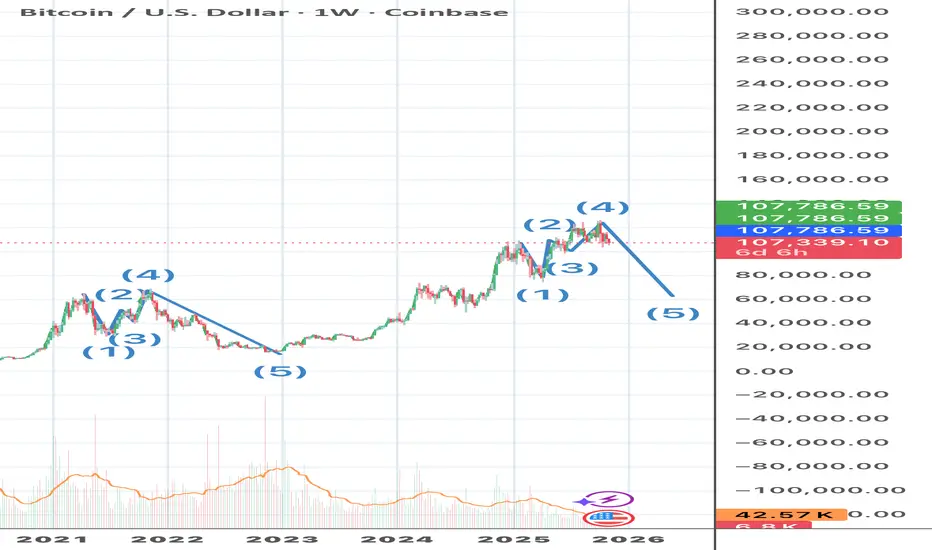
BTCUSD – Completing the Final Leg of the Ending DiagonalTechnical Overview
Bitcoin appears to be developing the final micro-structure inside Wave 5 of a larger ending diagonal pattern, which aligns with the broader weekly count.
After the recent low near $103500, price began forming a corrective rise that may represent wave ABC OR WXY of the final push to complete the terminal pattern.
The current 4H projection suggests that BTC will building subwave (C) within a potential W–X–Y structure. The next impulsive move could lift prices toward $130K–$139K, completing the upper boundary of the diagonal before a major reversal begins.
Key Levels:
Support / Buy Zone: 106 – 107k
First Target: 120 - 124k
Main Target Zone: 130 – 139k
Invalidation: Below 99,744 (1.382 Fib level) which will invalidate the idea of extended wave B
Summary:
BTC is in the final phase of an extended ending diagonal, likely completing wave (5) of (V).
The short-term setup remains bullish toward 130–139K, but traders should prepare for a major macro reversal once that zone is reached.
Momentum divergences and weakening volume will be key confirmation signals for the top.
Trade ideas
Bitcoin is going to hit 50% again for the third time! Be readyBitcoin on the weekly and monthly time frame has hit 50% retracement level before major move up. This will be the third time hitting it. We will see 100k-99k before major move up. This will be the last leg up before a major drop.

Bitcoin Tests $100K Support as Bearish Momentum AcceleratesBitcoin has come under renewed selling pressure, sliding sharply toward the key $100,000 psychological and structural support area. The price has now broken below the 50-day simple moving average (SMA) and is testing the 200-day SMA, signaling a significant test of trend integrity after months of consolidation between $100,000 and $123,000.
The 50-day SMA has turned lower, reflecting weakening medium-term momentum, while the 200-day SMA remains upward-sloping, maintaining the broader bullish framework. A daily close below the $100,000 support would represent a potential shift in long-term sentiment, whereas a rebound from this zone could keep Bitcoin within its established range.
Momentum indicators underscore the recent downside pressure: the MACD remains below its signal line, extending its bearish crossover, and the RSI has slipped to around 35, approaching oversold conditions last seen during earlier correction phases.
Overall, Bitcoin is at a pivotal juncture — the $100K region serves as both a technical and psychological inflection point that may determine whether the broader uptrend can reassert itself or give way to deeper consolidation.
-MW

Bitcoin has run its courseBitcoin has run its course and is now meeting its final destination. It had a good run, but this leg of the crypto saga is now concluding. There is a bitcoin upgrade out there ready to take the reigns soon to carry the next leg forward.
The Dark Reality of Leverage: When Trading Becomes GamblingWant to lose all your money fast? Just open an account on a crypto exchange and start trading with leverage.
The truth is, the odds of success in a casino are about 14%, but in day trading — only 0.5%.
That’s not opinion — that’s statistics.
Take it from someone who’s been in the markets for years: sometimes, the best trade is not to trade.
(This post is for educational purposes only and not financial advice.)

BUY SETUP – BTC/USD (Smart Money Concept)Analysis:
Price is forming a rising wedge near short-term liquidity. A break below the wedge is expected to sweep liquidity into the demand zone around 107,457 – 108,000, which aligns with previous structural imbalance and unmitigated order block.
Trade Plan:
Wait for a liquidity grab below the wedge and bullish confirmation inside the demand zone. Target the 112,820 – 113,000 resistance area, which aligns with previous high and key supply zone.
Entry Zone: 107,800 – 108,200
Stop Loss: Below 107,400
Take Profit: 111,400 / 112,800
Risk–Reward: ≈ 1:3
Concept:
Liquidity sweep below wedge pattern
Demand zone + FVG confluence
Smart money reaccumulation before continuation

BTC/USD – Smart Money Concepts | Long SetupPrice has recently formed a Change of Character (CHoCH) at a key demand zone, signaling a potential bullish reversal from the weak low. After multiple BOS and CHoCH confirmations, buyers seem to be stepping in to reclaim short-term structure.
Key Points:
Structure: Market broke bearish structure but formed a CHoCH, indicating possible accumulation.
Demand Zone: Price is reacting from a lower imbalance/OB area around 106,500–108,000 USD.
Liquidity: Liquidity likely resting above internal highs; targeting the 113,250 USD level.
Invalidation: A clean break below 106,375 USD would invalidate this bullish scenario.
📈 Trade Idea:
Entry: 107,800–108,500 USD (demand zone)
Target: 113,250 USD (liquidity above equal highs)
Stop: Below 106,375 USD
Risk:Reward: ~1:3
Bias: Bullish short-term move within overall corrective structure. Watching for continuation confirmation before full entry.

BTCPreferably suitable for scalping and accurate as long as you watch carefully the price action with the drawn areas.
With your likes and comments, you give me enough energy to provide the best analysis on an ongoing basis.
And if you needed any analysis that was not on the page, you can ask me with a comment or a personal message.
Enjoy Trading ;)

BTCUSD — Pre-New York Session🧭 Context
Bitcoin is pulling back on the hourly without delta following — a clear Delta Divergence.
Key bearish structure: 104 584.
Imbalance: 104 268.
If price closes below these within the next 15 minutes, retracement higher into the NY session becomes likely.
📊 Technical Frame
Volume delta remains ultra-low while price presses higher — signaling a potential fake move.
The U.S. Dollar hovers sideways in its 4-hour structure, holding range highs.
Confluence is light; precision is required.
🌍 Macro Overview
Crypto sentiment is cautious. Short-term flows favor defensive positioning.
Dollar holds firm but lacks expansion — macro tone remains indecisive ahead of U.S. session liquidity.
🎯 Takeaway
Delta Divergence marks exhaustion, not opportunity.
Let confirmation form at 104 584 / 104 268 before engagement.
— CORE5DAN
Institutional Logic. Modern Technology. Real Freedom.

BTC UpdateWell, looks like my initial guess over the weekend was right. It's gonna retest the blue line then bounce. Looks like it needs one more drop this week though because daily MFI has not hit oversold and the pennant target zone has not yet been reached.
Also, 3 hr indicators sort of work. Indicators can go severely overbought or oversold, especially when the stock market sells off.

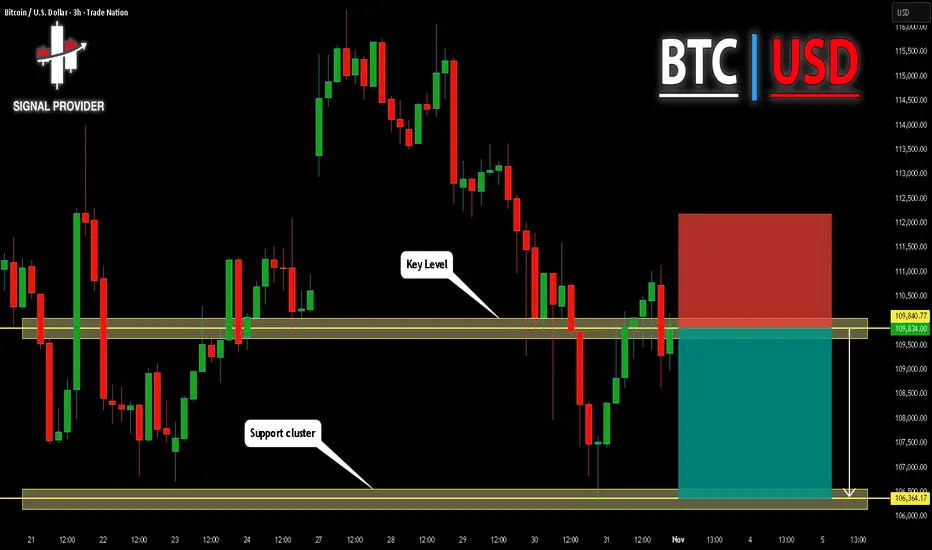
BITCOIN Will Go Down! Sell!
Please, check our technical outlook for BITCOIN.
Time Frame: 3h
Current Trend: Bearish
Sentiment: Overbought (based on 7-period RSI)
Forecast: Bearish
The market is trading around a solid horizontal structure 109,840.77.
The above observations make me that the market will inevitably achieve 106,364.17 level.
P.S
The term oversold refers to a condition where an asset has traded lower in price and has the potential for a price bounce.
Overbought refers to market scenarios where the instrument is traded considerably higher than its fair value. Overvaluation is caused by market sentiments when there is positive news.
Like and subscribe and comment my ideas if you enjoy them!
BTC faces a crash, can it hold the $100000 mark?#BTCUSD BITSTAMP:BTCUSD BINANCE:BTCUSDT BITSTAMP:BTCUSD BINANCE:BTCUSDT
Affected by market news, BTC's hourly chart showed a large bearish candlestick, falling to a low of around 104000. Currently, regardless of the time frame, BTC has reached the lower Bollinger Band area, and all moving averages across different timeframes are trending downwards in tandem, with the MACD indicator showing a bearish crossover and increasing volume. There are no signs of a technical reversal yet, and in the short term, BTC still has room for further downward correction.
If 104000 is breached again, BTC may further decline to 102000-101000, or even the psychological level of 100000. It's only a matter of time, and the bulls will temporarily back down.
Therefore, if BTC rebounds to 105500-106500 in the short term, shorting BTC can be considered.

Bitcoin BullishThis crypto has been bearish for the past few days, and has reached a POI, 1 H our demand Zone.
I anticipate a slight bullish pullback towards the 109 - 110k supply Zone.

4 HOUR TIME FRAME BEARISH BITCOINA BAT BEARISH PATTERN MIGHT BE HAPPENING FOR BITCOIN FOR SHORT TERM,
Nothing to say more,
Just check my Technical Analysis for more info,
just leave a comment if you have questions!
Lets goooo!

Bitcoin short: Relabelling of Waves and Fibo Extension LevelFirstly, apologies that the margin statistics is not shown nearing the end of the video.
Here's the last few months of data that I am talking about:
Year-Month Debit Balances in Customers' Securities Margin Accounts Free Credit Balances in Customers' Cash Accounts Free Credit Balances in Customers' Securities Margin Accounts Ratio (B/D)
2025-06 1,007,961 200,573 185,584 5.431292568
2025-07 1,022,548 194,712 186,672 5.477779206
2025-08 1,059,723 188,221 181,563 5.836668264
2025-09 1,126,494 204,106 194,884 5.780330863
The last column in the table above is the leverage ratio based on using column B divide by column D. Column B being the value of securities in a customer's margin account and column D being the amount of cash supporting the securities. So we are at historical high in terms of both leverage and nominal amount.
You can get this statistics from www.finra.org
Take note that Sep is the last data point due to government shut down.

Why is shorting profitable now? 3 key signalsCritical support "slipping past the edge", with the downward door wide open
The current price of $107,080 is exactly on the $107,000 - $107,500 "life line", which is both a key support at the daily level and coincides with several long-term moving averages. This range has held up several times before, but now it is in a precarious state. More importantly, the price has been hovering below the support level for 3 consecutive days, like an unstable old wall, and a slight external force could cause it to collapse - and historical data shows that if this support is effectively broken, it usually drops by 5% - 15%, with the next target being $105,000 or even lower.
The bulls are being "pushed to the ground and rubbed", and the liquidation wave is still ongoing
In the past 24 hours, the total net liquidation of Bitcoin bulls across the network exceeded $60 million, accounting for 95.88% of the total liquidation amount. It's like the "gamers betting on an increase" being collectively forced to stop trading, and the buying power has been exhausted. More intuitively, the long positions in mainstream exchanges have almost been "cleared", with the proportion of long positions in platforms like Bybit and CoinEx exceeding 97%. The remaining bulls are also like frightened birds, and a slight decline will trigger panic selling, further accelerating the decline.
The Fed "dampens the flames", and the expectation of interest rate cuts has completely cooled down
Previously, everyone thought that the interest rate cut would continue in December, so they were bold enough to buy Bitcoin. Now, Federal Reserve Chair Powell clearly stated that "the interest rate cut in December is far from guaranteed", and the market's expectation of interest rate cuts has dropped from 90% to 67.8%. This means that "cheap money" will be less available. For high-risk assets like Bitcoin, no one is willing to buy heavily again; instead, they will sell and convert to stable assets like dollars and bonds, and the price will naturally lose support.
Today's Bitcoin Trading Strategy
sell:107000-108000
tp:106000-105000
sl:109000
BTC///CRITICAL ZONE///WATCH FOR 95K BRAKEHello, if BTC go to 95k and lower this is critical, it might wick and go back to channel, but if start closing weekly candles below 95k its bearish.

Bitcoin BTC Bears Regain Control: Watching for a Short Setup 📊 Bitcoin Analysis (BTCUSD)
Currently, Bitcoin is showing clear bearish intent on the higher timeframes 🧭. After an extended period of range-bound price action, we’ve now seen a decisive displacement to the downside 💥 — a strong signal that sellers are taking control.
From here, I’ll be watching for a retracement back into equilibrium ⚖️ — the 50% level of the most recent swing — and will then look for signs of rotation and a break of structure 🧩 on the 30-minute chart to confirm a potential short setup 📉.
Patience is key here 🕰️ — I want to see price react efficiently to that retracement before considering entries.
⚠️ Disclaimer: This is not financial advice. Always conduct your own analysis before taking any trade.

BTCSupport will hold for $BTC. This looks like the final visit to the bottom before a major blast off from the megaphone pattern. Structure remains intact, and momentum is coiling up for a powerful move to the upside.

Bitcoin: You Need to Know This Before it HappensIt’s time I share something that’s consistently paid off for me, and I want you to understand it too, because there’s enough opportunity for all of us to win.
Here’s the truth: Bitcoin and most modern assets aren’t just traded by people anymore, they’re traded by algorithms. These systems follow patterns that, once you recognize them, become surprisingly predictable and profitable.
Each market cycle follows the same rhythm: a powerful bull run, massive profit-taking, and then a reset. But here’s what’s key, with every new cycle, large institutions are stepping in with bigger positions and deeper leverage. That’s why these patterns grow wider and taller each time, the scale increases right along with the money flowing in.
We’ve now reached the top of this current cycle, completing a familiar algorithm that’s played out again and again.
So what does this mean for you?
If you’re into shorting, this is the window to consider it. If you’d rather ride the next bull wave, patience will pay, wait for the price to retrace near $60,000. That’s where the next opportunity begins. And the next cycle? It’ll be even bigger, longer, taller, and more explosive than before.
The more you understand these repeating patterns, the more power you hold in the market. Let’s keep learning, growing, and profiting, together.
BTC LONG TERM CUP & HANDLEBTC LONG TERM CUP & HANDLE on WEEKLY CHART.
usually cup and handle shows promising upside break. wait and watch for now.

BTCUSD — RangeBTCUSD — Range Dilemma
🧭 Context
BTC attacked the daily volume low at 106 463.30 — precise hit, clean reaction, but no reclaim yet.
Price stalled under that zone through NY session, keeping structure heavy while the dollar impulse held firm.
The move reflects a controlled liquidity sweep, not yet a shift in intent.
📈 Technical POV
We’re parked at the 106 463.30 daily volume node, the structural hinge of the current range.
A close below confirms algorithms pressing the next leg lower.
If we reclaim and hold above, the path opens toward 111 629, the next liquidity magnet capped by a single-print zone.
Daily structure remains stretched; weekly bias still corrective.
🌍 Macro View
Dollar strength persists after the Fed’s “pause for now” tone and steady 4 % yields.
Global risk tone stays cautious — crypto remains reactive, not leading.
Until DXY cools off, BTC trades inside compression with limited directional clarity.
🎯 Plan
Patience first.
Wait for a 1-hour structure shift to confirm bias.
If the dollar corrects, BTC can rotate higher; if not, expect continued testing near the lows.
🧠 CORE5 Note
Professionals don’t chase noise.
They let structure prove strength before conviction follows.
Institutional Logic. Modern Technology. Real Freedom.

Bitcoin Trades Within Defined Channel — Liquidity Below $100KBitcoin continues to move within a well-defined trading channel, with the range high at $126,000 and the range low sitting just below $100,000. This clear structural formation highlights a period of controlled consolidation, where price oscillates between two major liquidity zones.
Given the current positioning, momentum favors a rotation toward the range low, as bearish liquidity builds below the current trading area. This potential sweep of downside liquidity would align with Bitcoin’s typical range behavior — taking out weak lows before initiating another expansion phase back toward the range high.
Key Points:
- Range Structure: Well-established channel between $126K (high) and sub-$100K (low).
- Liquidity Bias: Bearish liquidity beneath current levels increases probability of a move lower.
- Range Continuation: Liquidity sweep below $100K could fuel the next rotation upward.
From a technical perspective, Bitcoin remains range-bound, but the next significant move will depend on how the market reacts around the $100K liquidity pocket.
What to Expect:
Expect a short-term dip toward sub-$100K levels as liquidity is cleared, followed by a potential rotation back toward $126K to maintain the broader range structure.
